Coca-Cola Company (The) — KO
| Close Price | Market Cap | P/E Ratio | Forward P/E Ratio | Implied Growth* | Implied Forward Growth* | Dividend | P/B Ratio |
|---|---|---|---|---|---|---|---|
| $79.01 | $339.94B | 24.8 | 22.7 | 14.0% | 13.0% | $2.12 2.7% | 10.1 |
Latest Headlines
- · Bonds May Finally Be Ready to Give Stocks a Run for Their Money
- · Coca-Cola’s America250 Push Highlights Packaging Rewards And Plastic Risks
- · VYM Climbs 26% In a Year While Its Core Dividend Payers Extend Their Streaks
- · Want $1,400 in Passive Income? Invest $10,000 Into These 4 Dividend Stocks
- · 5 Warren Buffett Stocks to Hold Forever
- · Pepsi makes big change to counter Coca-Cola
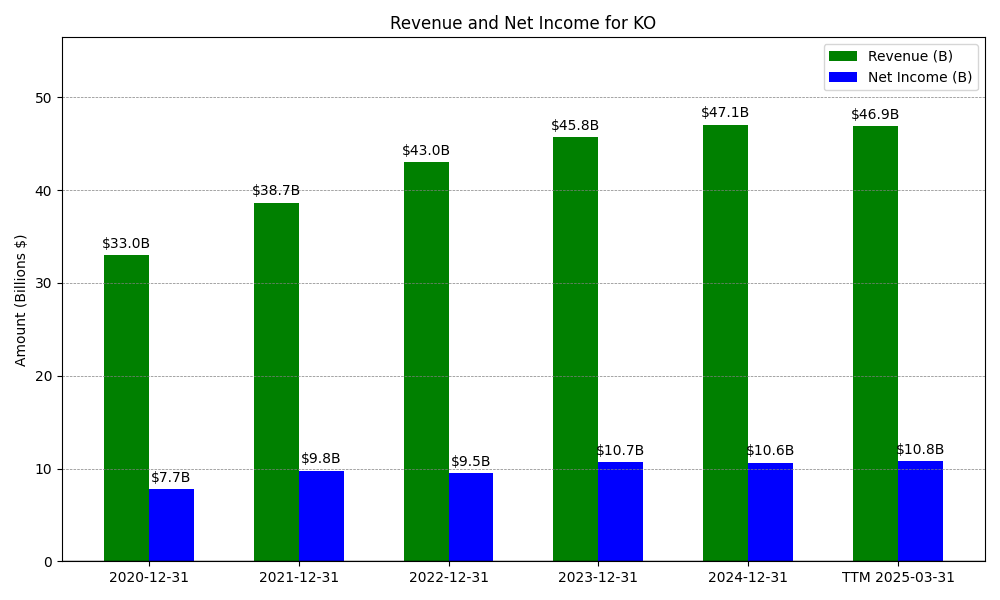
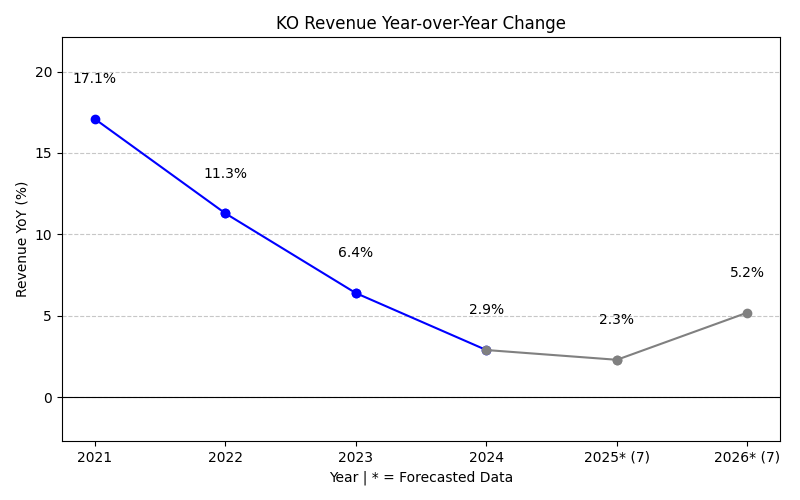
Revenue & Net Income
| Date | Revenue | Net_Income | EPS | Last_Updated | Revenue_Change | Net_Income_Change | EPS_Change | |
|---|---|---|---|---|---|---|---|---|
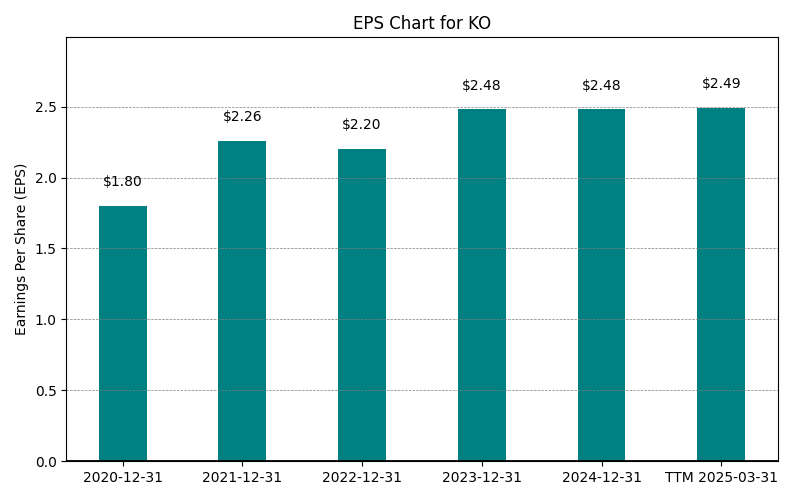
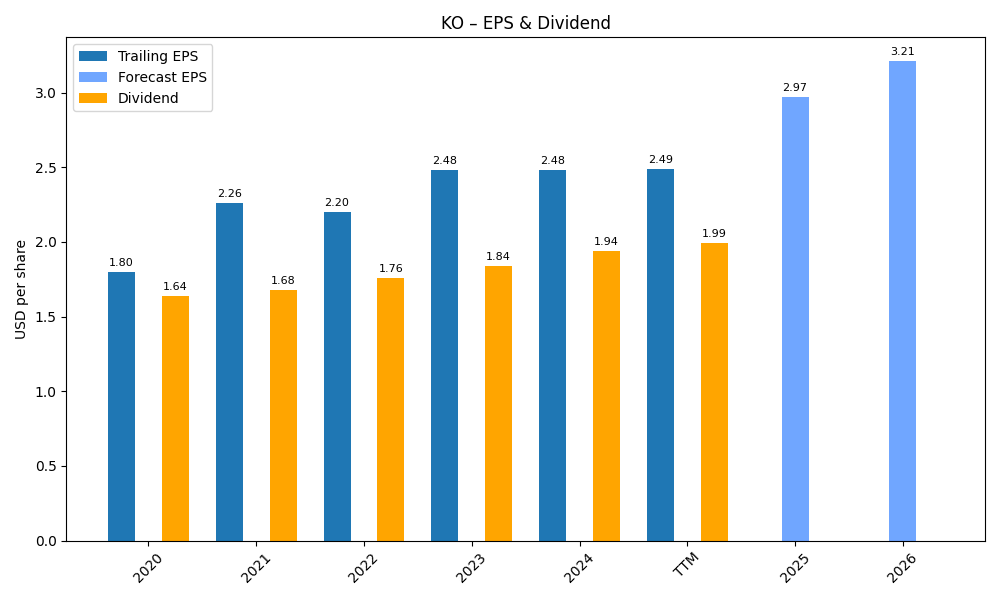
| 0 | 2020-12-31 | $33,014M | $7,747M | $1.80 | 2024-02-09 04:07:10 | N/A | N/A | N/A |
| 1 | 2021-12-31 | $38,655M | $9,771M | $2.20 | 2026-02-27 13:31:56 | 17.1% | 26.1% | 22.2% |
| 2 | 2022-12-31 | $43,004M | $9,542M | $2.20 | 2026-05-29 09:10:19 | 11.3% | -2.3% | 0.0% |
| 3 | 2023-12-31 | $45,754M | $10,714M | $2.48 | 2026-05-29 09:10:19 | 6.4% | 12.3% | 12.7% |
| 4 | 2024-12-31 | $47,061M | $10,631M | $2.47 | 2026-05-29 09:10:19 | 2.9% | -0.8% | -0.4% |
| 5 | 2025-12-31 | $47,941M | $13,107M | $3.05 | 2026-05-29 09:10:19 | 1.9% | 23.3% | 23.5% |
| 6 | TTM 2026-03-31 | $49,284M | $13,701M | $3.18 | 2026-04-30 08:50:28 | 2.8% | 4.5% | 4.3% |
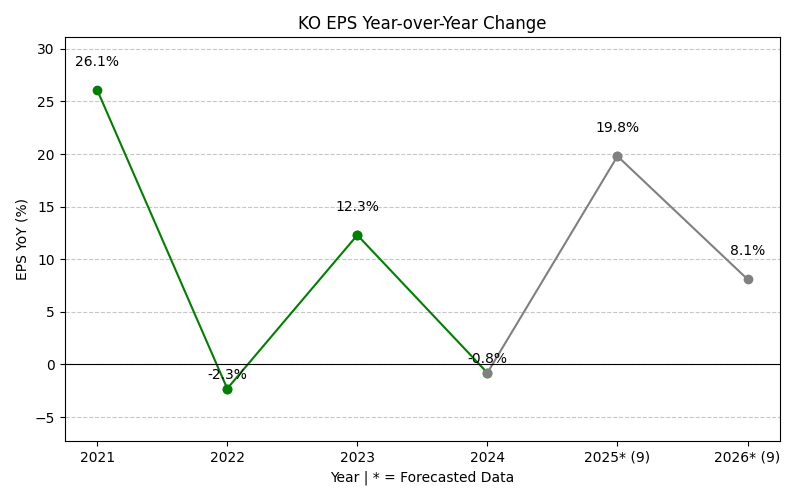
EPS
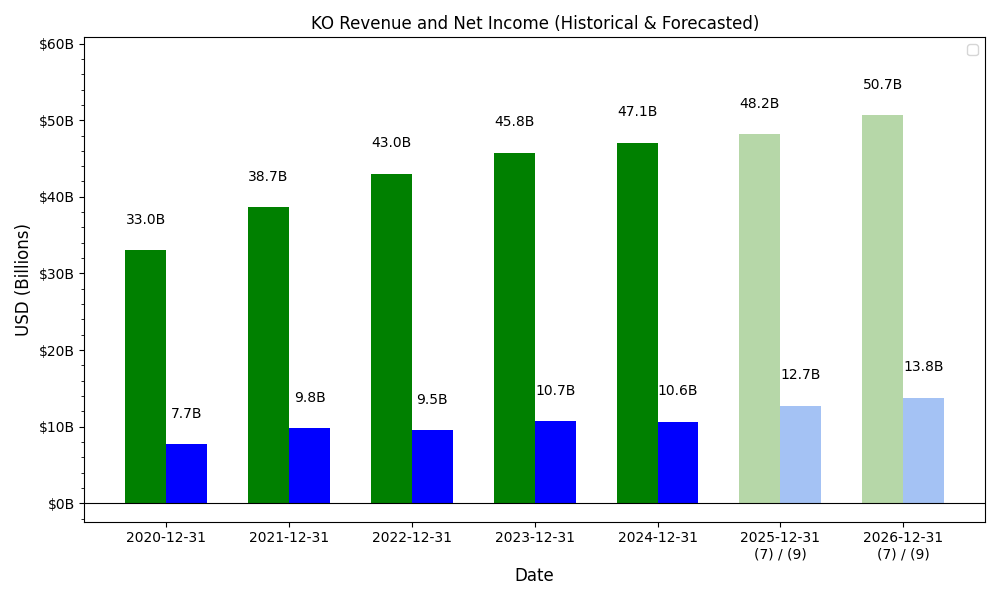
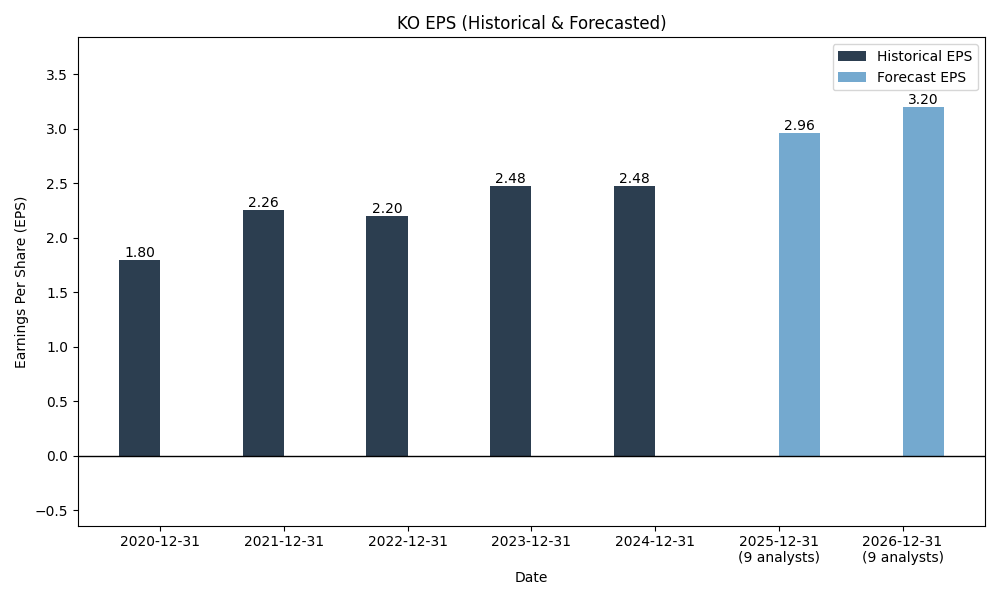
Forecasts
Y/Y % Change
KO Year-over-Year Growth
| 2020 | 2021 | 2022 | 2023 | 2024 | 2025 | 2026 | 2027 | Average | |
|---|---|---|---|---|---|---|---|---|---|
| Revenue Growth (%) | 17.1% | 11.3% | 6.4% | 2.9% | 1.9% | 2.4% | 1.9% | 6.3% | |
| Revenue Analysts (#) | 0 | 0 | 0 | 0 | 0 | 0 | 18 | 19 | |
| EPS Growth (%) | 26.1% | -2.3% | 12.3% | -0.8% | 23.3% | 7.2% | 6.7% | 10.4% | |
| EPS Analysts (#) | 0 | 0 | 0 | 0 | 0 | 0 | 23 | 23 |
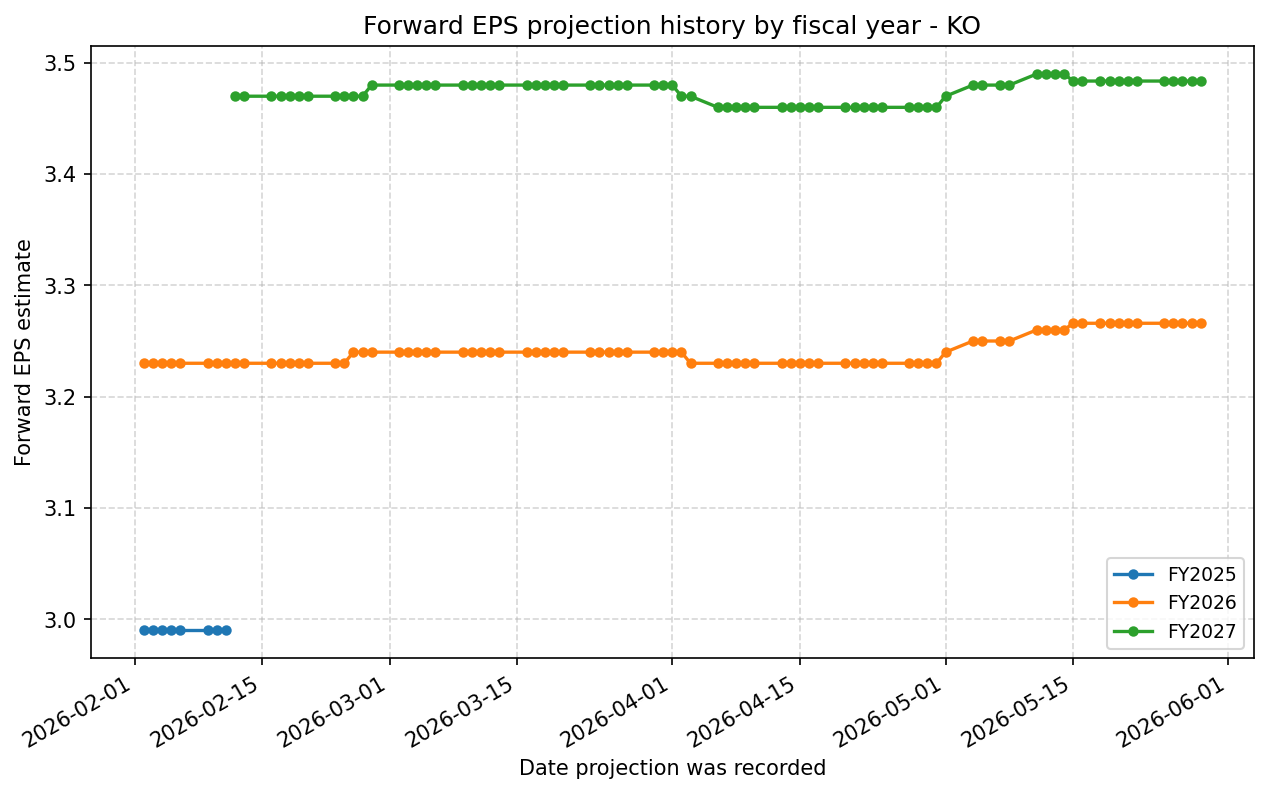
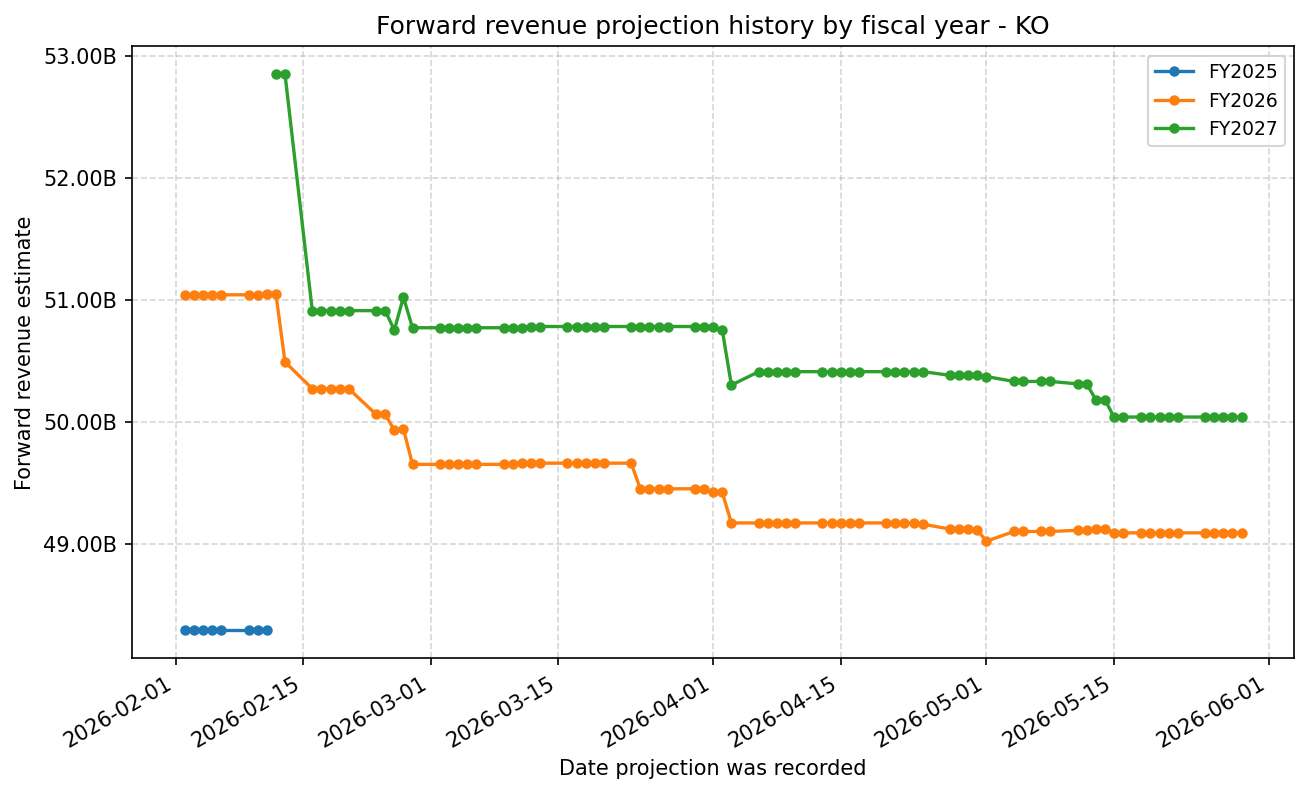
Forward Estimate History
How the next-FY EPS and revenue estimates have drifted over time. One line per fiscal year – past lines end when that FY became current.
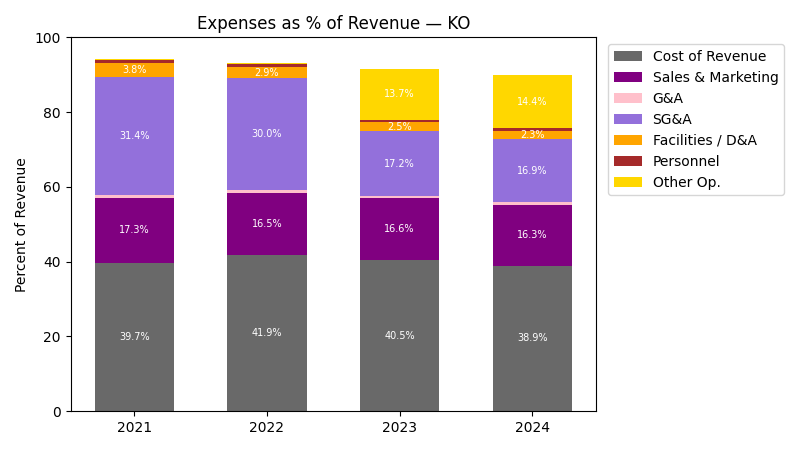
Expenses
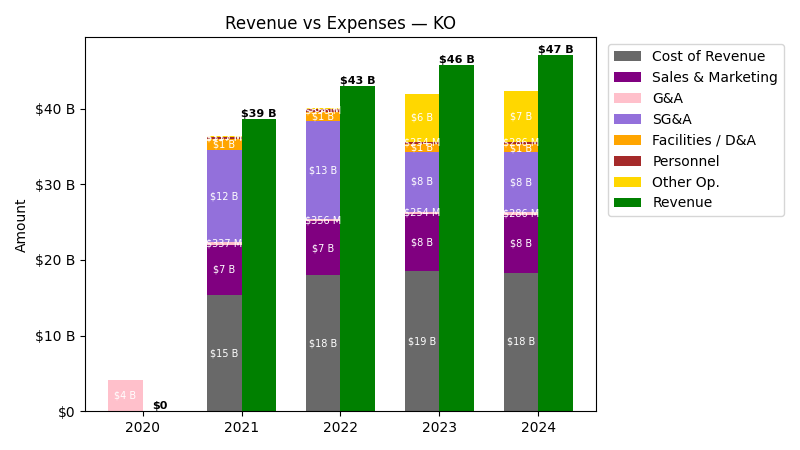
| Year | Revenue ($) | Cost of Revenue ($) | Sales & Marketing ($) | G&A ($) | SG&A ($) | Facilities / D&A ($) | Personnel ($) |
|---|---|---|---|---|---|---|---|
| 2022 | $43.0B | $16.7B | $7.1B | $356.0M | $12.9B | $1.3B | $356.0M |
| 2023 | $45.8B | $17.4B | $7.6B | $254.0M | $14.0B | $1.1B | $254.0M |
| 2024 | $47.1B | $17.2B | $5.1B | $9.5B | $14.6B | $1.1B | $286.0M |
| 2025 | $47.9B | $16.3B | $5.4B | $9.1B | $14.5B | $1.1B | $279.0M |
| TTM | $49.3B | $16.8B | $5.7B | $9.1B | $14.8B | $1.0B | $0.0 |
| Year | Revenue Change (%) | Cost of Revenue Change (%) | Sales & Marketing Change (%) | G&A Change (%) | SG&A Change (%) | Facilities / D&A Change (%) | Personnel Change (%) |
|---|---|---|---|---|---|---|---|
| 2023 | 6.39 | 3.89 | 7.38 | -28.65 | 8.48 | -10.48 | -28.65 |
| 2024 | 2.86 | -0.82 | -32.97 | 3633.07 | 4.37 | -4.70 | 12.60 |
| 2025 | 1.87 | -5.43 | 5.88 | -3.81 | -0.42 | -2.33 | -2.45 |
| TTM | 2.80 | 2.84 | 5.33 | -0.55 | 1.64 | -0.29 | -100.00 |
No unmapped expenses.
Segment Performance
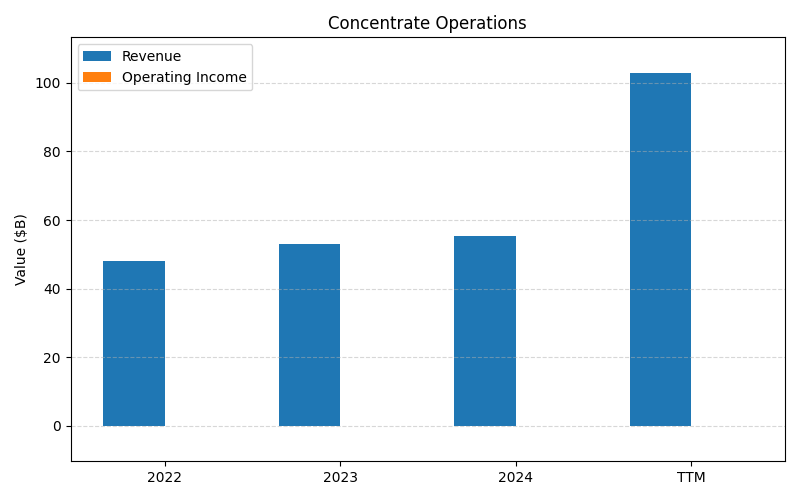
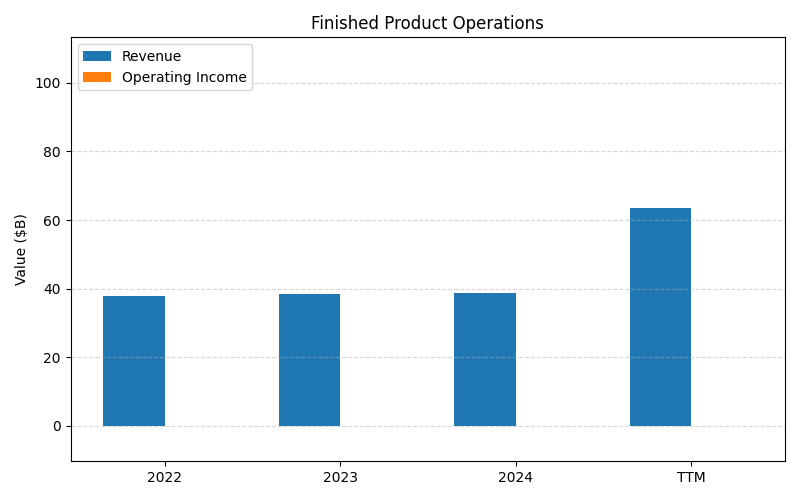
SEGMENTS v2025-09-09 · 2026-05-29 09:10 UTC — Units: $B. Rows list fiscal years (last 3 + TTM) with revenue for each segment; the final row shows the TTM revenue mix (operating income columns display “—” where mix is not applicable).
| Year | Concentrate Operations Rev | Finished Product Operations Rev | Total Rev |
|---|---|---|---|
| 2023 | 53.1B | 38.4B | 91.5B |
| 2024 | 55.5B | 38.7B | 94.1B |
| 2025 | 56.9B | 39B | 95.9B |
| TTM | 140.3B | 96.9B | 237.2B |
| % of Total (TTM) | 59.2% | 40.8% | 100% |
Segment Performance (Axis 2)
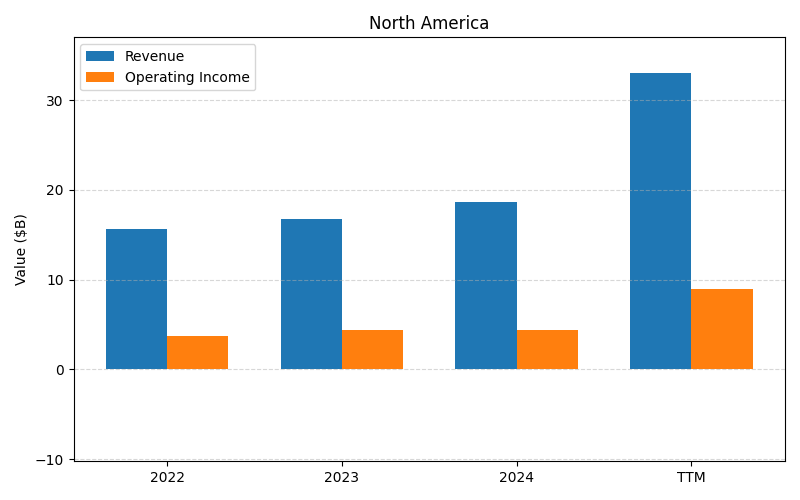
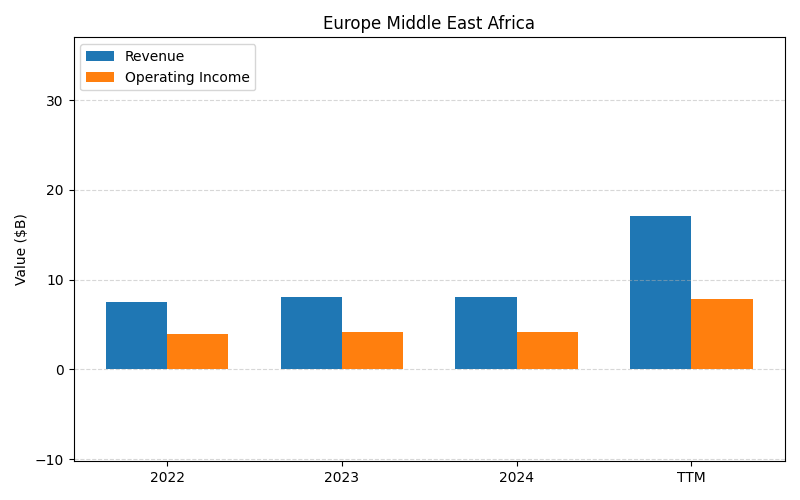
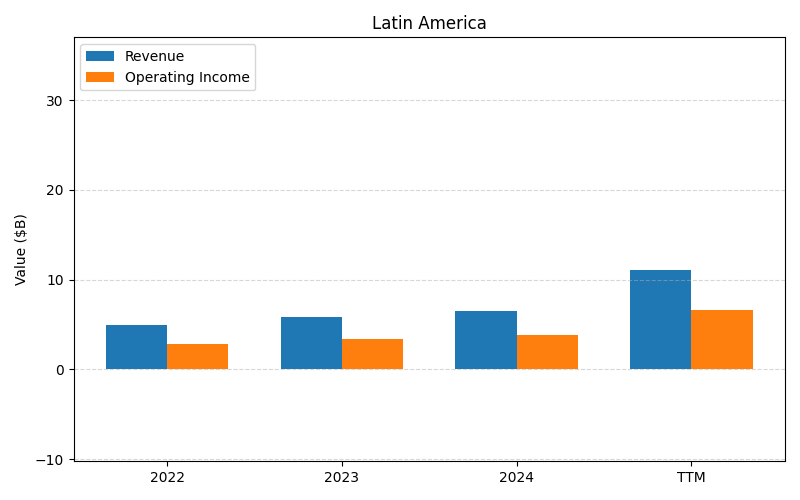
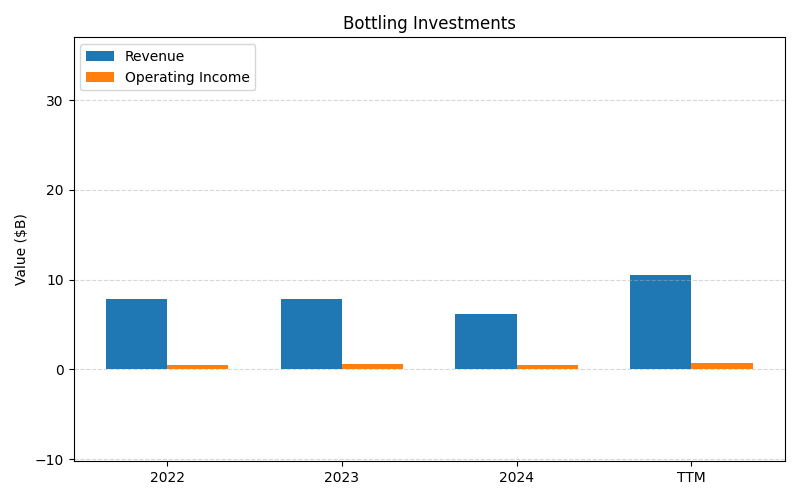
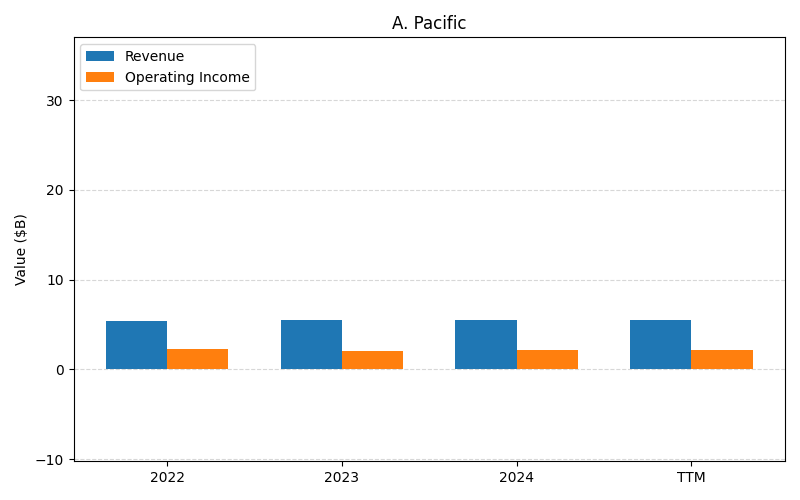
SEGMENTS v2025-09-09 · 2026-05-29 09:10 UTC — Units: $B. Rows list fiscal years (last 3 + TTM) with revenue and operating income for each segment; the final row shows the TTM revenue mix (operating income columns display “—” where mix is not applicable).
| Year | North America Rev | North America OI | Europe Middle East Africa Rev | Europe Middle East Africa OI | Latin America Rev | Latin America OI | Bottling Investments Rev | Bottling Investments OI | A. Pacific Rev | A. Pacific OI | Total Rev | Total OI |
|---|---|---|---|---|---|---|---|---|---|---|---|---|
| 2023 | 17B | 4.63B | 10.8B | 4.32B | 5.83B | 3.44B | 7.86B | 0.58B | 5.54B | 2.06B | 47B | 15B |
| 2024 | 18.9B | 4.56B | 11B | 4.25B | 6.47B | 3.79B | 6.22B | 0.50B | 5.59B | 2.16B | 48.1B | 15.3B |
| 2025 | 19.6B | 5.07B | 11.5B | 4.30B | 6.33B | 3.74B | 5.74B | 0.43B | 5.64B | 2.04B | 48.8B | 15.6B |
| TTM | 47.7B | 12.6B | 28.1B | 10.9B | 16B | 9.48B | 15.1B | 1.23B | 14.2B | 5.36B | 121B | 39.5B |
| % of Total (TTM) | 39.4% | — | 23.3% | — | 13.2% | — | 12.4% | — | 11.7% | — | 100% | — |
Balance Sheet
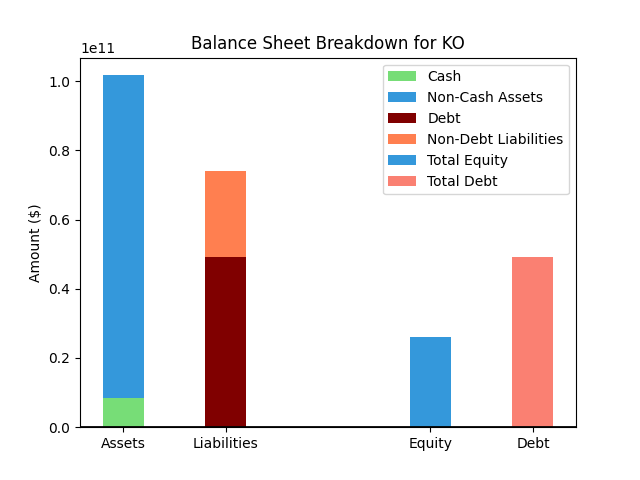
| Metric | Value | |
|---|---|---|
| 0 | Total Assets | $104,217M |
| 1 | Cash | $10,574M |
| 2 | Total Liabilities | $68,483M |
| 3 | Total Debt | $43,890M |
| 4 | Total Equity | $33,633M |
| 5 | Debt to Equity Ratio | 1.30 |
EPS & Dividend
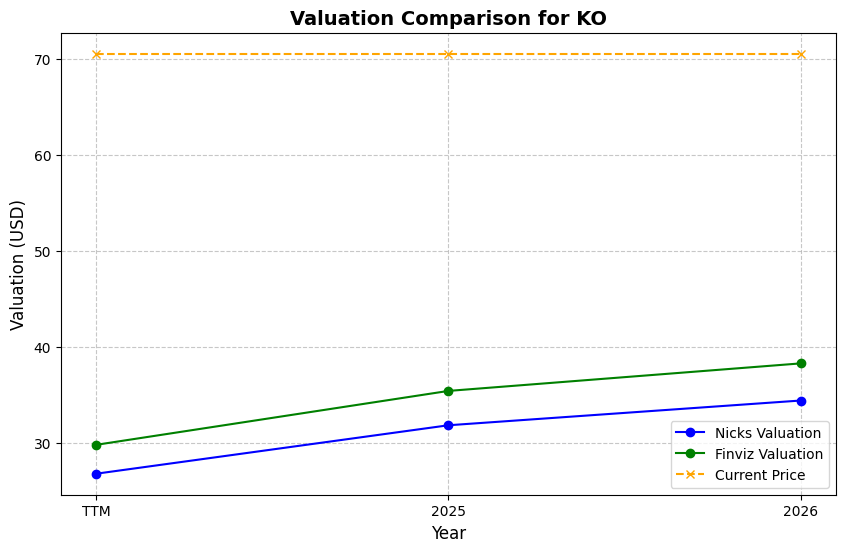
Valuation
| Share Price | Treasury Yield | Estimates | Fair Value (P/E) | Fair Value (P/S) | Current P/S | Current P/E |
|---|---|---|---|---|---|---|
| $79.01 | 4.5% | Nicks Growth: 5% Nick's Expected Margin: 23% FINVIZ Growth: 7% |
Nicks: 11 Finviz: 13 |
Nick's: 2.429 | 6.9 | 24.8 |
| Basis | Year | Nicks Valuation | Nicks vs Share Price | Finviz Valuation | Finviz vs Share Price |
|---|---|---|---|---|---|
| $3.18 EPS | TTM | $33.58 | -57.5% | $42.72 | -45.9% |
| $3.27 EPS | 2026 | $34.49 | -56.3% | $43.88 | -44.5% |
| $3.48 EPS | 2027 | $36.79 | -53.4% | $46.80 | -40.8% |
Implied Growth
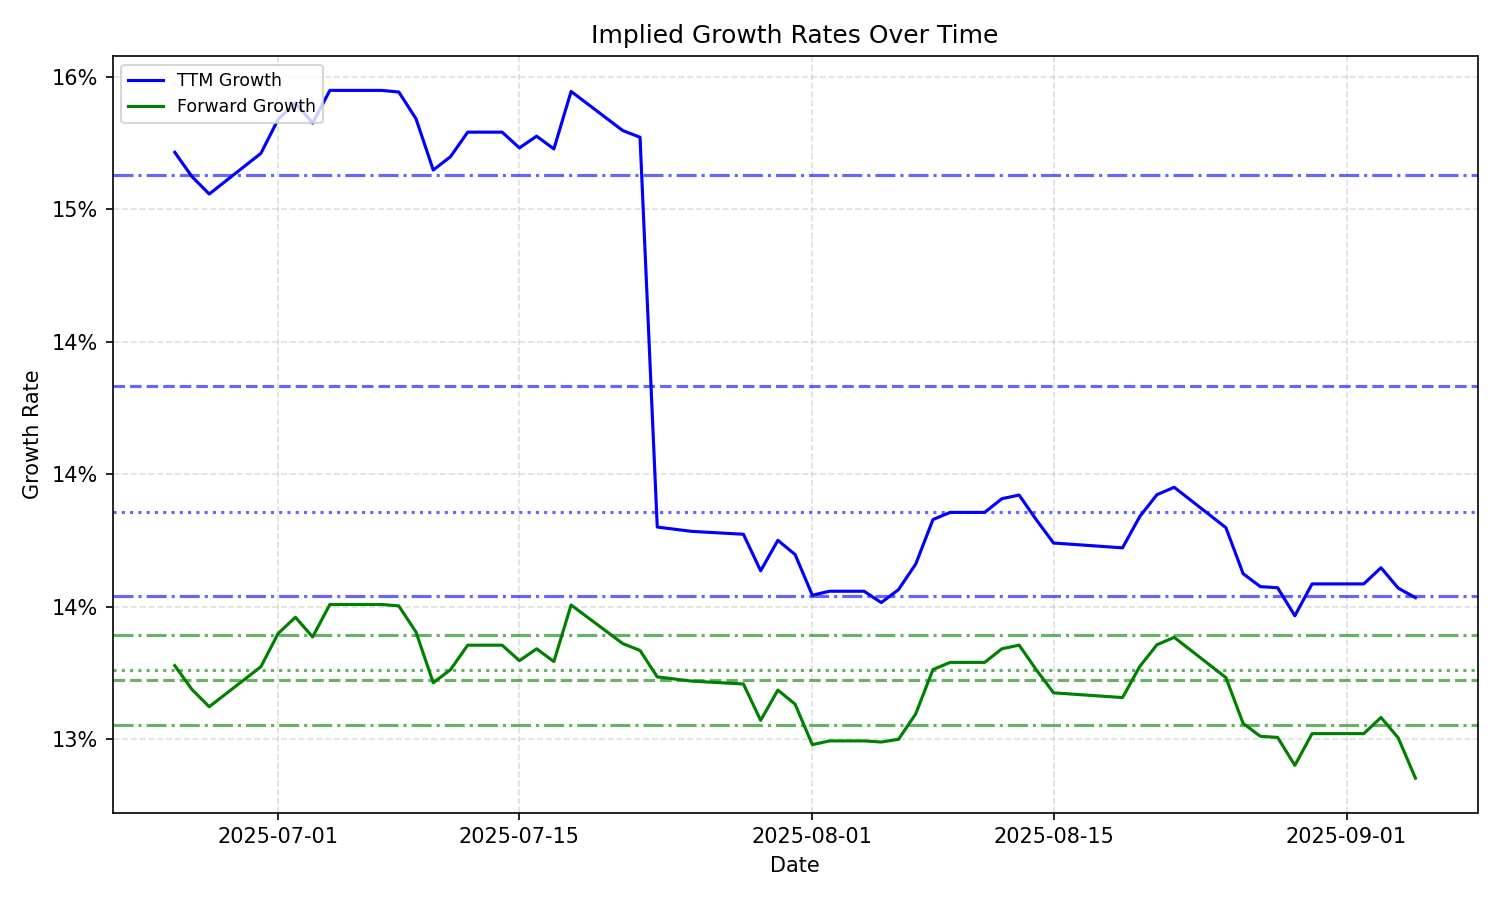
| Average | Median | Std Dev | Current | Percentile | ||||||
|---|---|---|---|---|---|---|---|---|---|---|
| TTM | Forward | TTM | Forward | TTM | Forward | TTM | Forward | TTM | Forward | |
| Timeframe | ||||||||||
| 1 Year | 13.71% | 12.89% | 13.74% | 12.90% | 0.73% | 0.39% | 14.18% | 13.18% | 79.8% | 69.5% |
| 3 Years | 13.71% | 12.89% | 13.74% | 12.90% | 0.73% | 0.39% | 14.18% | 13.18% | 79.8% | 69.5% |
| 5 Years | 13.71% | 12.89% | 13.74% | 12.90% | 0.73% | 0.39% | 14.18% | 13.18% | 79.8% | 69.5% |
| 10 Years | 13.71% | 12.89% | 13.74% | 12.90% | 0.73% | 0.39% | 14.18% | 13.18% | 79.8% | 69.5% |