The Kraft Heinz Company — KHC
| Close Price | Market Cap | P/E Ratio | Forward P/E Ratio | Implied Growth* | Implied Forward Growth* | Dividend | P/B Ratio |
|---|---|---|---|---|---|---|---|
| $24.01 | $28.47B | - | 11.4 | N/A | 5.8% | $1.60 6.7% | 0.7 |
Latest Headlines
- · 1 Consumer Stock to Keep an Eye On and 2 We Ignore
- · Go Figure: 3 big marketing numbers from May
- · The Hershey Company Names Mitchell Arends Chief Supply Chain Officer
- · Kraft Heinz to Participate in Deutsche Bank’s Annual dbAccess Global Consumer Conference
- · Kraft Dinner Serves Up Dessert for the First Time Ever with New KD Mac & Cheesecake
- · JELL O Simply Launch Puts Kraft Heinz Valuation And Debt In Focus
Revenue & Net Income
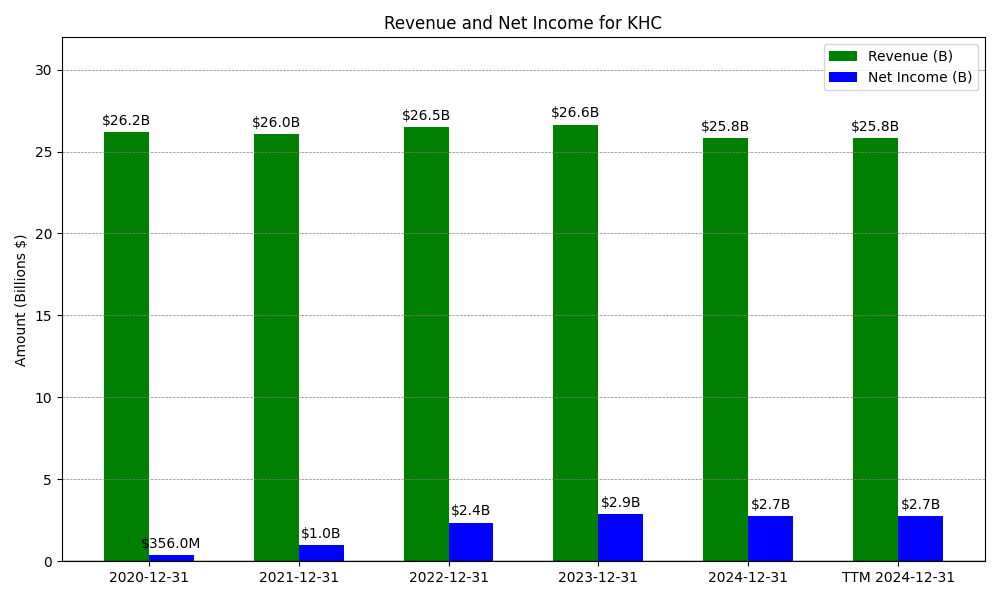
| Date | Revenue | Net_Income | EPS | Last_Updated | Revenue_Change | Net_Income_Change | EPS_Change | |
|---|---|---|---|---|---|---|---|---|
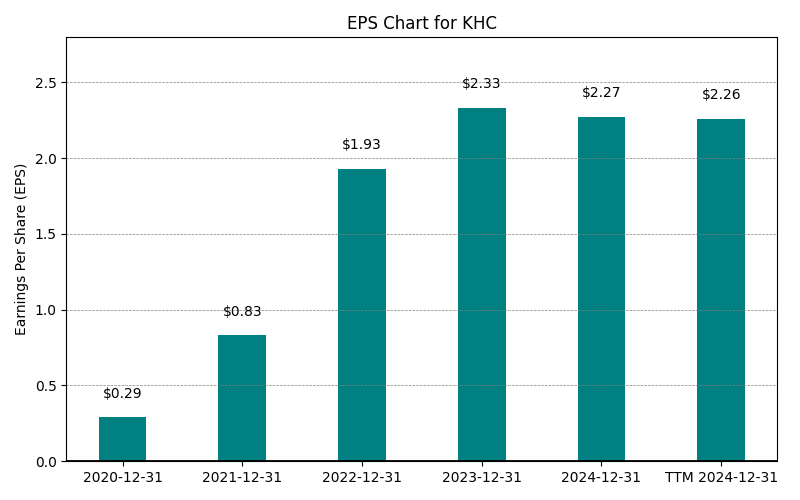
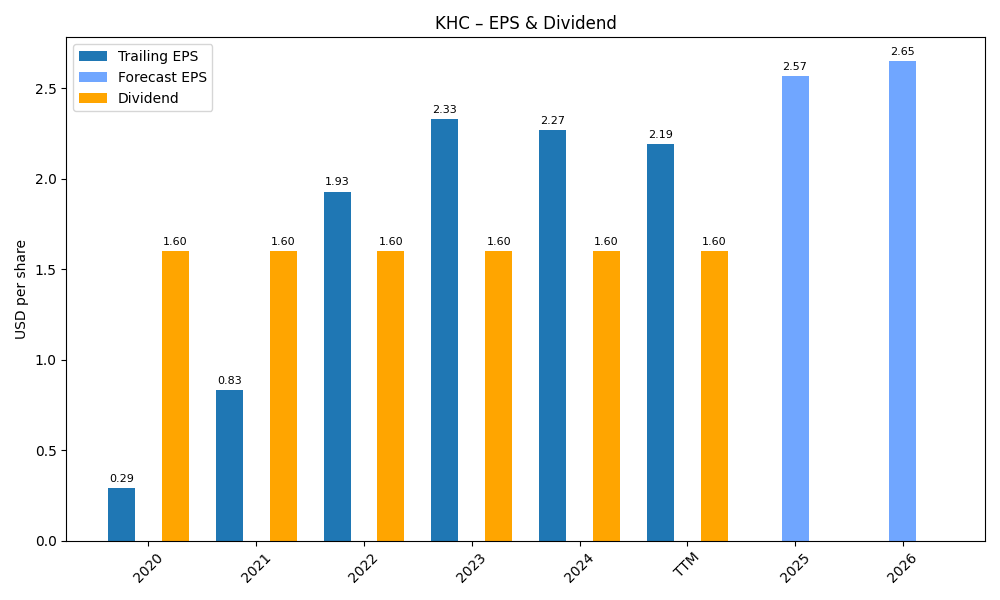
| 0 | 2020-12-31 | $26,185M | $356M | $0.29 | 2024-02-09 04:07:09 | N/A | N/A | N/A |
| 1 | 2021-12-31 | $26,042M | $1,012M | $0.83 | 2026-02-13 08:39:47 | -0.5% | 184.3% | 186.2% |
| 2 | 2022-12-31 | $26,485M | $2,363M | $1.93 | 2026-05-29 09:10:12 | 1.7% | 133.5% | 132.5% |
| 3 | 2023-12-31 | $26,640M | $2,855M | $2.33 | 2026-05-29 09:10:12 | 0.6% | 20.8% | 20.7% |
| 4 | 2024-12-31 | $25,846M | $2,744M | $2.27 | 2026-05-29 09:10:12 | -3.0% | -3.9% | -2.6% |
| 5 | 2025-12-31 | $24,942M | $-5,846M | $-4.93 | 2026-05-29 09:10:12 | -3.5% | -313.0% | -317.2% |
| 6 | TTM 2026-03-31 | $24,990M | $-5,760M | $-4.86 | 2026-05-11 09:10:26 | 0.2% | -1.5% | -1.4% |
EPS
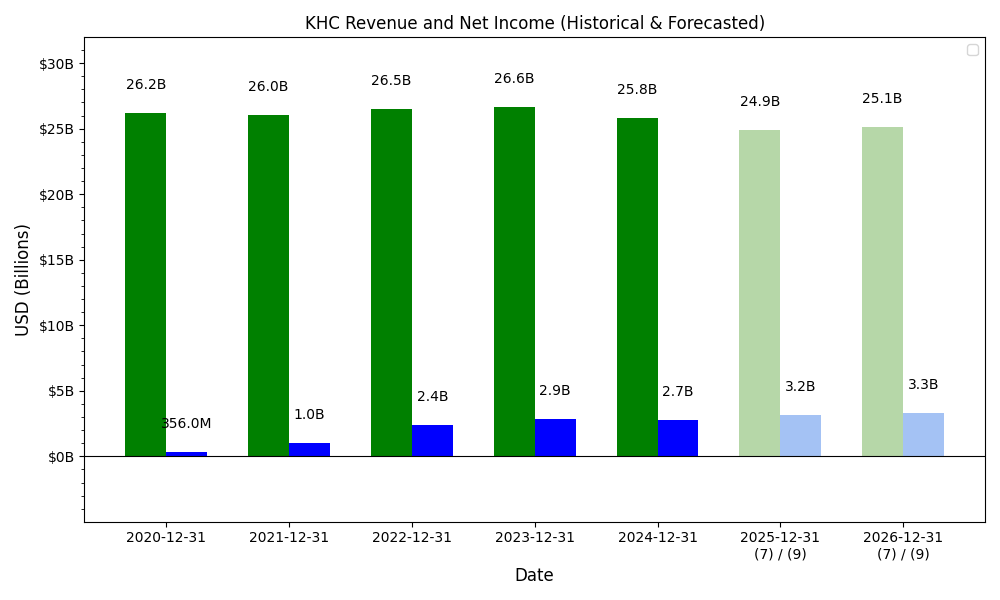
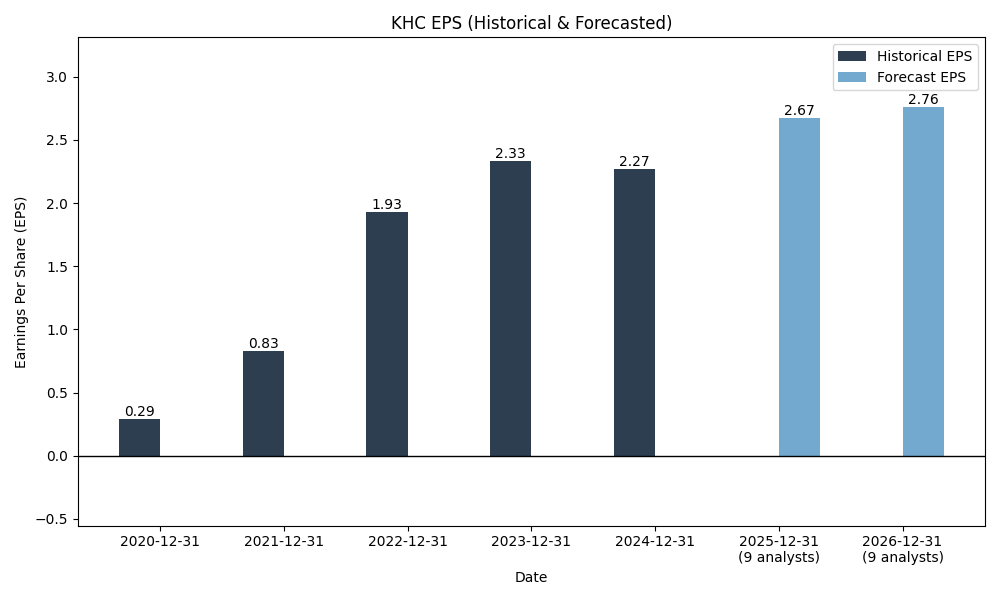
Forecasts
Y/Y % Change
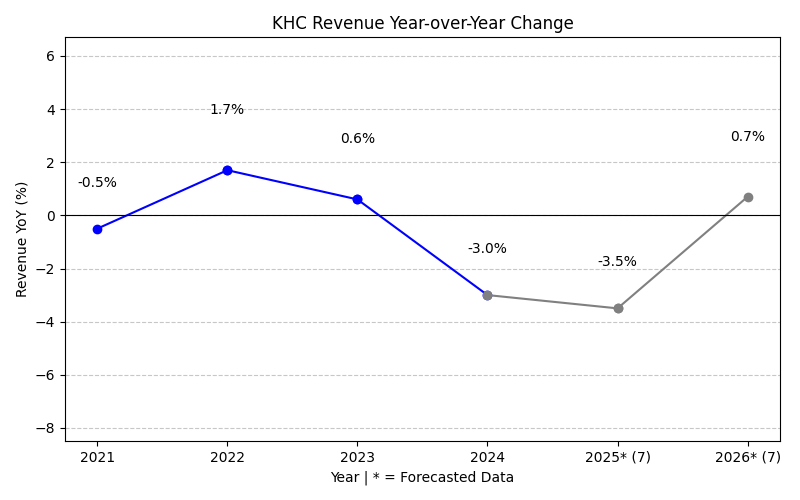
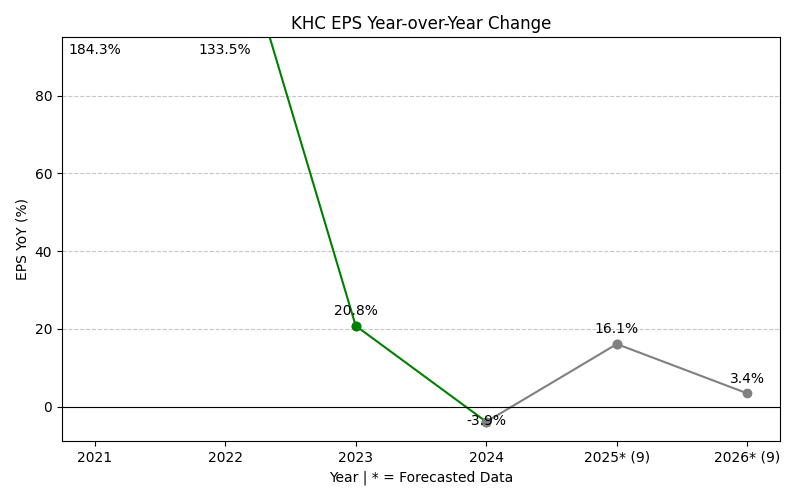
KHC Year-over-Year Growth
| 2020 | 2021 | 2022 | 2023 | 2024 | 2025 | 2026 | 2027 | Average | |
|---|---|---|---|---|---|---|---|---|---|
| Revenue Growth (%) | -0.5% | 1.7% | 0.6% | -3.0% | -3.5% | -2.0% | 0.5% | -0.9% | |
| Revenue Analysts (#) | 0 | 0 | 0 | 0 | 0 | 0 | 18 | 18 | |
| EPS Growth (%) | 184.3% | 133.5% | 20.8% | -3.9% | -313.0% | -141.8% | 2.1% | -16.9% | |
| EPS Analysts (#) | 0 | 0 | 0 | 0 | 0 | 0 | 20 | 20 |
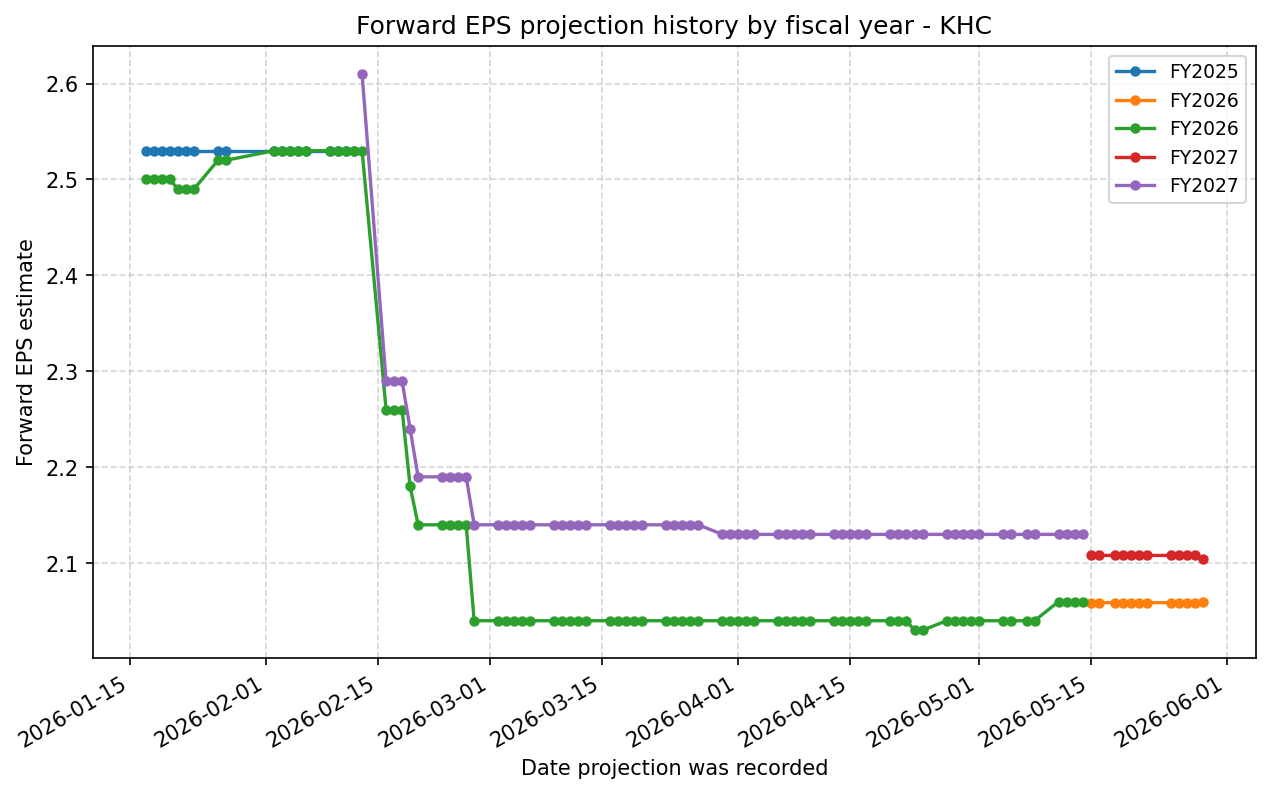
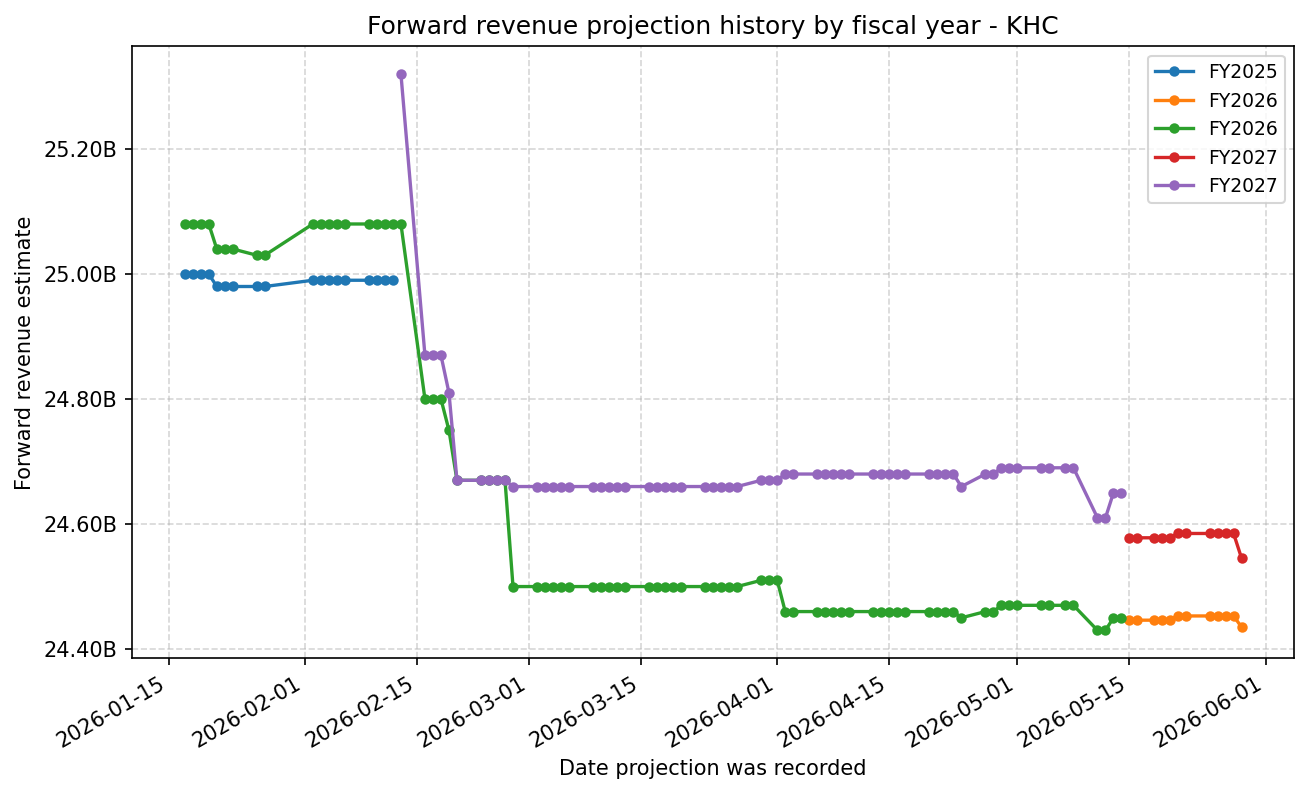
Forward Estimate History
How the next-FY EPS and revenue estimates have drifted over time. One line per fiscal year – past lines end when that FY became current.
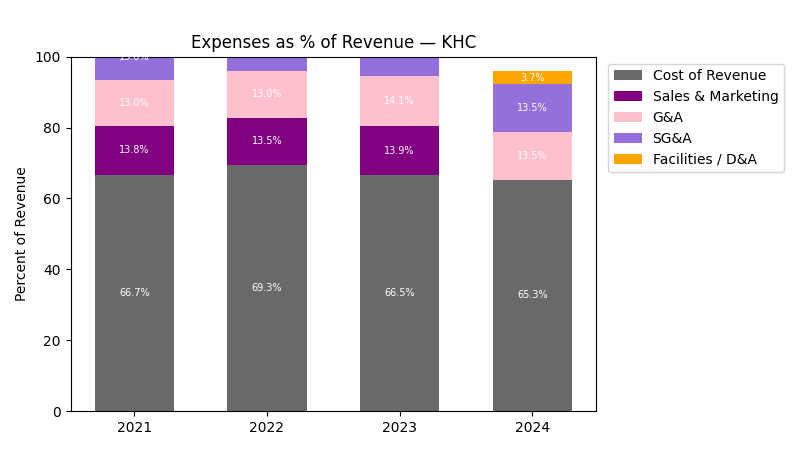
Expenses
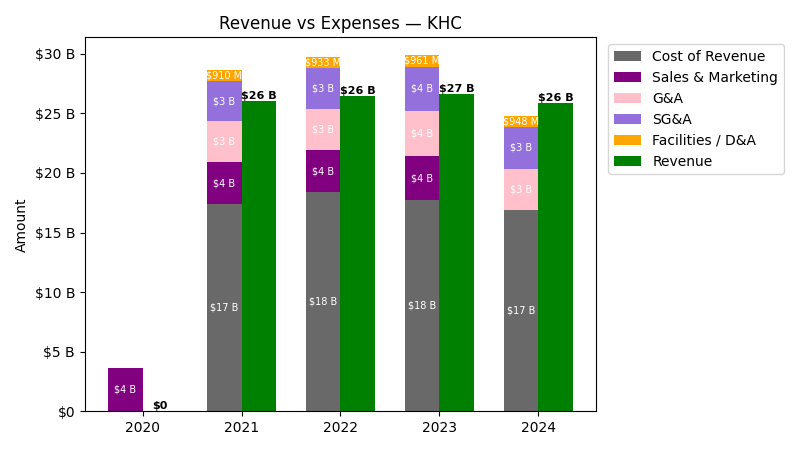
| Year | Revenue ($) | Cost of Revenue ($) | Sales & Marketing ($) | G&A ($) | SG&A ($) | Facilities / D&A ($) | Personnel ($) |
|---|---|---|---|---|---|---|---|
| 2022 | $26.5B | $17.4B | $3.6B | $3.4B | $3.6B | $933.0M | $-135.0M |
| 2023 | $26.6B | $16.8B | $3.7B | $3.8B | $3.7B | $961.0M | $67.0M |
| 2024 | $25.8B | $15.9B | $0.0 | $3.5B | $3.6B | $948.0M | $-130.0M |
| 2025 | $24.9B | $15.7B | $0.0 | $0.0 | $3.7B | $968.0M | $0.0 |
| TTM | $25.0B | $15.5B | $0.0 | $0.0 | $3.9B | $982.0M | $0.0 |
| Year | Revenue Change (%) | Cost of Revenue Change (%) | Sales & Marketing Change (%) | G&A Change (%) | SG&A Change (%) | Facilities / D&A Change (%) | Personnel Change (%) |
|---|---|---|---|---|---|---|---|
| 2023 | 0.59 | -3.88 | 3.27 | 9.27 | 3.27 | 3.00 | -149.63 |
| 2024 | -2.98 | -4.91 | -100.00 | -7.26 | -2.06 | -1.35 | -294.03 |
| 2025 | -3.50 | -1.66 | NaN | -100.00 | 1.55 | 2.11 | -100.00 |
| TTM | 0.19 | -0.77 | NaN | NaN | 5.26 | 1.45 | NaN |
No unmapped expenses.
Balance Sheet
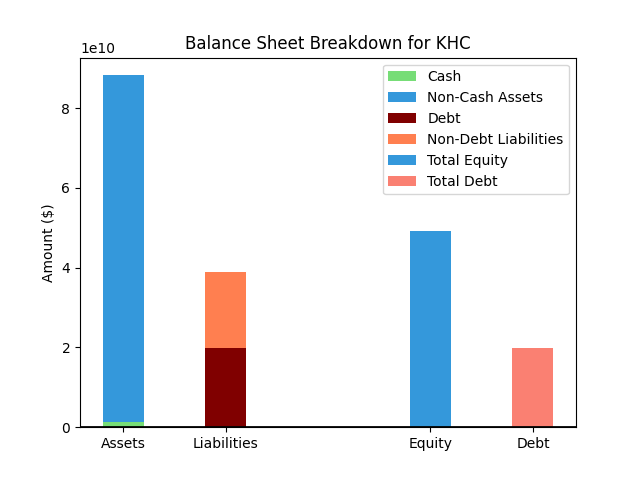
| Metric | Value | |
|---|---|---|
| 0 | Total Assets | $82,046M |
| 1 | Cash | $3,308M |
| 2 | Total Liabilities | $39,997M |
| 3 | Total Debt | $21,133M |
| 4 | Total Equity | $41,923M |
| 5 | Debt to Equity Ratio | 0.50 |
EPS & Dividend
Valuation
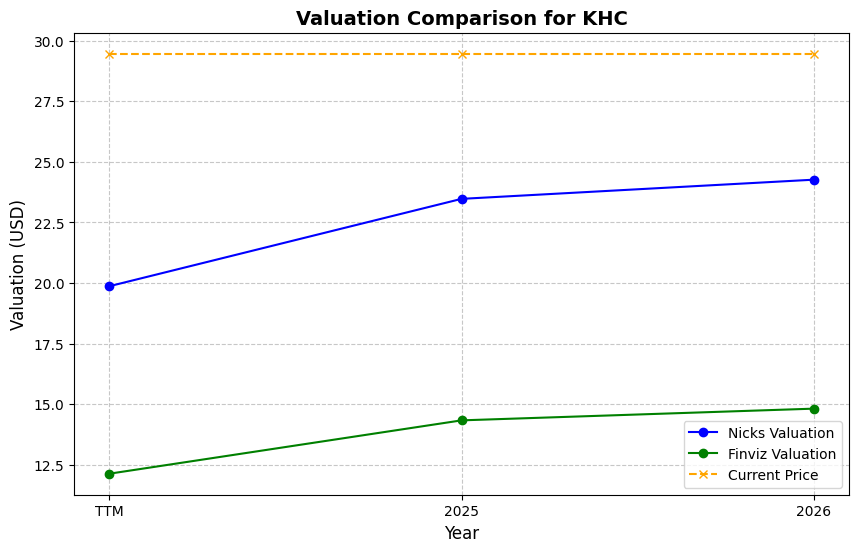
| Share Price | Treasury Yield | Estimates | Fair Value (P/E) | Fair Value (P/S) | Current P/S | Current P/E |
|---|---|---|---|---|---|---|
| $24.01 | 4.5% | Nicks Growth: 3% Nick's Expected Margin: 10% FINVIZ Growth: -6% |
Nicks: 9 Finviz: 3 |
Nick's: 0.864 | 1.1 | - |
| Basis | Year | Nicks Valuation | Nicks vs Share Price | Finviz Valuation | Finviz vs Share Price |
|---|---|---|---|---|---|
| $21.07 Revenue | TTM | $18.21 | -24.2% | $7.25 | -69.8% |
| $2.06 EPS | 2026 | $17.79 | -25.9% | $7.08 | -70.5% |
| $2.10 EPS | 2027 | $18.17 | -24.3% | $7.24 | -69.9% |
Implied Growth
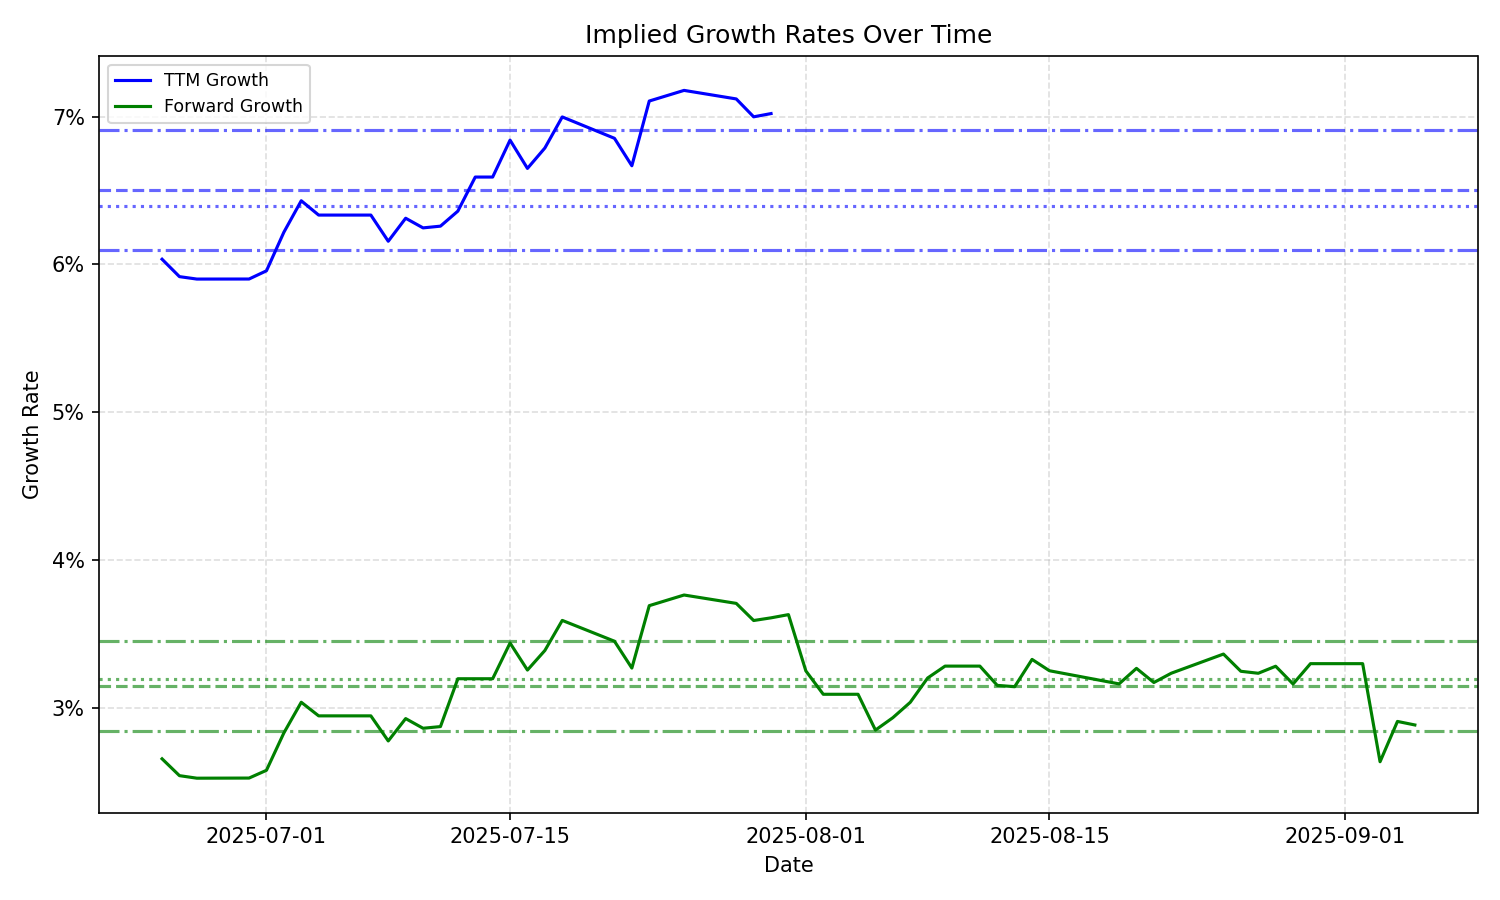
| Average | Median | Std Dev | Current | Percentile | ||||||
|---|---|---|---|---|---|---|---|---|---|---|
| TTM | Forward | TTM | Forward | TTM | Forward | TTM | Forward | TTM | Forward | |
| Timeframe | ||||||||||
| 1 Year | 6.50% | 3.57% | 6.40% | 3.32% | 0.40% | 1.20% | 7.02% | 5.98% | 89.3% | 100.0% |
| 3 Years | 6.50% | 3.57% | 6.40% | 3.32% | 0.40% | 1.20% | 7.02% | 5.98% | 89.3% | 100.0% |
| 5 Years | 6.50% | 3.57% | 6.40% | 3.32% | 0.40% | 1.20% | 7.02% | 5.98% | 89.3% | 100.0% |
| 10 Years | 6.50% | 3.57% | 6.40% | 3.32% | 0.40% | 1.20% | 7.02% | 5.98% | 89.3% | 100.0% |