JP Morgan Chase & Co. — JPM
| Close Price | Market Cap | P/E Ratio | Forward P/E Ratio | Implied Growth* | Implied Forward Growth* | Dividend | P/B Ratio |
|---|---|---|---|---|---|---|---|
| $299.31 | $802.00B | 14.3 | 12.7 | 8.1% | 6.9% | $6.00 2.0% | 2.3 |
Latest Headlines
- · Top Stock Reports for JPMorgan, GE Aerospace & Western Digital
- · Weekly Wrap: Crypto Prices Breakdown As Bitcoin Falls In May
- · Jamie Dimon Vows Banks Will Fight the Clarity Act
- · Aluminum Jumps 15% As Supply Crunch Drives Biggest Squeeze Since 2007
- · Dimon Slams Coinbase’s Armstrong in Tense Crypto Bill Fight
- · Week’s Best: Super Bowl Party May Cost J.P. Morgan Millions
Revenue & Net Income
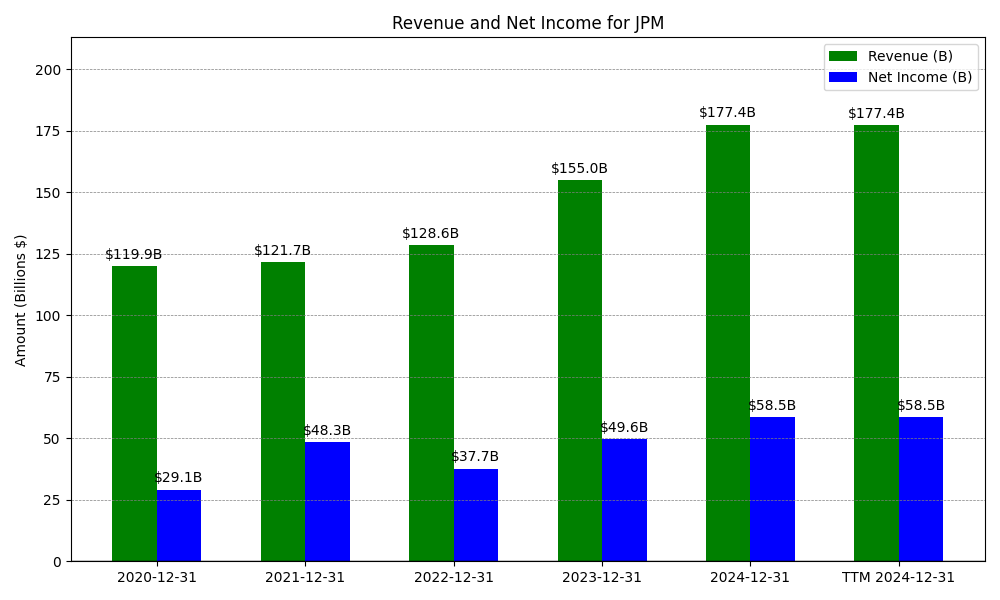
| Date | Revenue | Net_Income | EPS | Last_Updated | Revenue_Change | Net_Income_Change | EPS_Change | |
|---|---|---|---|---|---|---|---|---|
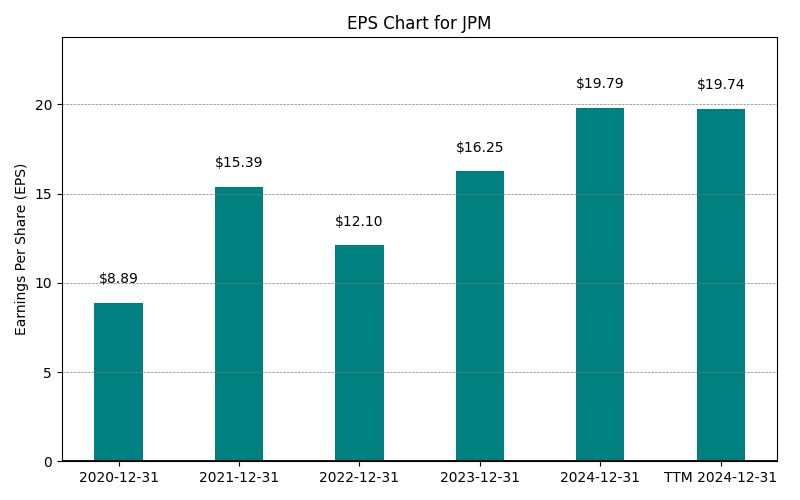
| 0 | 2020-12-31 | $119,883M | $29,131M | $8.89 | 2024-02-03 03:17:10 | N/A | N/A | N/A |
| 1 | 2021-12-31 | $121,685M | $48,334M | $12.10 | 2026-02-16 08:42:46 | 1.5% | 65.9% | 36.1% |
| 2 | 2022-12-31 | $127,727M | $37,676M | $12.10 | 2026-05-29 09:09:53 | 5.0% | -22.1% | 0.0% |
| 3 | 2023-12-31 | $154,952M | $49,552M | $16.25 | 2026-05-29 09:09:53 | 21.3% | 31.5% | 34.3% |
| 4 | 2024-12-31 | $169,439M | $58,471M | $19.79 | 2026-05-29 09:09:53 | 9.3% | 18.0% | 21.8% |
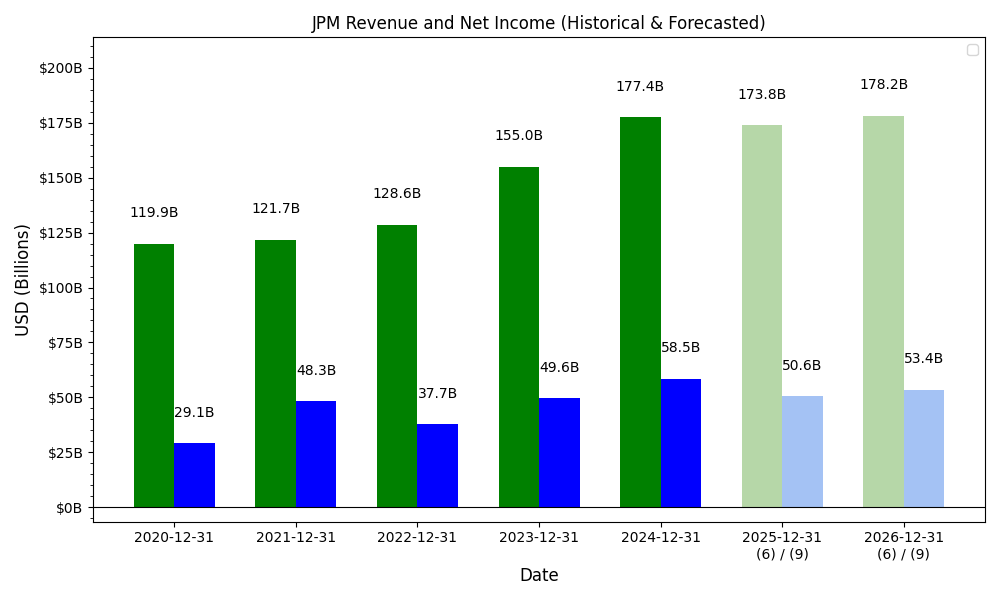
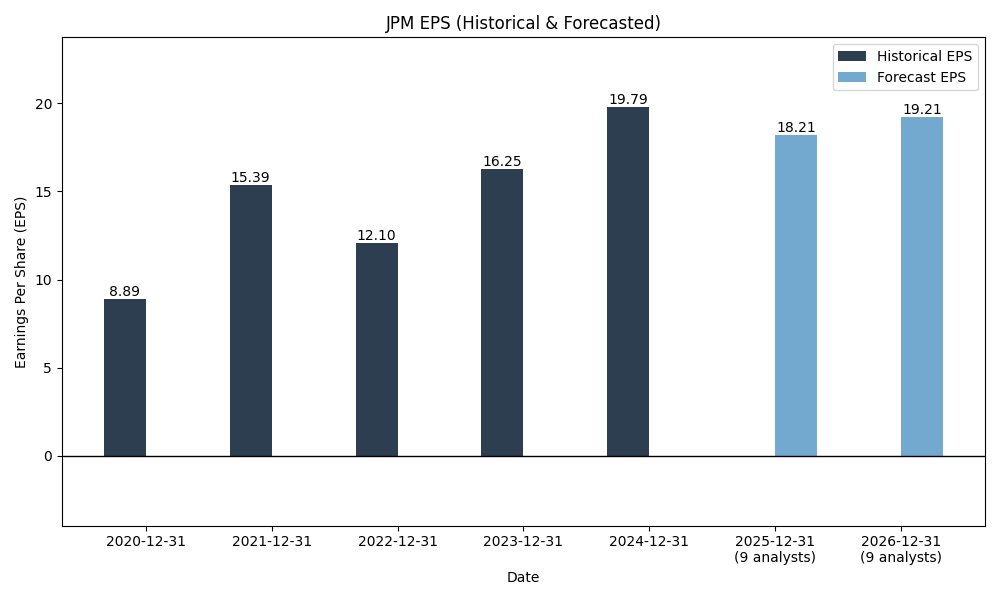
| 5 | 2025-12-31 | $181,847M | $57,048M | $20.05 | 2026-05-29 09:09:53 | 7.3% | -2.4% | 1.3% |
| 6 | TTM 2026-03-31 | $186,941M | $58,899M | $20.89 | 2026-04-16 08:37:53 | 2.8% | 3.2% | 4.2% |
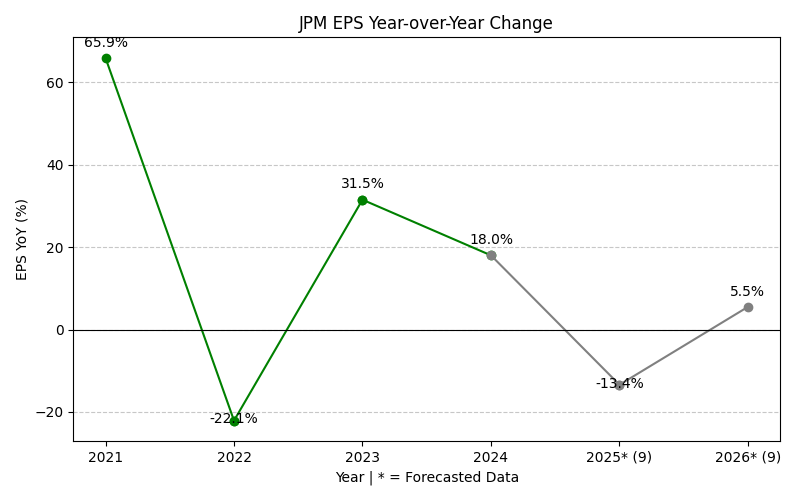
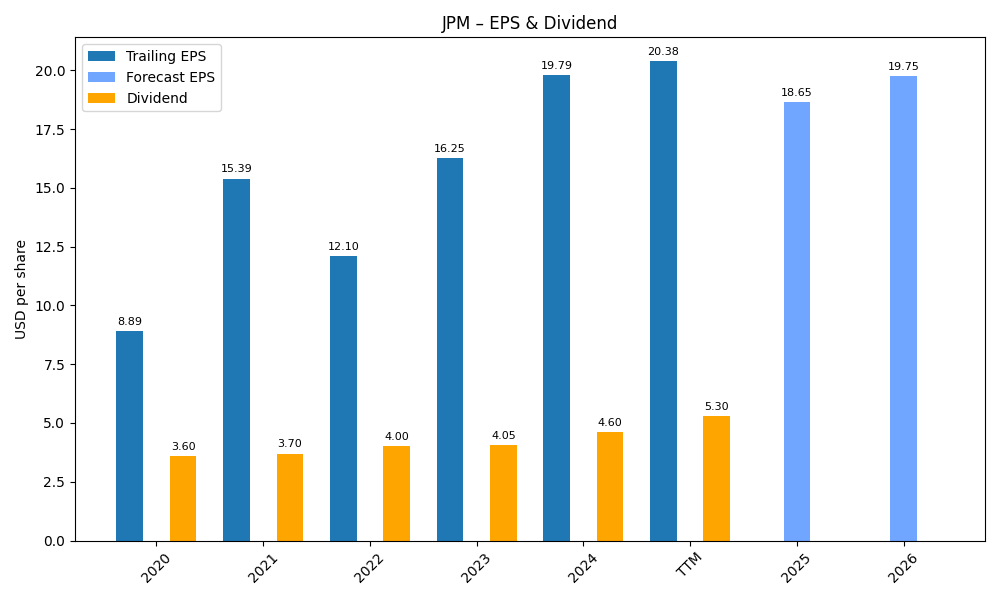
EPS
Forecasts
Y/Y % Change
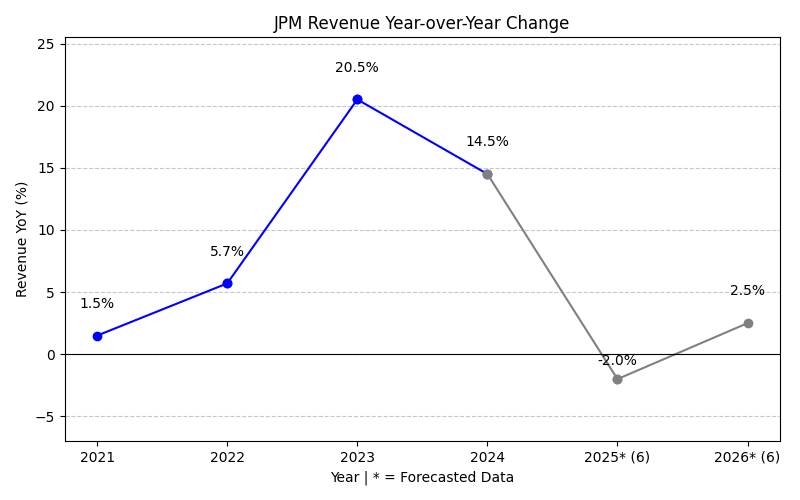
JPM Year-over-Year Growth
| 2020 | 2021 | 2022 | 2023 | 2024 | 2025 | 2026 | 2027 | Average | |
|---|---|---|---|---|---|---|---|---|---|
| Revenue Growth (%) | 1.5% | 5.0% | 21.3% | 9.3% | 7.3% | 8.2% | 3.9% | 8.1% | |
| Revenue Analysts (#) | 0 | 0 | 0 | 0 | 0 | 0 | 14 | 14 | |
| EPS Growth (%) | 65.9% | -22.1% | 31.5% | 18.0% | -2.4% | 4.8% | 5.6% | 14.5% | |
| EPS Analysts (#) | 0 | 0 | 0 | 0 | 0 | 0 | 15 | 17 |
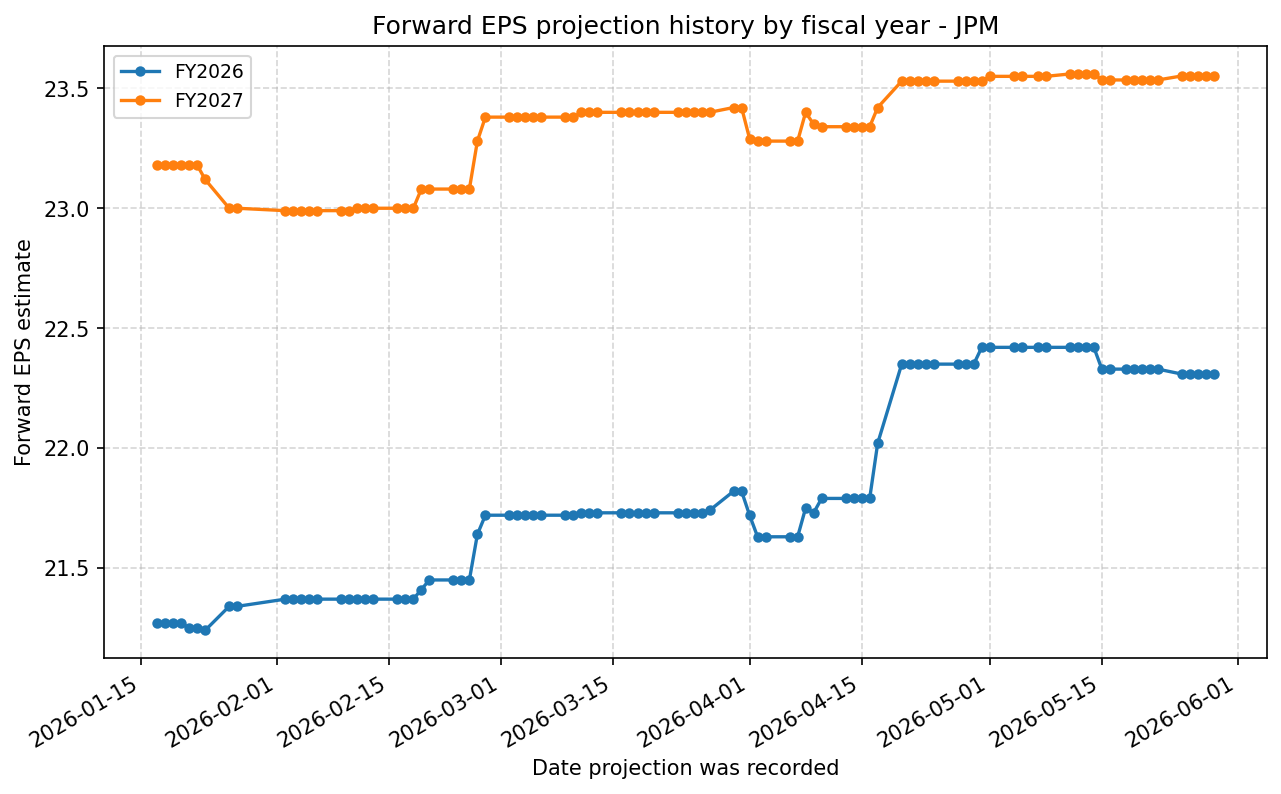
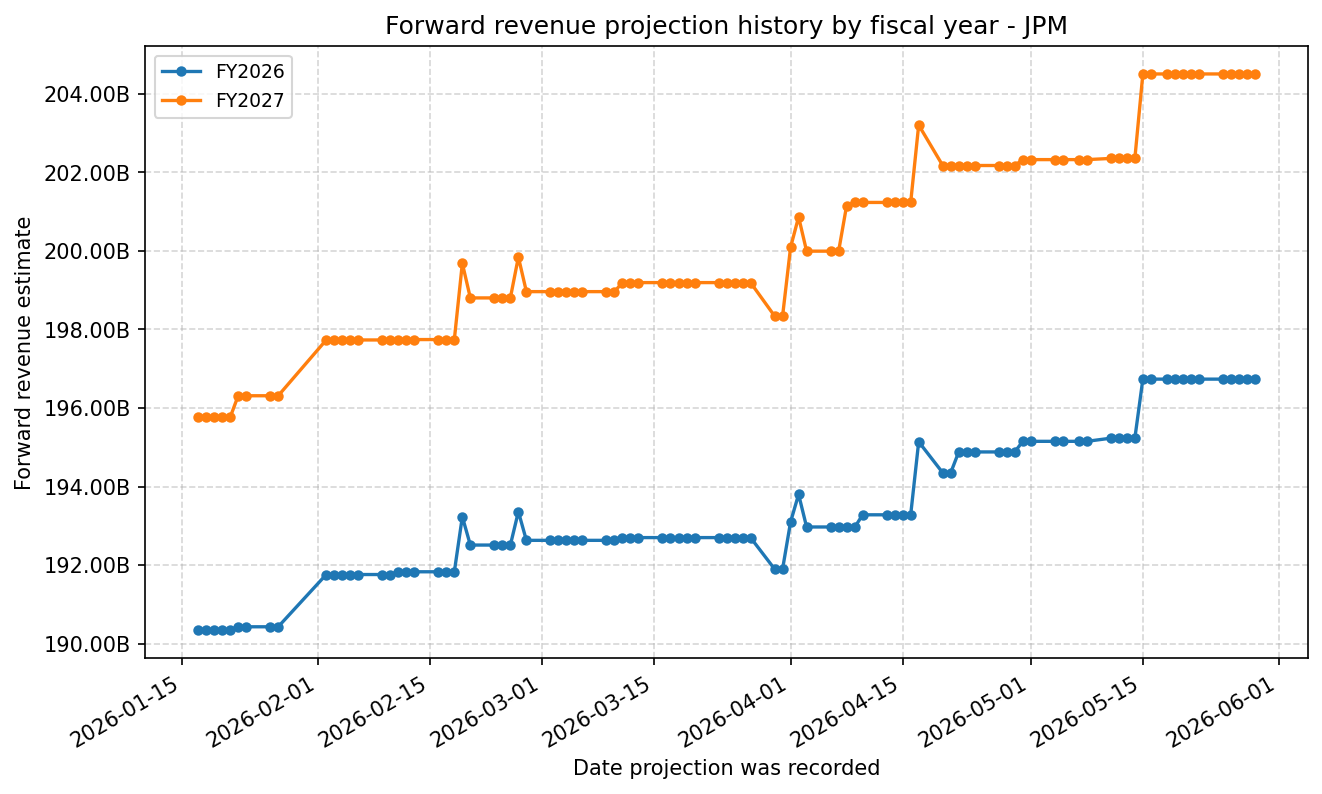
Forward Estimate History
How the next-FY EPS and revenue estimates have drifted over time. One line per fiscal year – past lines end when that FY became current.
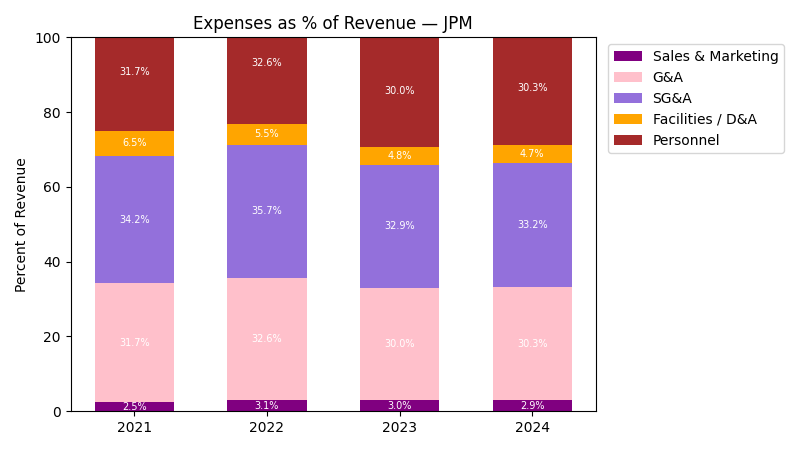
Expenses
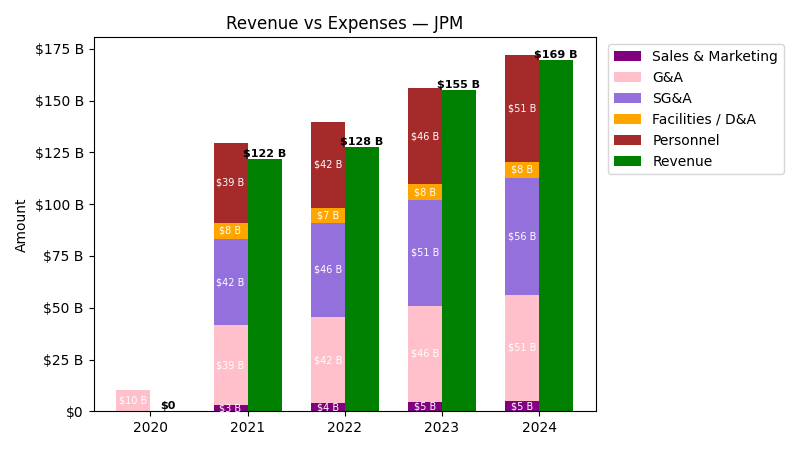
| Year | Revenue ($) | Sales & Marketing ($) | G&A ($) | SG&A ($) | Facilities / D&A ($) | Personnel ($) | Insurance / Claims ($) |
|---|---|---|---|---|---|---|---|
| 2021 | $121.7B | $3.0B | $38.6B | $41.6B | $7.9B | $38.6B | |
| 2022 | $127.7B | $3.9B | $41.6B | $45.5B | $7.1B | $41.6B | |
| 2023 | $155.0B | $4.6B | $46.5B | $51.1B | $7.5B | $46.5B | |
| 2024 | $169.4B | $5.0B | $51.4B | $56.3B | $7.9B | $51.4B | |
| 2025 | $181.8B | $5.5B | $54.5B | $60.0B | $8.8B | $54.5B | |
| TTM | $186.9B | $5.8B | $56.1B | $61.9B | $9.2B | $55.7B | $332.0M |
| Year | Revenue Change (%) | Sales & Marketing Change (%) | G&A Change (%) | SG&A Change (%) | Facilities / D&A Change (%) | Personnel Change (%) |
|---|---|---|---|---|---|---|
| 2022 | 4.97 | 28.82 | 7.96 | 9.48 | -11.11 | 7.96 |
| 2023 | 21.31 | 17.39 | 11.60 | 12.10 | 6.54 | 11.60 |
| 2024 | 9.35 | 8.34 | 10.53 | 10.33 | 5.67 | 10.53 |
| 2025 | 7.32 | 11.20 | 6.09 | 6.55 | 11.12 | 6.09 |
| TTM | 2.80 | 5.42 | 2.90 | 3.13 | 3.79 | 2.29 |
No unmapped expenses.
Balance Sheet
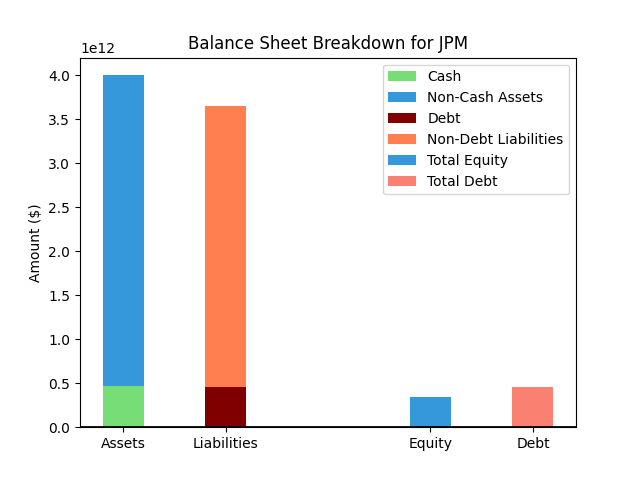
| Metric | Value | |
|---|---|---|
| 0 | Total Assets | $4,900,475M |
| 1 | Cash | $312,142M |
| 2 | Total Liabilities | $4,536,437M |
| 3 | Total Debt | $516,812M |
| 4 | Total Equity | $364,038M |
| 5 | Debt to Equity Ratio | 1.42 |
EPS & Dividend
Valuation
| Share Price | Treasury Yield | Estimates | Fair Value (P/E) | Fair Value (P/S) | Current P/S | Current P/E |
|---|---|---|---|---|---|---|
| $299.31 | 4.5% | Nicks Growth: 10% Nick's Expected Margin: 30% FINVIZ Growth: 9% |
Nicks: 17 Finviz: 15 |
Nick's: 5.147 | 4.3 | 14.3 |
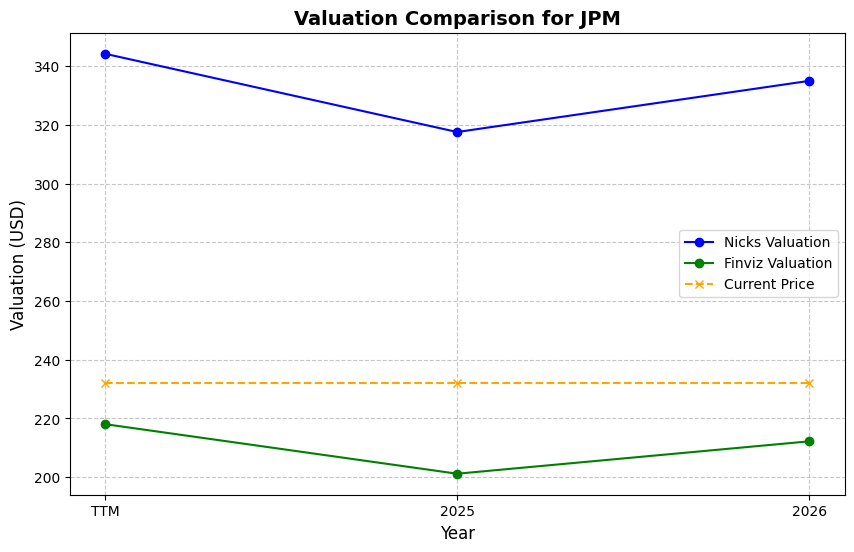
| Basis | Year | Nicks Valuation | Nicks vs Share Price | Finviz Valuation | Finviz vs Share Price |
|---|---|---|---|---|---|
| $20.89 EPS | TTM | $358.42 | 19.8% | $322.77 | 7.8% |
| $22.31 EPS | 2026 | $382.76 | 27.9% | $344.69 | 15.2% |
| $23.55 EPS | 2027 | $404.09 | 35.0% | $363.90 | 21.6% |
Implied Growth
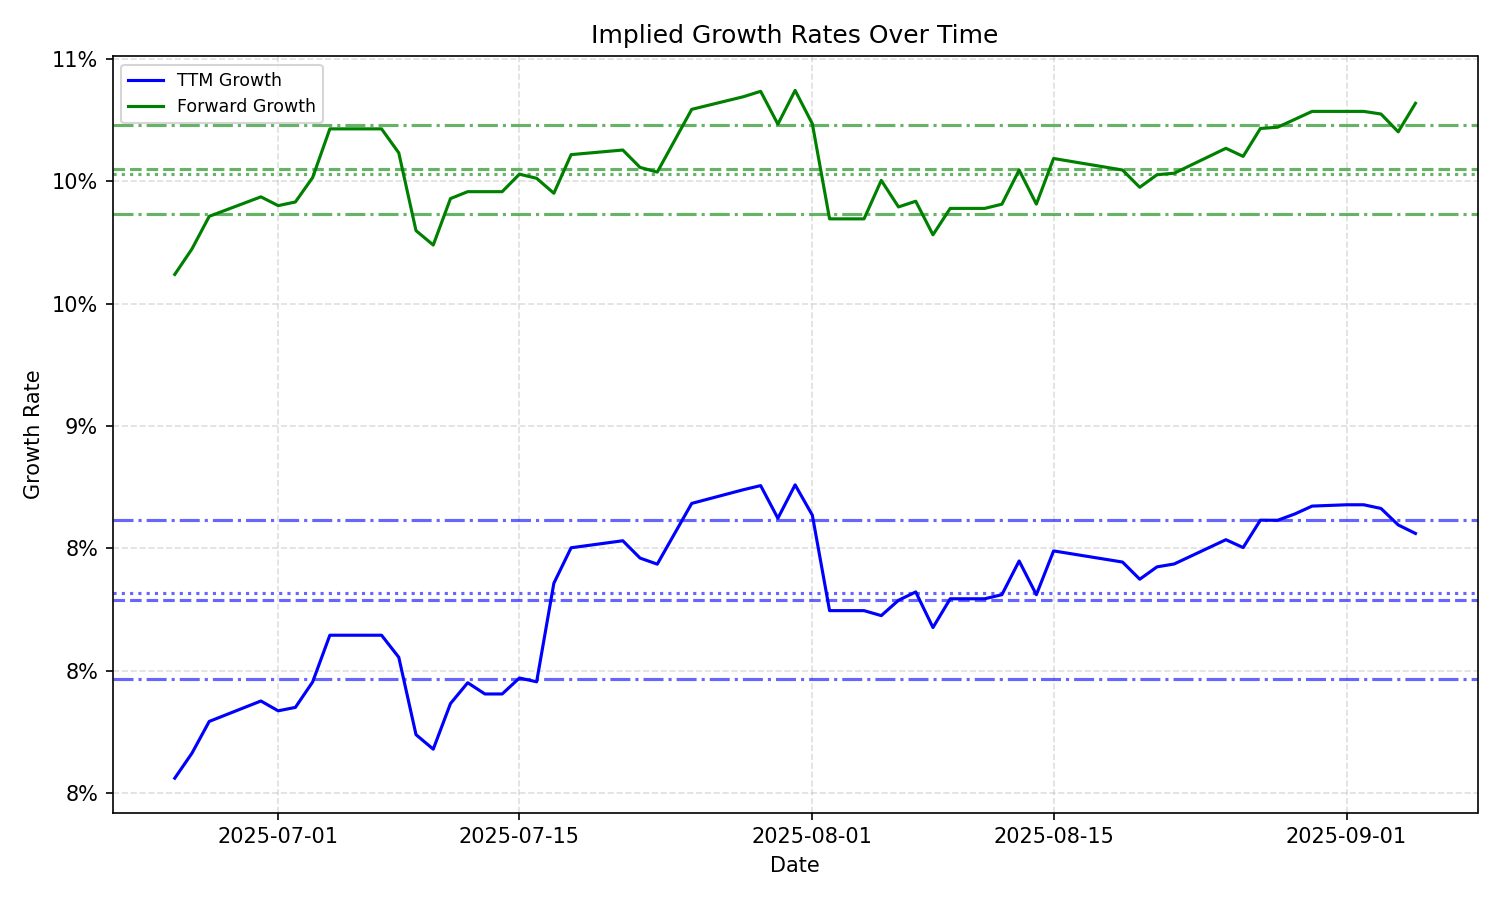
| Average | Median | Std Dev | Current | Percentile | ||||||
|---|---|---|---|---|---|---|---|---|---|---|
| TTM | Forward | TTM | Forward | TTM | Forward | TTM | Forward | TTM | Forward | |
| Timeframe | ||||||||||
| 1 Year | 8.42% | 8.80% | 8.42% | 9.86% | 0.36% | 1.61% | 8.03% | 6.79% | 14.1% | 14.5% |
| 3 Years | 8.42% | 8.80% | 8.42% | 9.86% | 0.36% | 1.61% | 8.03% | 6.79% | 14.1% | 14.5% |
| 5 Years | 8.42% | 8.80% | 8.42% | 9.86% | 0.36% | 1.61% | 8.03% | 6.79% | 14.1% | 14.5% |
| 10 Years | 8.42% | 8.80% | 8.42% | 9.86% | 0.36% | 1.61% | 8.03% | 6.79% | 14.1% | 14.5% |