Johnson & Johnson — JNJ
| Close Price | Market Cap | P/E Ratio | Forward P/E Ratio | Implied Growth* | Implied Forward Growth* | Dividend | P/B Ratio |
|---|---|---|---|---|---|---|---|
| $225.33 | $542.42B | 26.1 | 17.7 | 14.5% | 10.3% | $5.36 2.4% | 6.7 |
Latest Headlines
- · RYBREVANT® (amivantamab-vmjw) plus LAZCLUZE® (lazertinib) demonstrates prolonged clinical benefit as a first-line treatment for atypical EGFR-mutated non-small cell lung cancer
- · VYM Climbs 26% In a Year While Its Core Dividend Payers Extend Their Streaks
- · Want $1,400 in Passive Income? Invest $10,000 Into These 4 Dividend Stocks
- · New TECVAYLI®▼ (teclistamab) data demonstrate superior progression-free and overall survival versus standard of care as early as first relapse in multiple myeloma
- · New TECVAYLI® (teclistamab-cqyv) data demonstrate superior progression-free and overall survival as early as first relapse in multiple myeloma
- · FDA approves label expansion, cementing TREMFYA® as the only IL‑23 inhibitor proven to help stop further joint damage
Revenue & Net Income
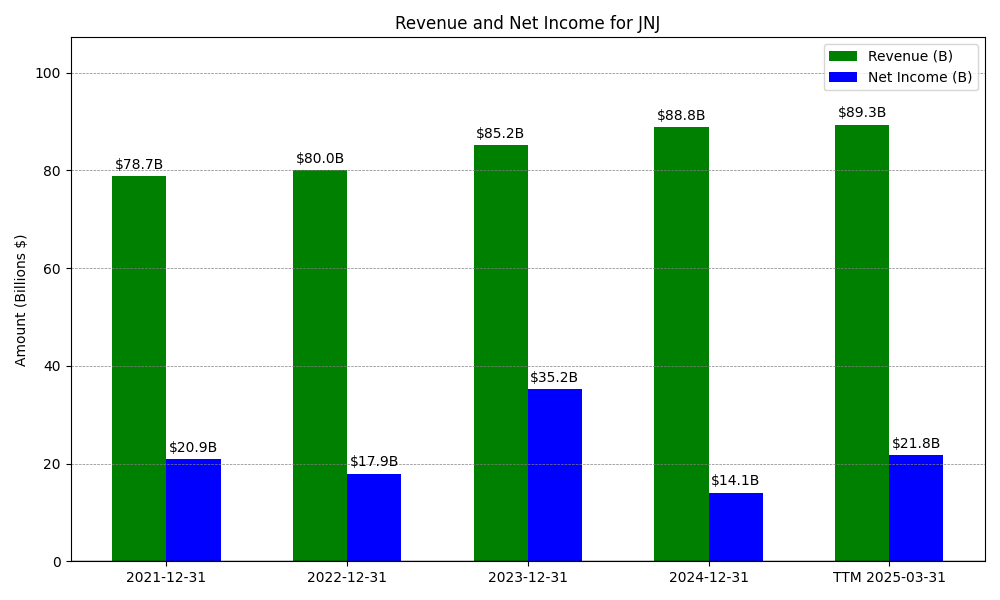
| Date | Revenue | Net_Income | EPS | Last_Updated | Revenue_Change | Net_Income_Change | EPS_Change | |
|---|---|---|---|---|---|---|---|---|
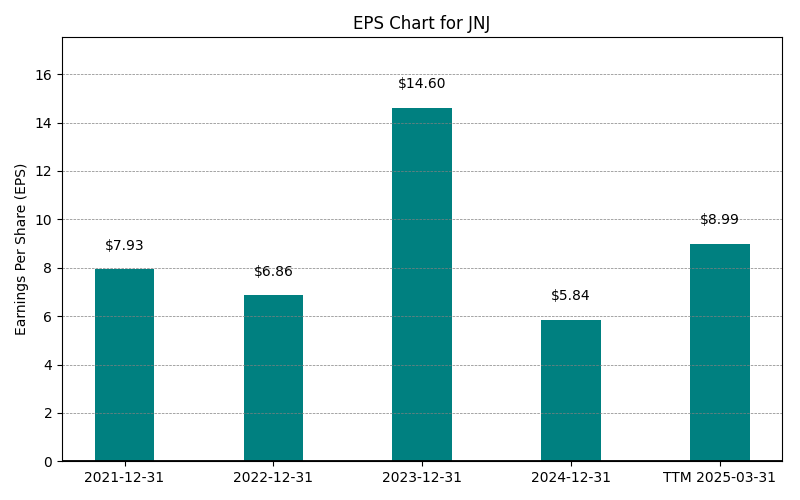
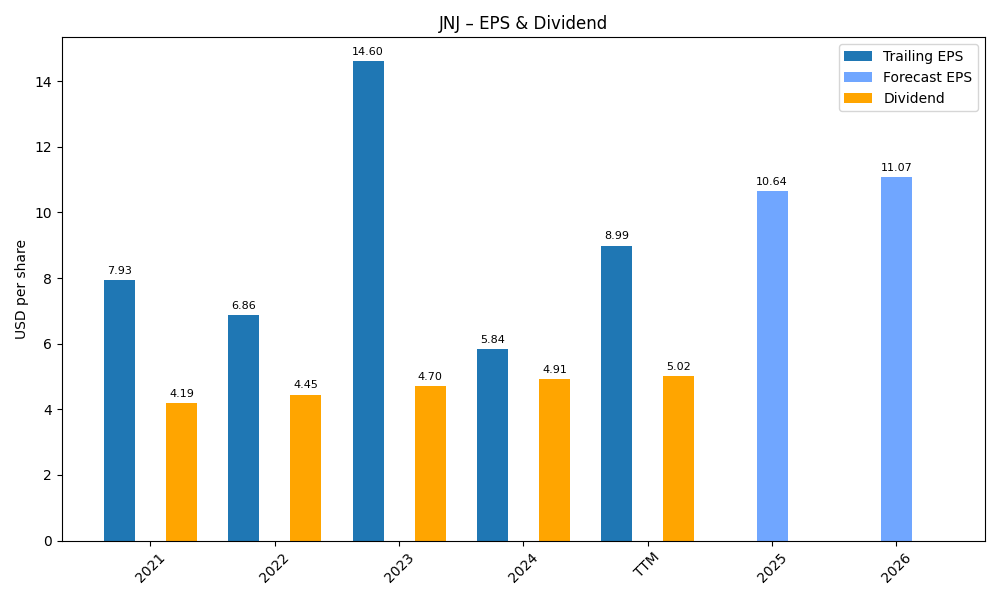
| 0 | 2021-12-31 | $78,740M | $20,878M | $7.93 | 2026-02-13 08:39:13 | N/A | N/A | N/A |
| 1 | 2022-12-31 | $79,990M | $17,941M | $6.86 | 2026-05-29 09:09:42 | 1.6% | -14.1% | -13.5% |
| 2 | 2023-12-31 | $85,159M | $35,153M | $14.60 | 2026-05-29 09:09:42 | 6.5% | 95.9% | 112.8% |
| 3 | 2024-12-31 | $88,821M | $14,066M | $5.84 | 2026-05-29 09:09:42 | 4.3% | -60.0% | -60.0% |
| 4 | 2025-12-31 | $94,193M | $26,804M | $11.13 | 2026-05-29 09:09:42 | 6.0% | 90.6% | 90.5% |
| 5 | TTM 2026-03-31 | $96,362M | $21,040M | $8.63 | 2026-04-24 08:44:54 | 2.3% | -21.5% | -22.5% |
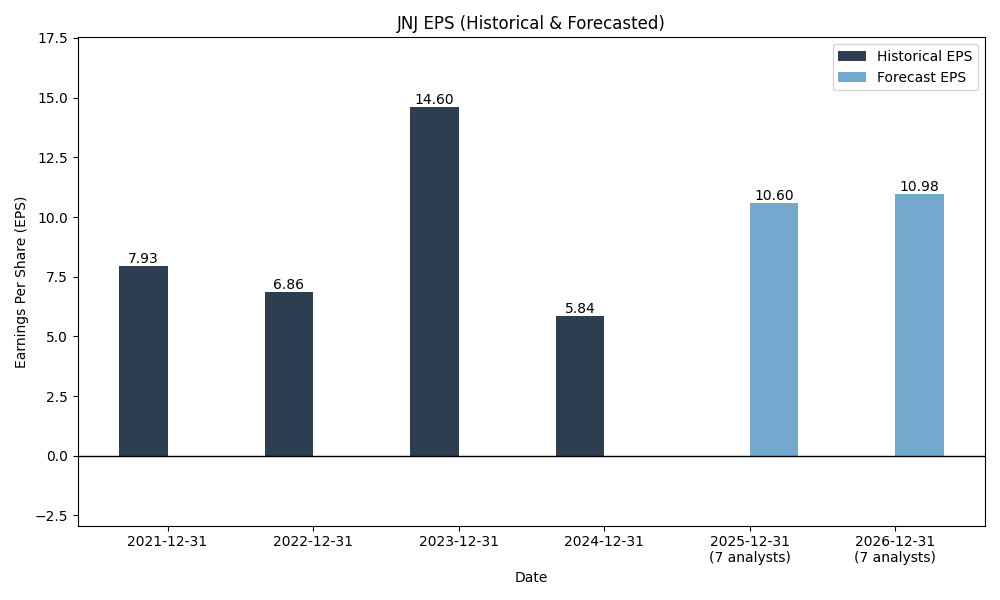
EPS
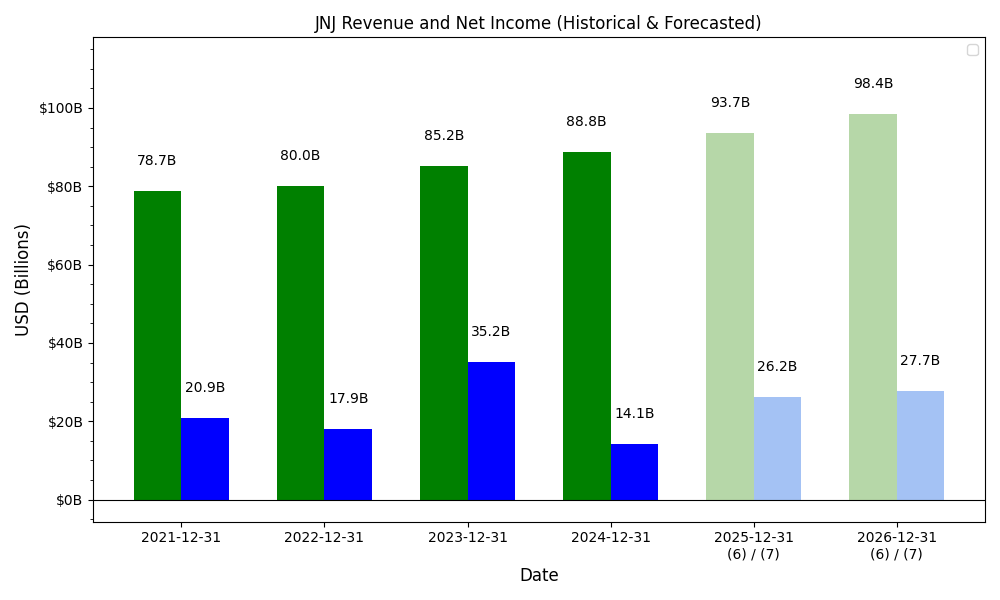
Forecasts
Y/Y % Change
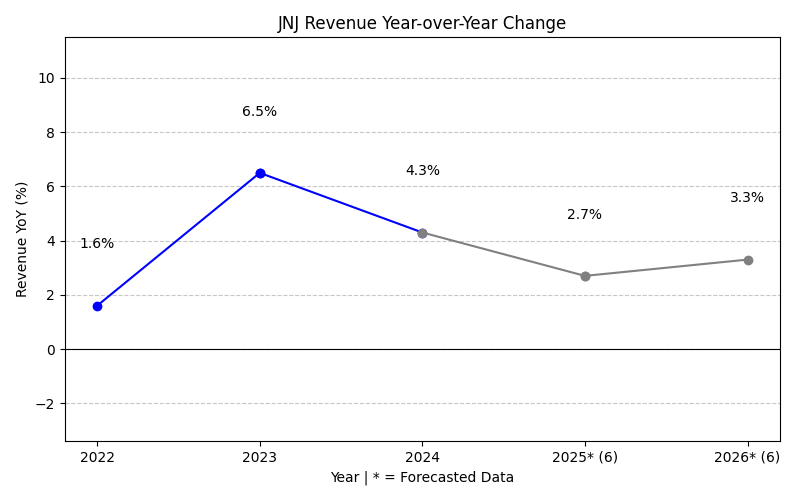
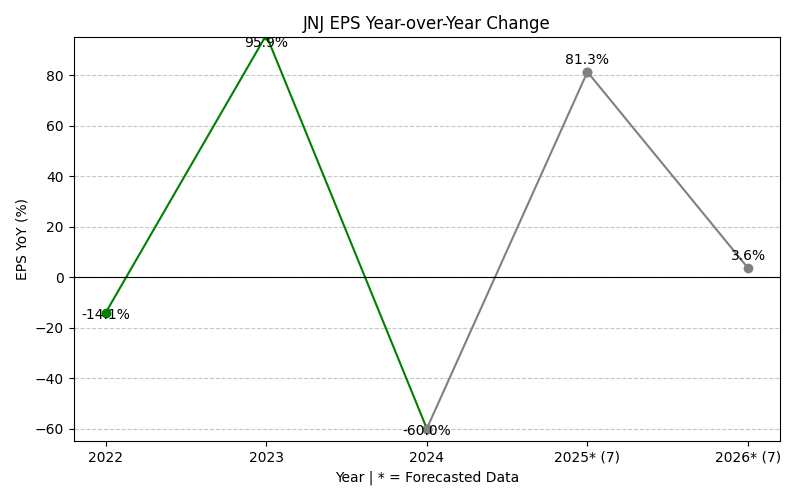
JNJ Year-over-Year Growth
| 2021 | 2022 | 2023 | 2024 | 2025 | 2026 | 2027 | Average | |
|---|---|---|---|---|---|---|---|---|
| Revenue Growth (%) | 1.6% | 6.5% | 4.3% | 6.0% | 7.1% | 6.3% | 5.3% | |
| Revenue Analysts (#) | 0 | 0 | 0 | 0 | 0 | 21 | 23 | |
| EPS Growth (%) | -14.1% | 95.9% | -60.0% | 90.6% | 4.0% | 9.8% | 21.0% | |
| EPS Analysts (#) | 0 | 0 | 0 | 0 | 0 | 25 | 25 |
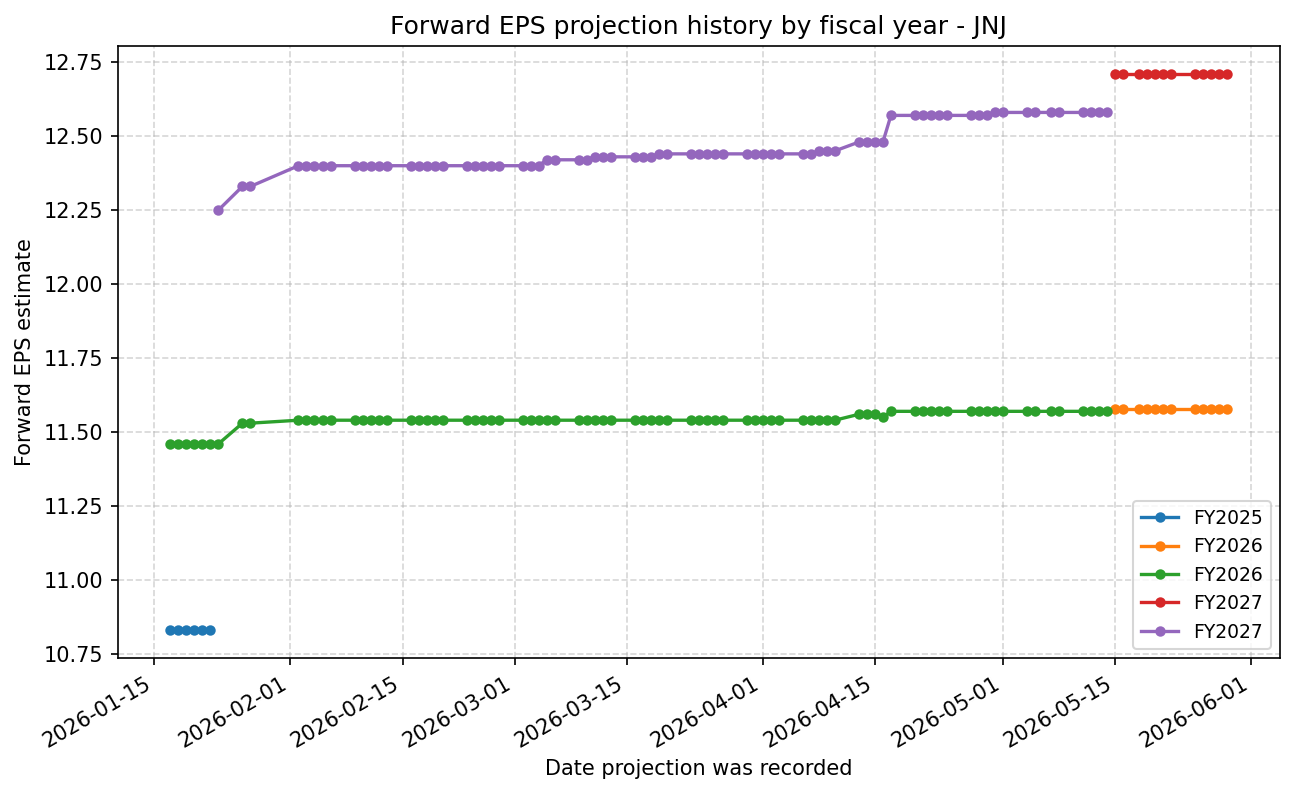
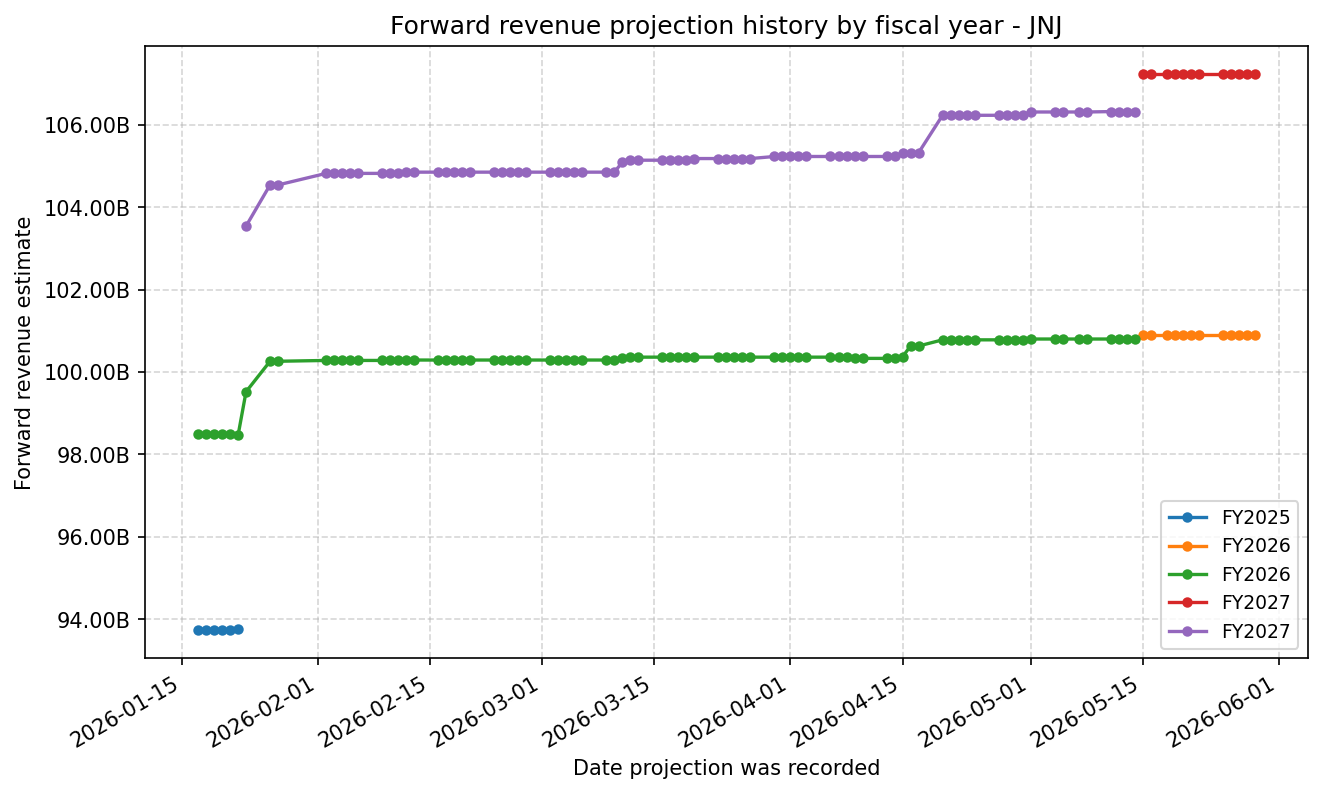
Forward Estimate History
How the next-FY EPS and revenue estimates have drifted over time. One line per fiscal year – past lines end when that FY became current.
Expenses
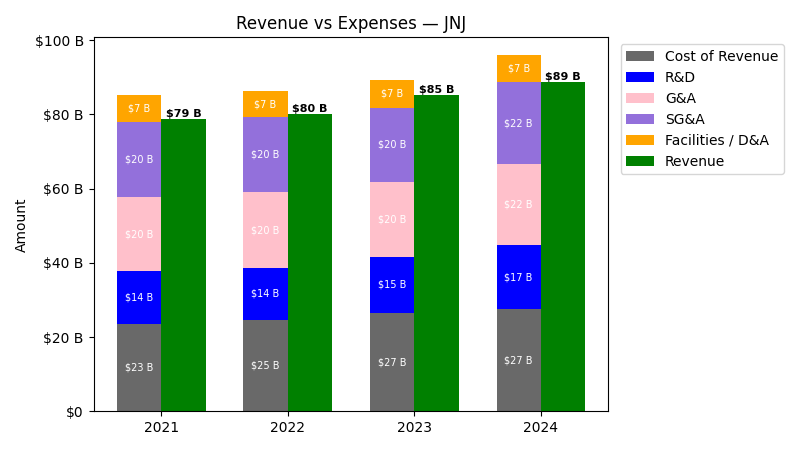
| Year | Revenue ($) | Cost of Revenue ($) | R&D ($) | G&A ($) | SG&A ($) | Facilities / D&A ($) | Personnel ($) |
|---|---|---|---|---|---|---|---|
| 2022 | $80.0B | $17.6B | $14.1B | $20.2B | $20.2B | $7.0B | $-1.2B |
| 2023 | $85.2B | $19.1B | $15.1B | $21.5B | $21.5B | $7.5B | $-1.4B |
| 2024 | $88.8B | $20.1B | $17.2B | $22.9B | $22.9B | $7.3B | $-900.0M |
| 2025 | $94.2B | $22.8B | $14.7B | $0.0 | $23.7B | $7.5B | $0.0 |
| TTM | $96.4B | $23.3B | $15.0B | $11.8B | $24.6B | $7.7B | $-200.0M |
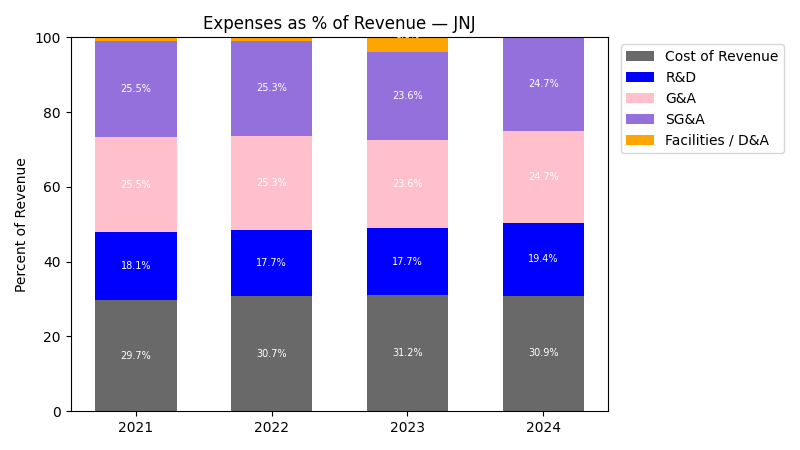
| Year | Revenue Change (%) | Cost of Revenue Change (%) | R&D Change (%) | G&A Change (%) | SG&A Change (%) | Facilities / D&A Change (%) | Personnel Change (%) |
|---|---|---|---|---|---|---|---|
| 2023 | 6.46 | 8.18 | 6.72 | 6.25 | 6.25 | 7.40 | 16.67 |
| 2024 | 4.30 | 5.59 | 14.23 | 6.31 | 6.31 | -1.96 | -35.71 |
| 2025 | 6.05 | 13.02 | -14.90 | -100.00 | 3.53 | 2.23 | -100.00 |
| TTM | 2.30 | 2.27 | 2.06 | inf | 3.89 | 3.09 | -inf |
No unmapped expenses.
Segment Performance
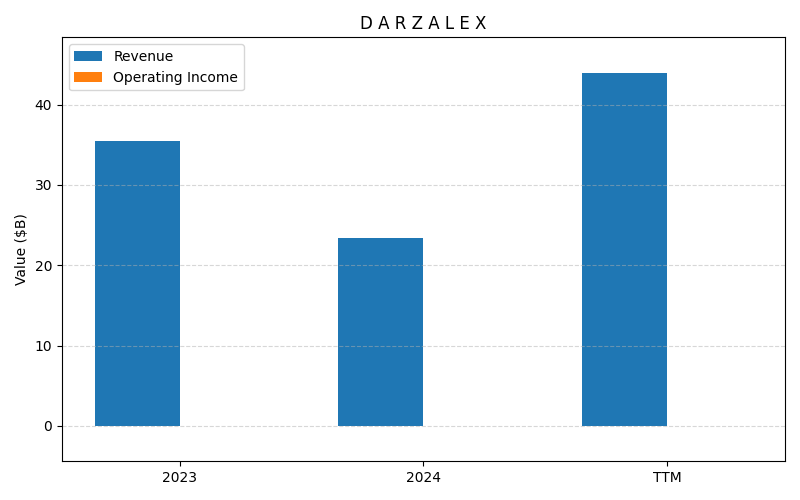
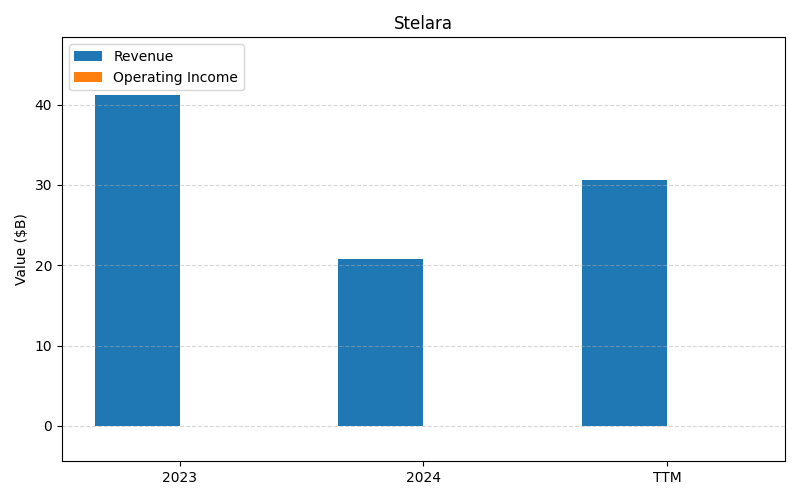
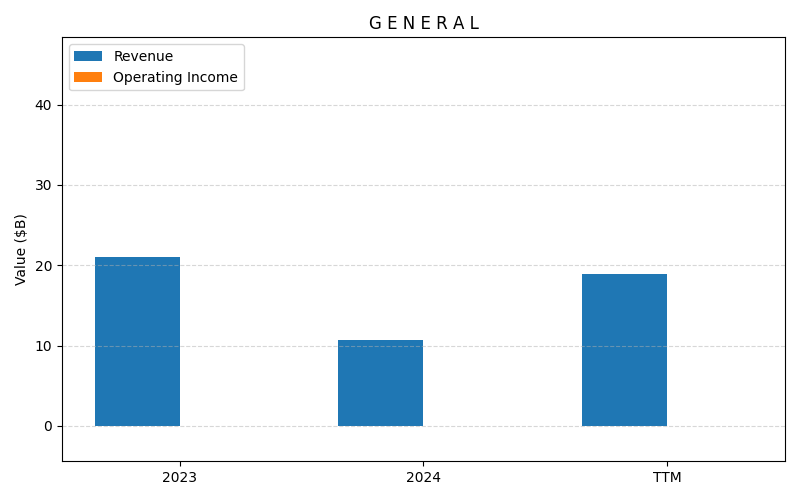
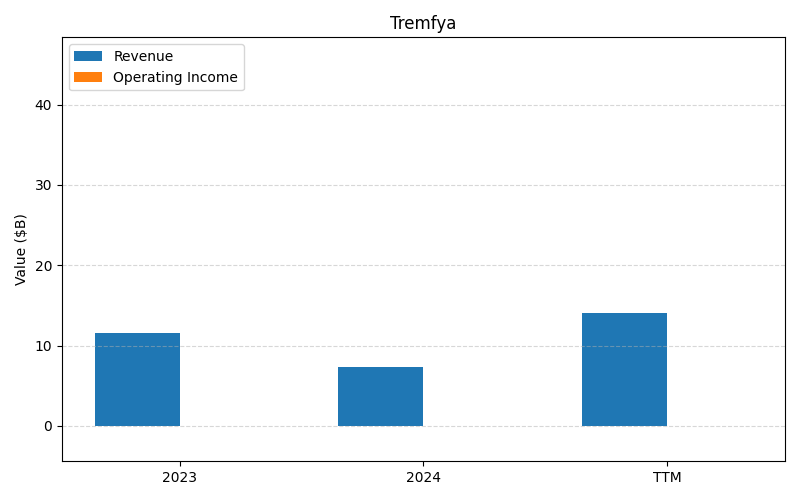
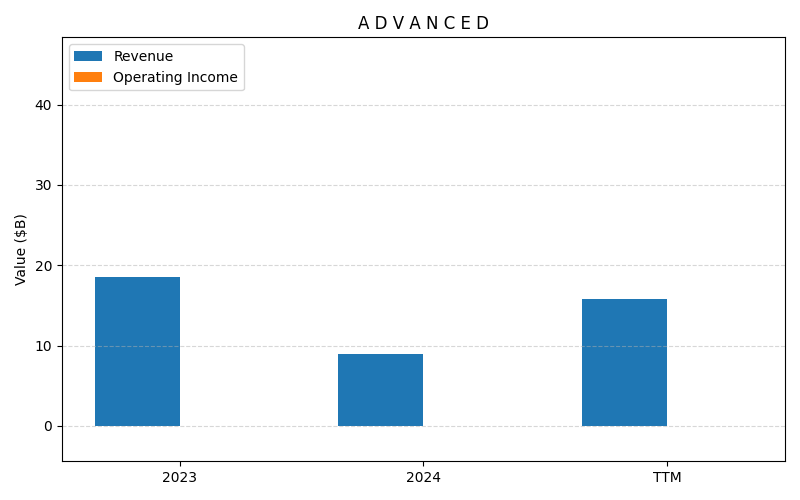
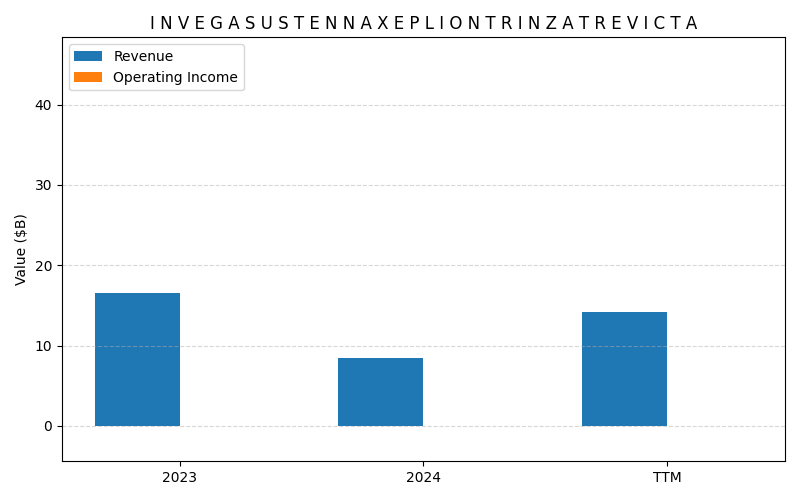
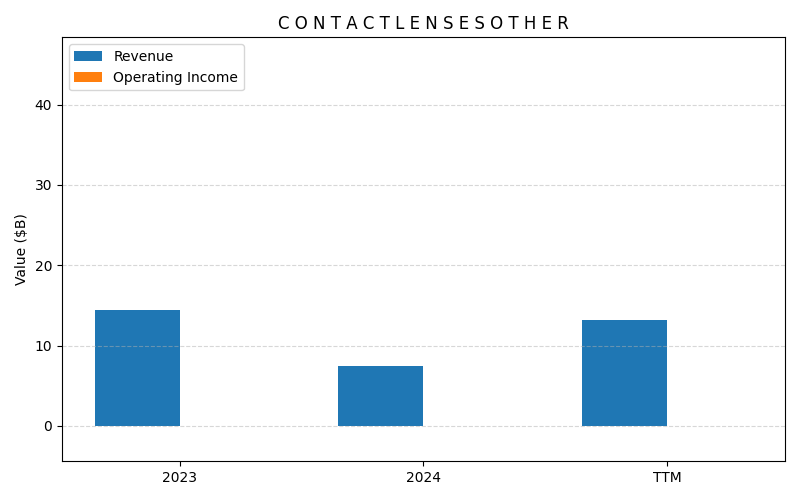
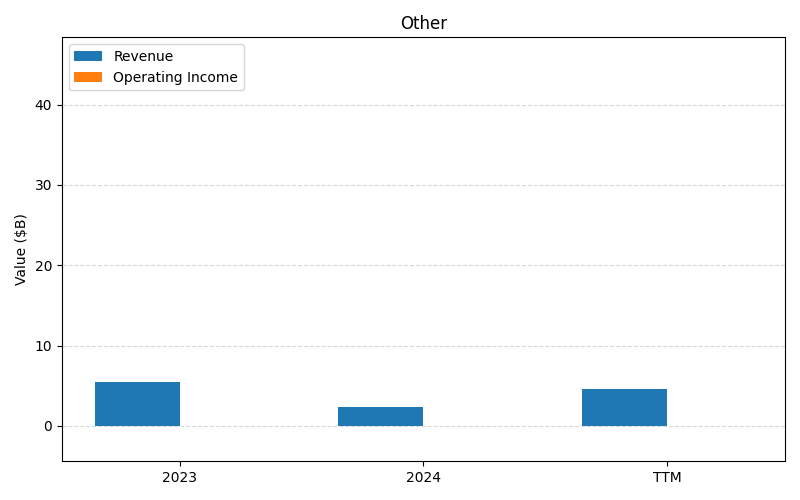
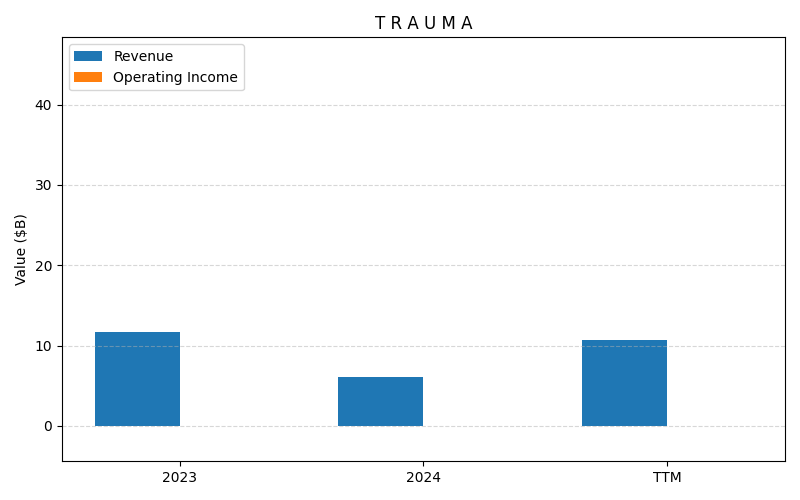
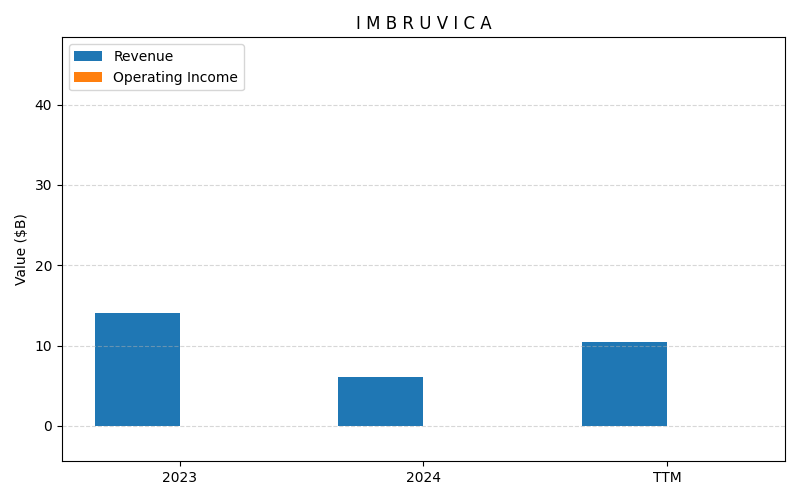
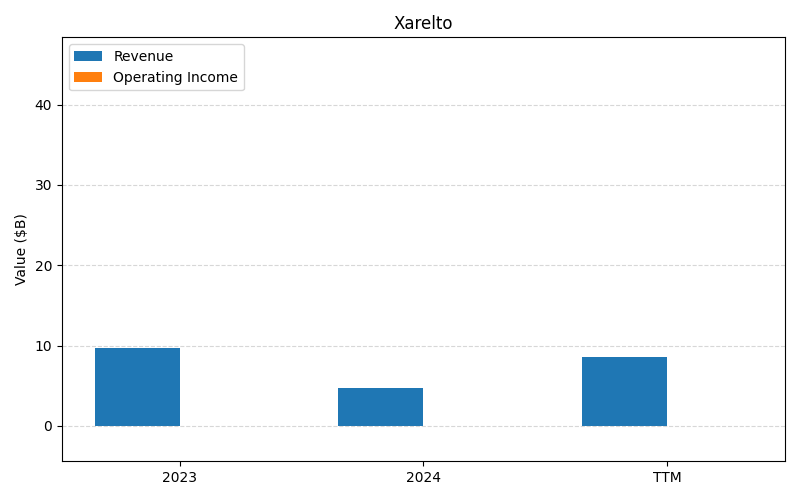
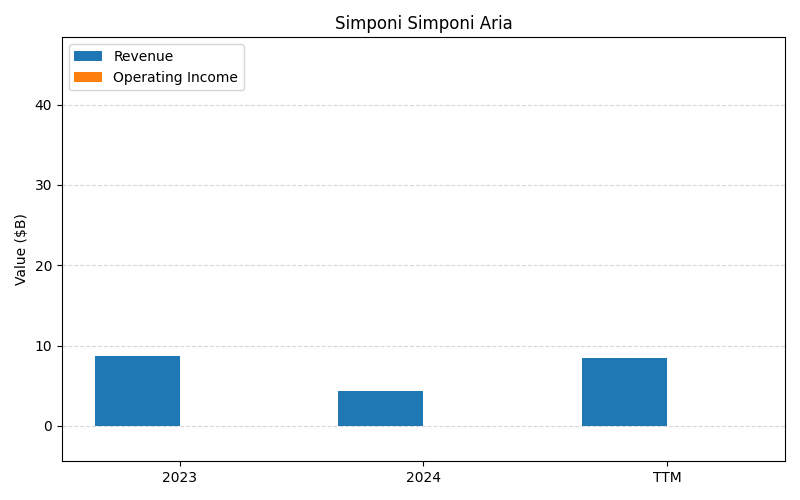
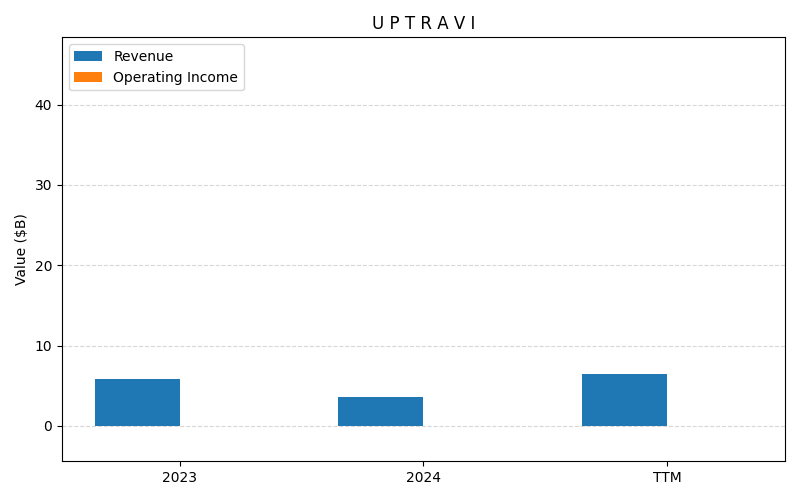
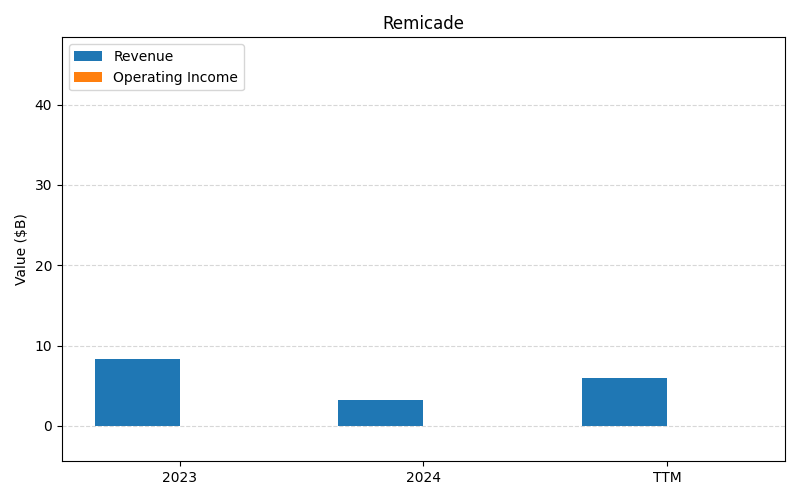
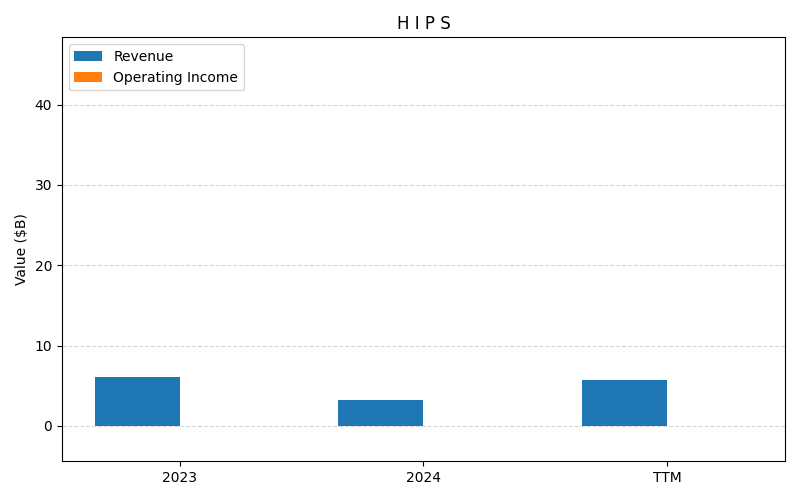
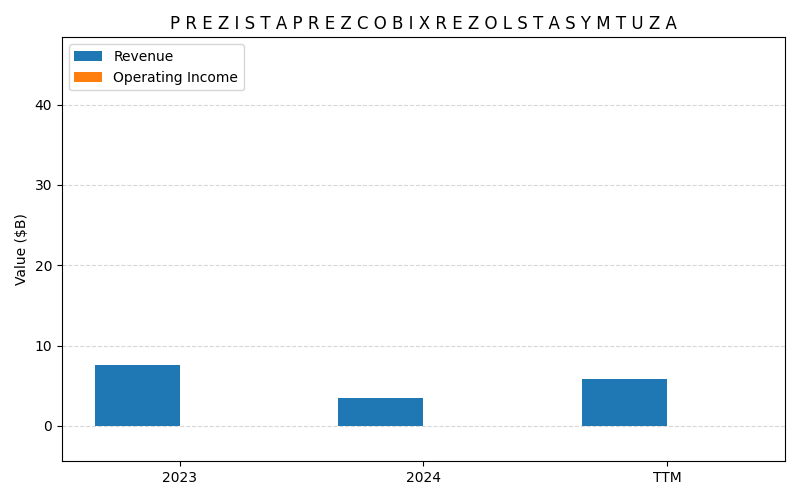
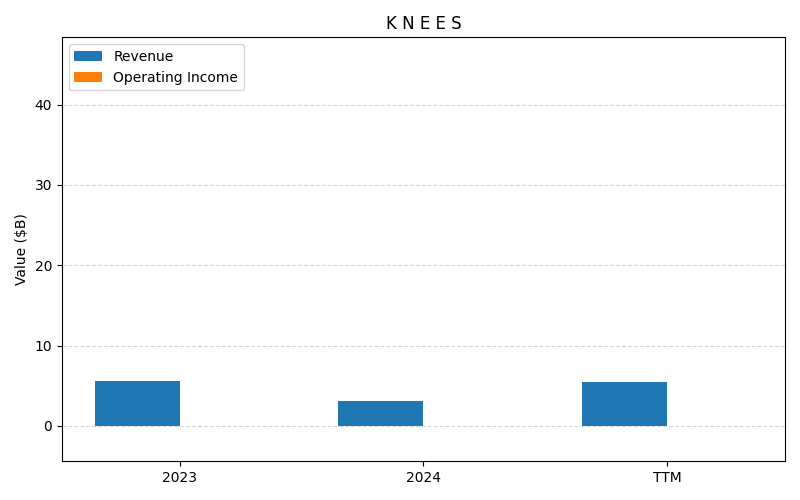
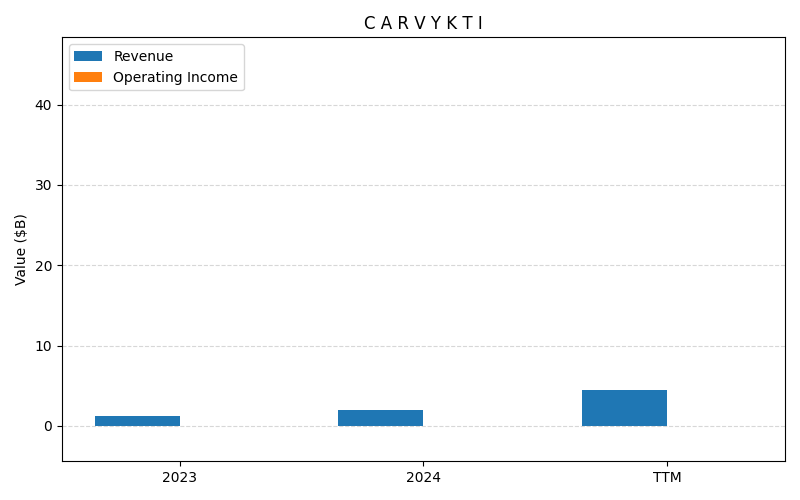
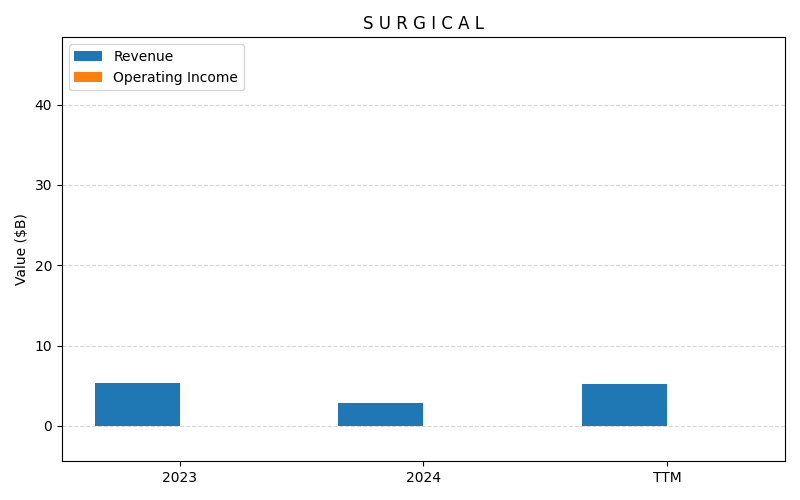
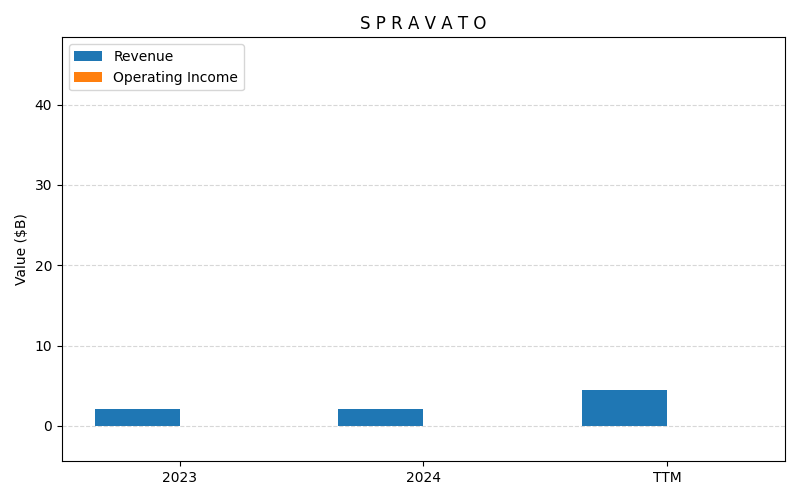
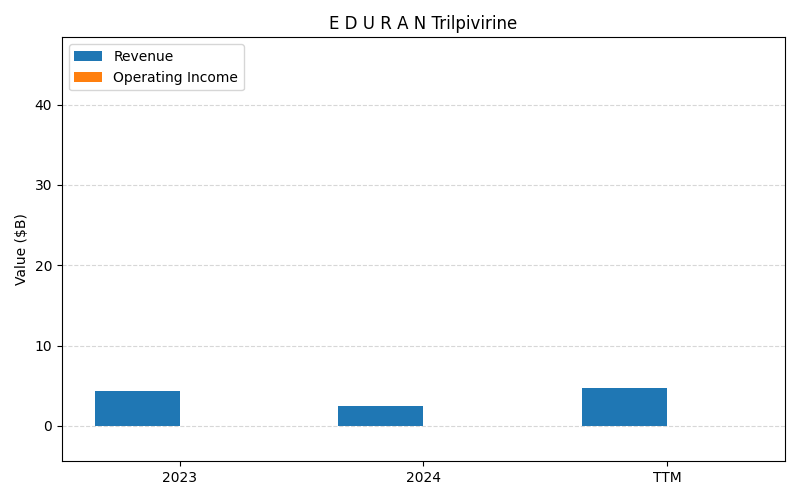
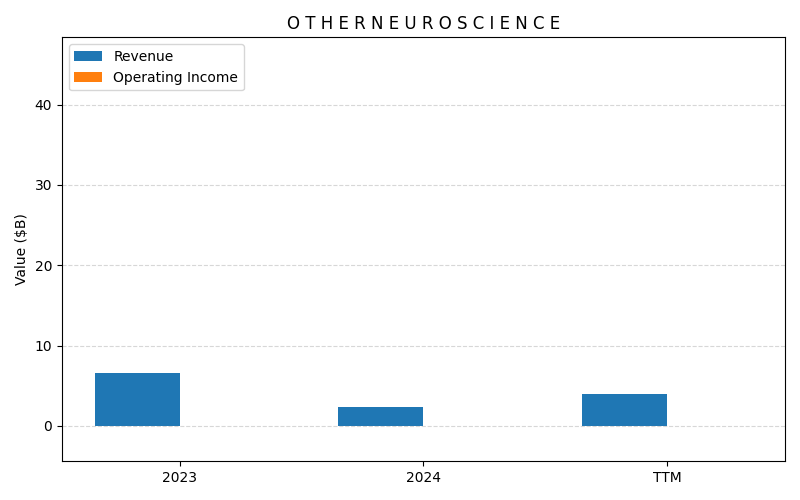
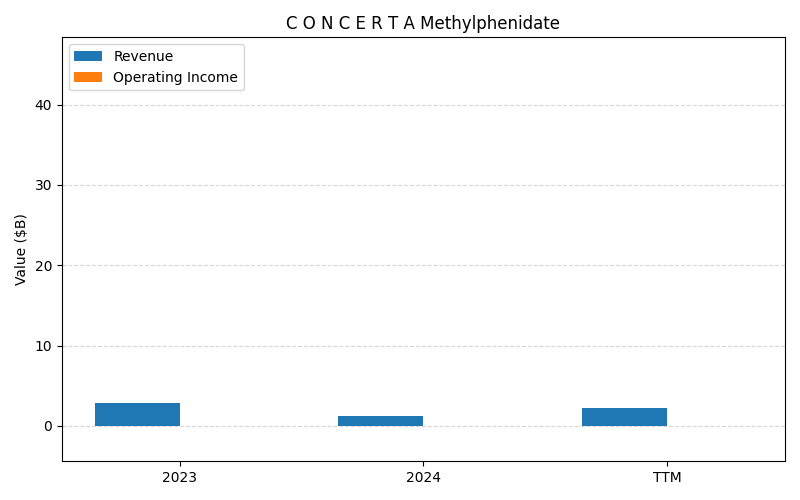
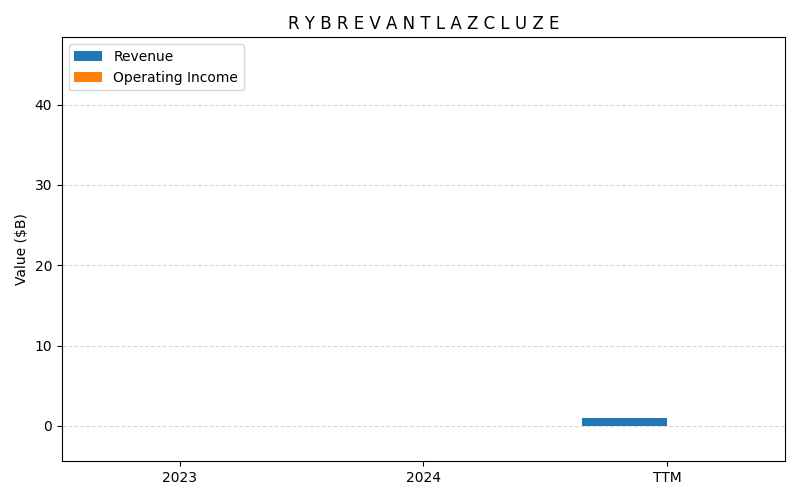
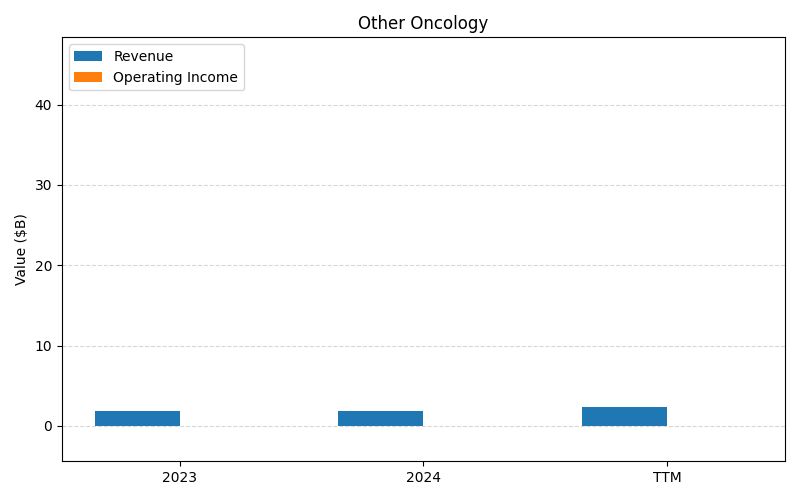

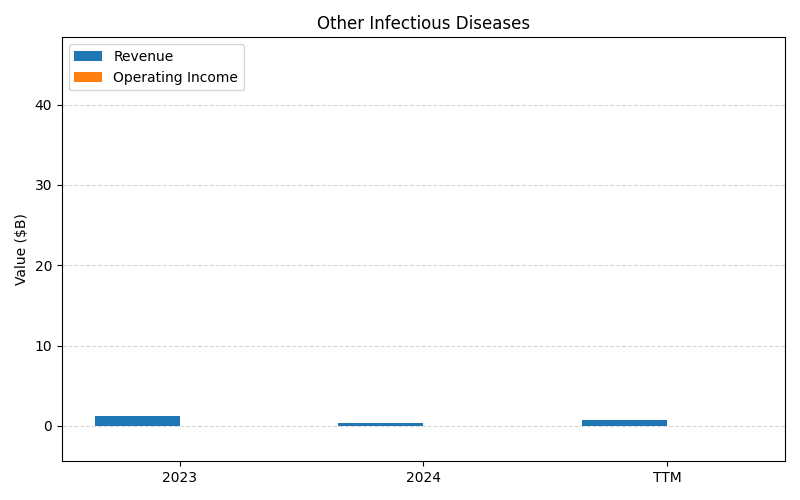
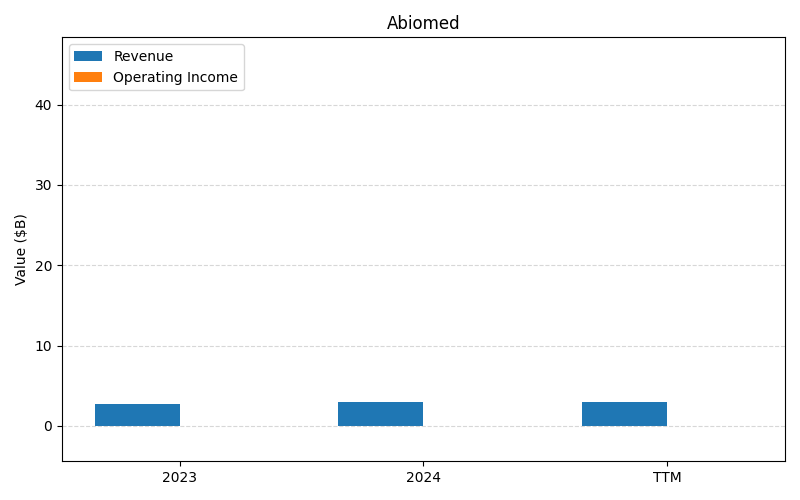
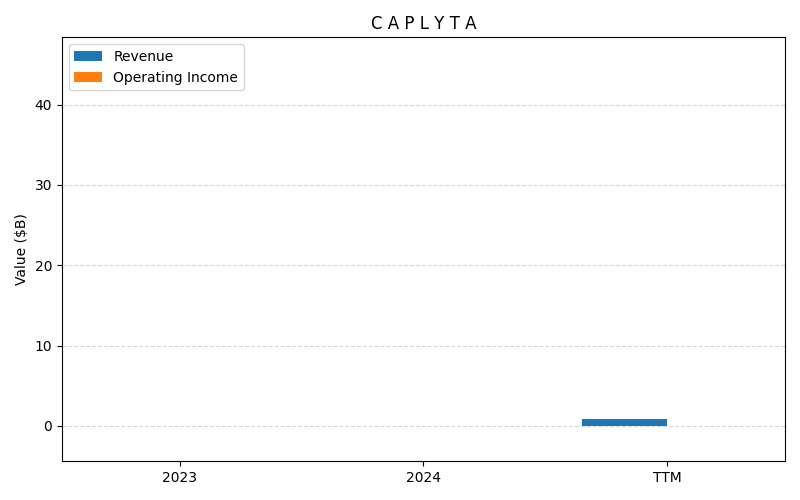
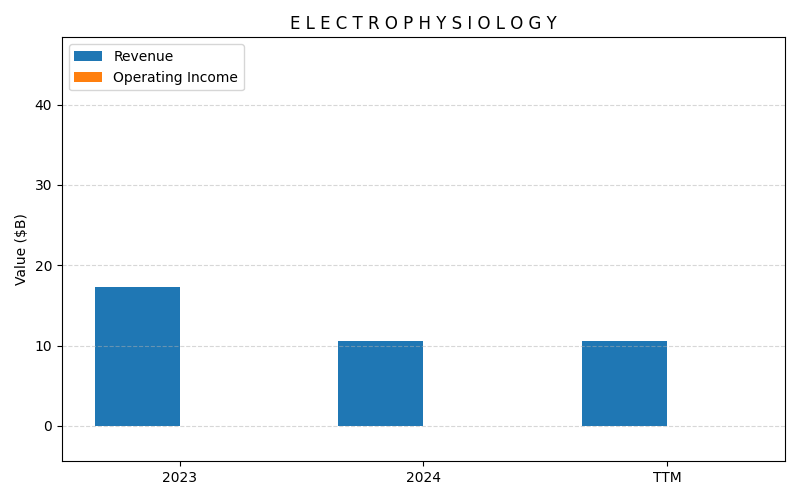
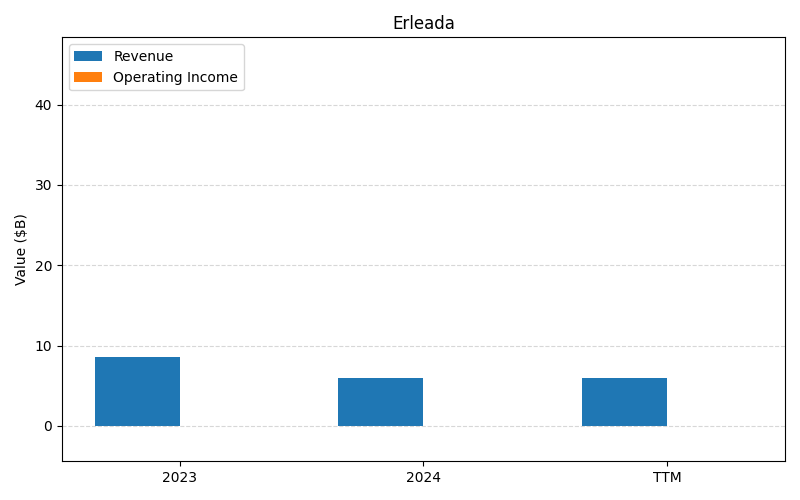
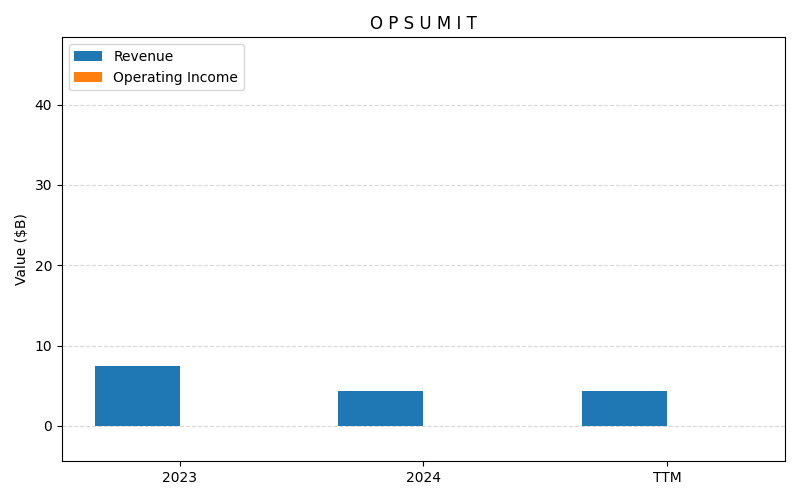
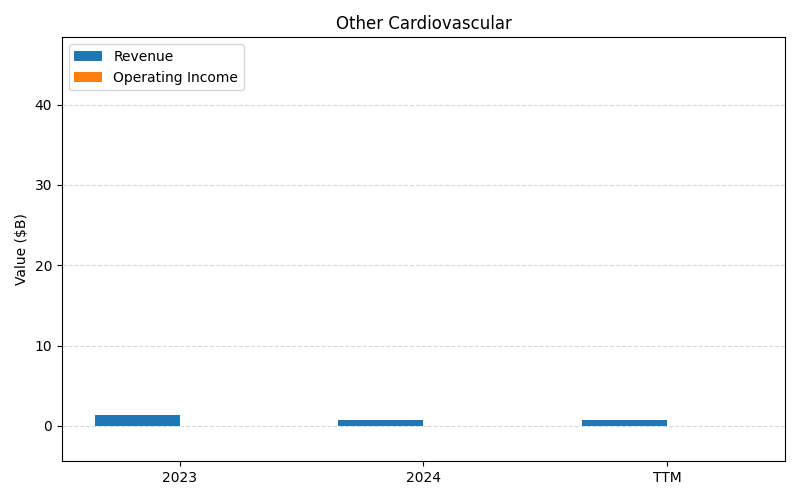
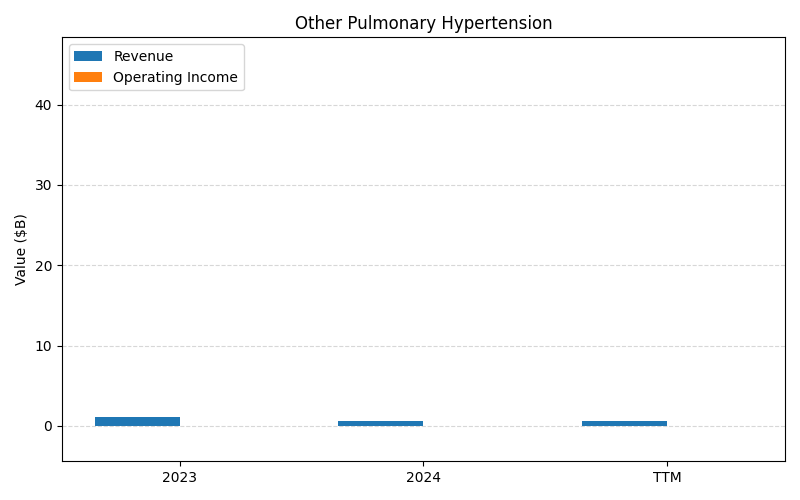
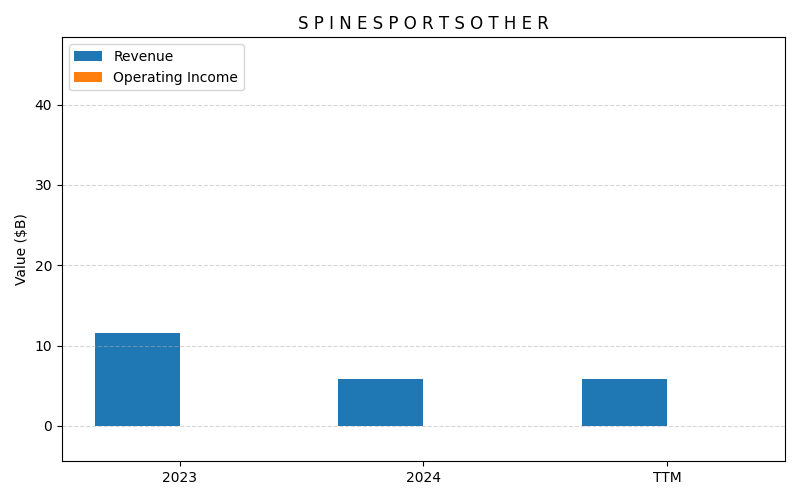
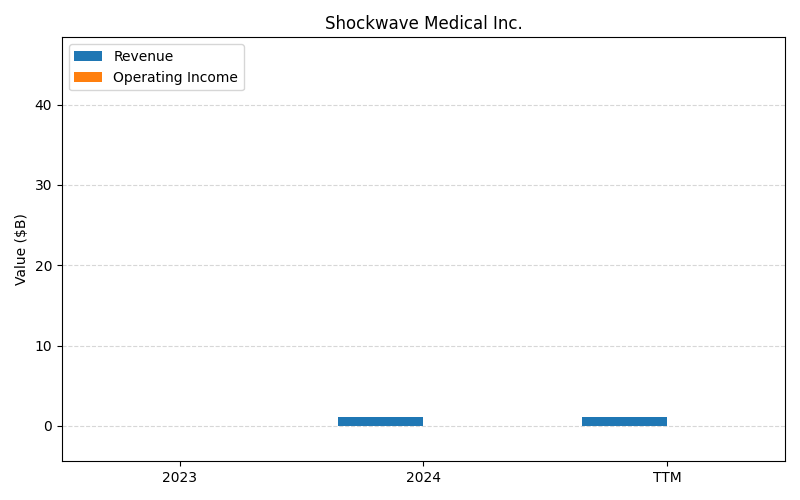
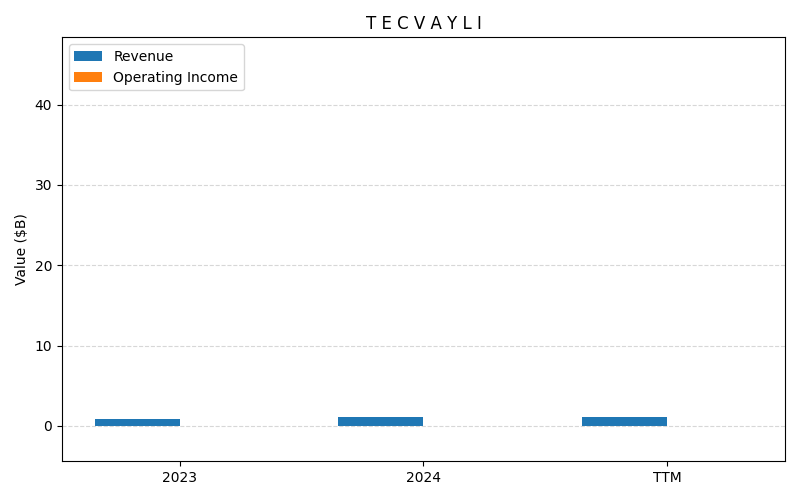
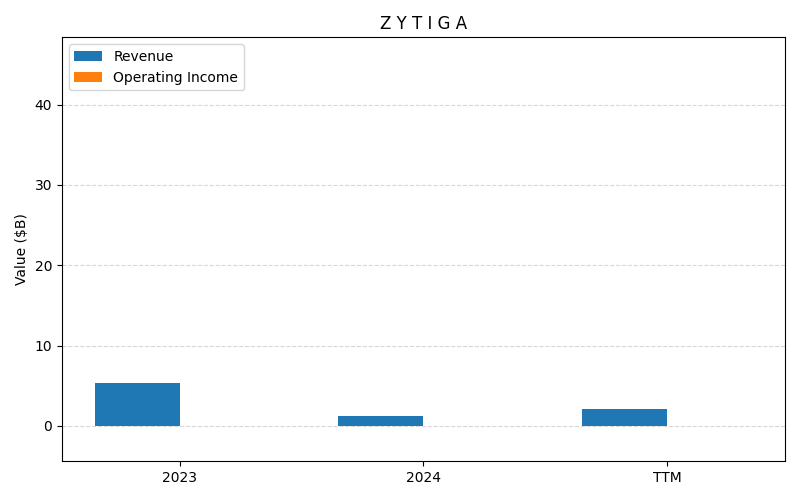
SEGMENTS v2025-09-09 · 2026-05-29 09:09 UTC — Units: $B. Rows list fiscal years (last 3 + TTM) with revenue for each segment; the final row shows the TTM revenue mix (operating income columns display “—” where mix is not applicable).
| Year | D A R Z A L E X Rev | Stelara Rev | G E N E R A L Rev | Tremfya Rev | A D V A N C E D Rev | I N V E G A S U S T E N N A X E P L I O N T R I N Z A T R E V I C T A Rev | C O N T A C T L E N S E S O T H E R Rev | Other Rev | T R A U M A Rev | I M B R U V I C A Rev | Xarelto Rev | Simponi Simponi Aria Rev | U P T R A V I Rev | Remicade Rev | H I P S Rev | P R E Z I S T A P R E Z C O B I X R E Z O L S T A S Y M T U Z A Rev | K N E E S Rev | C A R V Y K T I Rev | S U R G I C A L Rev | S P R A V A T O Rev | E D U R A N Trilpivirine Rev | O T H E R N E U R O S C I E N C E Rev | C O N C E R T A Methylphenidate Rev | R Y B R E V A N T L A Z C L U Z E Rev | Other Oncology Rev | T A L V E Y Rev | Other Infectious Diseases Rev | Other Immunology Rev | Abiomed Rev | C A P L Y T A Rev | E L E C T R O P H Y S I O L O G Y Rev | Erleada Rev | O P S U M I T Rev | Other Cardiovascular Rev | Other Pulmonary Hypertension Rev | S P I N E S P O R T S O T H E R Rev | Shockwave Medical Inc. Rev | T E C V A Y L I Rev | Z Y T I G A Rev | Total Rev |
|---|---|---|---|---|---|---|---|---|---|---|---|---|---|---|---|---|---|---|---|---|---|---|---|---|---|---|---|---|---|---|---|---|---|---|---|---|---|---|---|---|
| 2023 | 19.5B | 21.7B | 10.7B | 6.29B | 9.34B | 8.23B | 7.40B | 2.61B | 5.96B | 6.53B | 4.73B | 4.39B | 3.16B | 3.68B | 3.12B | 3.71B | 2.91B | 1.00B | 2.74B | 1.38B | 2.30B | 3.11B | 1.57B | 0.19B | 0.66B | 0.13B | 2.83B | 0.02B | 2.61B | – | 9.38B | 4.77B | 3.95B | 0.71B | 0.52B | 5.89B | – | 0.79B | 1.77B | 170.3B |
| 2024 | 23.3B | 20.7B | 10.7B | 7.34B | 8.98B | 8.44B | 7.47B | 2.38B | 6.10B | 6.08B | 4.75B | 4.38B | 3.63B | 3.21B | 3.28B | 3.42B | 3.09B | 1.93B | 2.83B | 2.15B | 2.54B | 2.35B | 1.28B | 0.65B | 0.63B | 0.57B | 0.82B | 0.01B | 2.99B | – | 10.5B | 6.00B | 4.45B | 0.76B | 0.48B | 5.85B | 1.13B | 1.10B | 1.26B | 177.6B |
| 2025 | 28.7B | 12.2B | 11.1B | 10.3B | 9.15B | 7.62B | 7.82B | 2.29B | 6.29B | 5.65B | 5.27B | 5.34B | 3.80B | 3.54B | 3.35B | 3.16B | 3.17B | 3.77B | 3.12B | 3.39B | 2.97B | 2.10B | 1.17B | 1.47B | 0.75B | 0.93B | 0.35B | 0.12B | 3.50B | 1.40B | 11.3B | 7.15B | 4.65B | 0.79B | 0.42B | 5.70B | 2.29B | 1.34B | 1.00B | 188.4B |
| TTM | 66.4B | 37.4B | 27.3B | 22.8B | 22.5B | 19.9B | 19.1B | 17.5B | 15.6B | 14.5B | 12.7B | 12.3B | 9.31B | 8.52B | 8.31B | 8.27B | 7.88B | 7.63B | 7.45B | 7.12B | 7.05B | 5.52B | 3.02B | 2.92B | 2.20B | 1.98B | 1.33B | 0.22B | – | – | – | – | – | – | – | – | – | – | – | 376.7B |
| % of Total (TTM) | 17.6% | 9.9% | 7.2% | 6.0% | 6.0% | 5.3% | 5.1% | 4.6% | 4.1% | 3.8% | 3.4% | 3.3% | 2.5% | 2.3% | 2.2% | 2.2% | 2.1% | 2.0% | 2.0% | 1.9% | 1.9% | 1.5% | 0.8% | 0.8% | 0.6% | 0.5% | 0.4% | 0.1% | – | – | – | – | – | – | – | – | – | – | – | 100% |
Segment Performance (Axis 2)
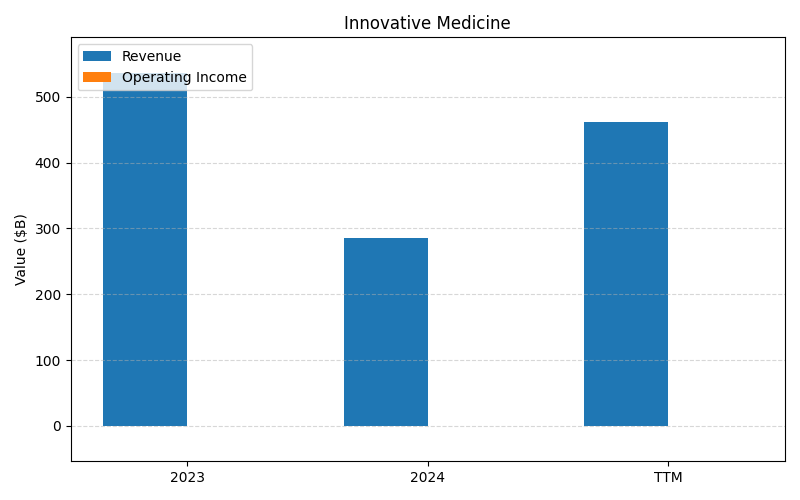
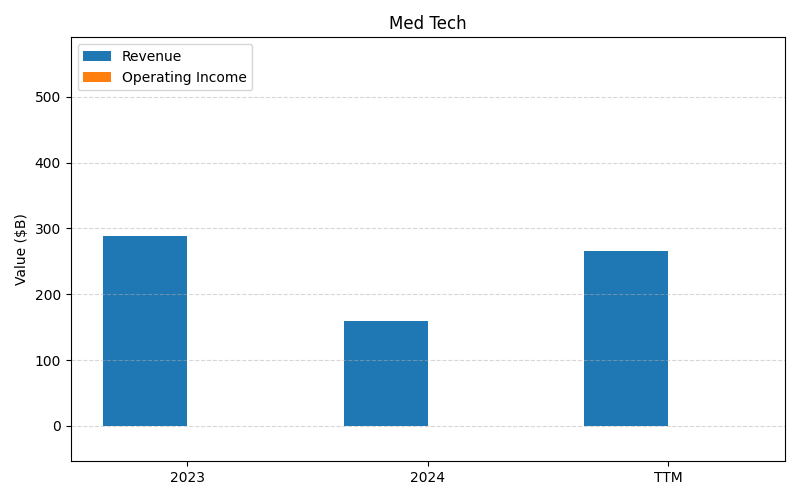
SEGMENTS v2025-09-09 · 2026-05-29 09:09 UTC — Units: $B. Rows list fiscal years (last 3 + TTM) with revenue for each segment; the final row shows the TTM revenue mix (operating income columns display “—” where mix is not applicable).
| Year | Innovative Medicine Rev | Med Tech Rev | Total Rev |
|---|---|---|---|
| 2023 | 219B | 121.6B | 340.6B |
| 2024 | 227.9B | 127.4B | 355.3B |
| 2025 | 241.6B | 135.2B | 376.8B |
| TTM | 586.7B | 333.7B | 920.4B |
| % of Total (TTM) | 63.7% | 36.3% | 100% |
Balance Sheet
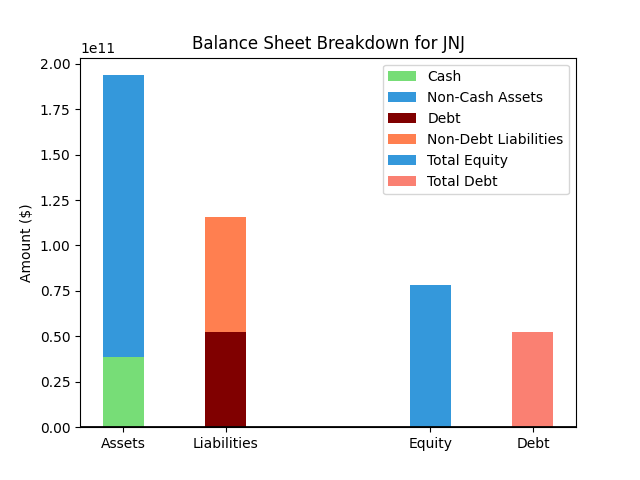
| Metric | Value | |
|---|---|---|
| 0 | Total Assets | $200,894M |
| 1 | Cash | $21,688M |
| 2 | Total Liabilities | $119,708M |
| 3 | Total Debt | $54,987M |
| 4 | Total Equity | $81,186M |
| 5 | Debt to Equity Ratio | 0.68 |
EPS & Dividend
Valuation
| Share Price | Treasury Yield | Estimates | Fair Value (P/E) | Fair Value (P/S) | Current P/S | Current P/E |
|---|---|---|---|---|---|---|
| $225.33 | 4.5% | FINVIZ Growth: 9% | Nicks: 6 Finviz: 16 |
Nick's: 0.000 | 5.6 | 26.1 |
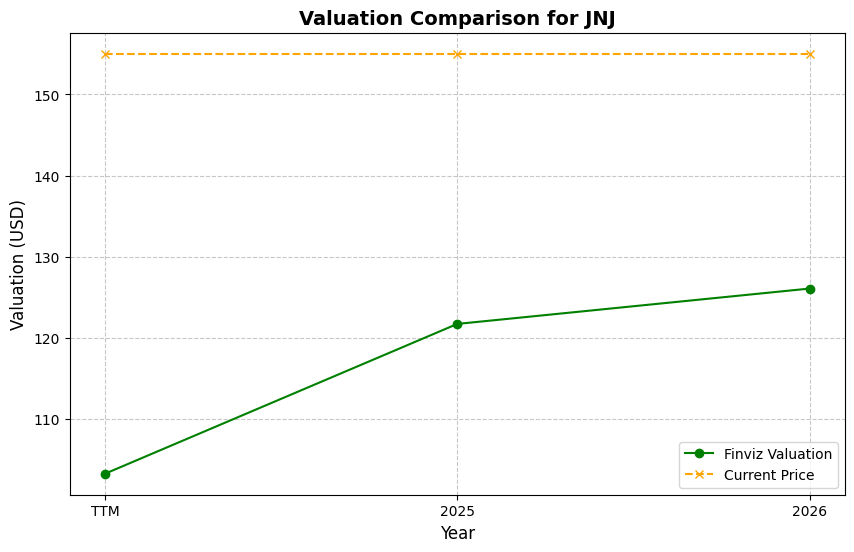
| Basis | Year | Nicks Valuation | Nicks vs Share Price | Finviz Valuation | Finviz vs Share Price |
|---|---|---|---|---|---|
| $8.63 EPS | TTM | $54.72 | -75.7% | $138.54 | -38.5% |
| $11.58 EPS | 2026 | $73.41 | -67.4% | $185.84 | -17.5% |
| $12.71 EPS | 2027 | $80.60 | -64.2% | $204.04 | -9.5% |
Implied Growth
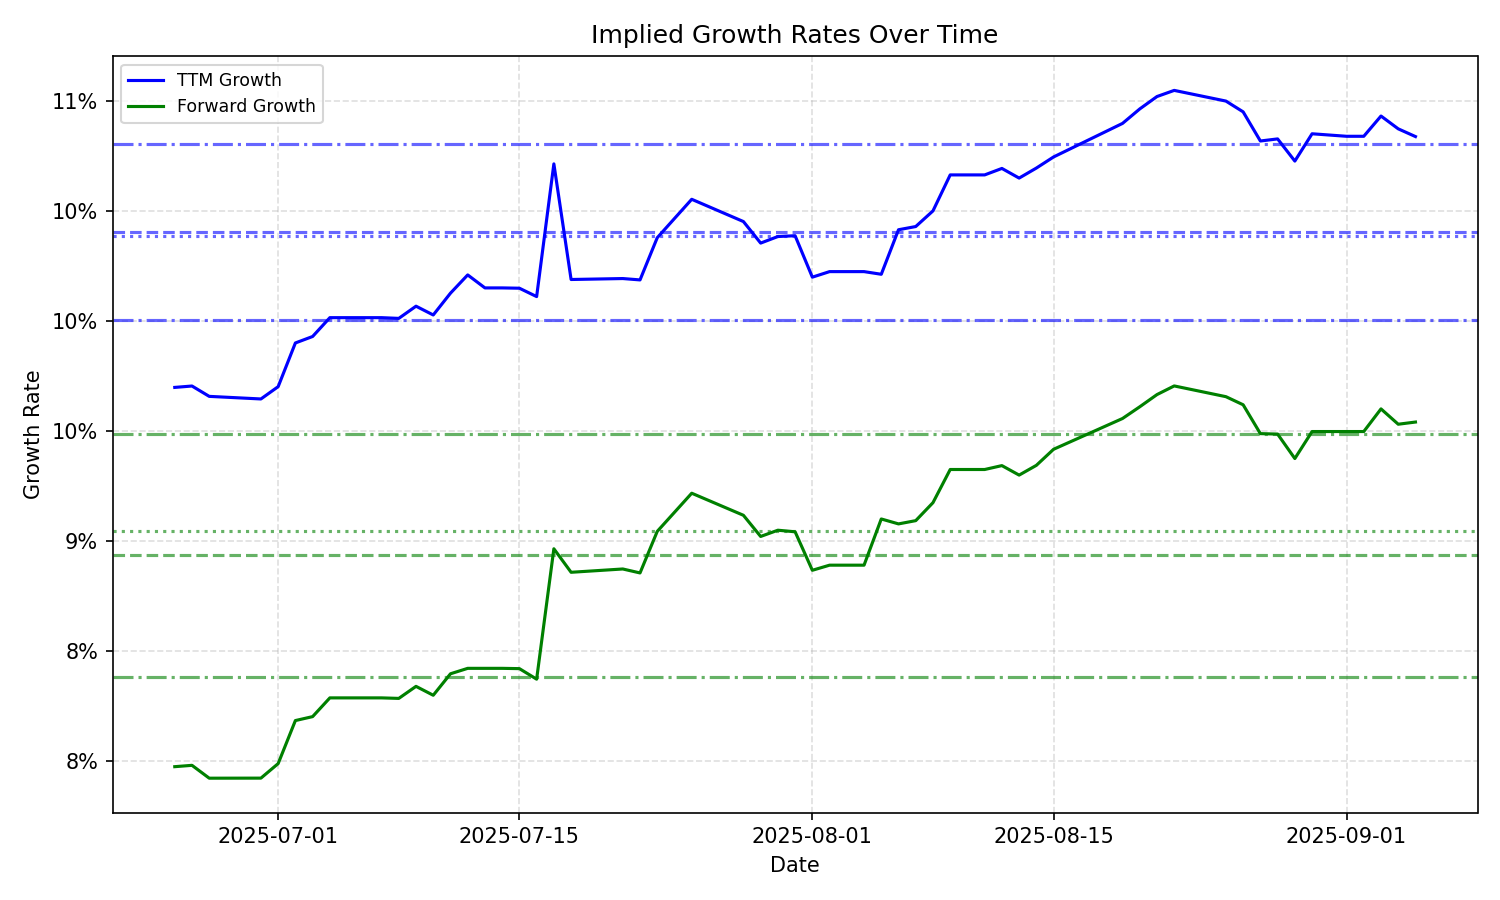
| Average | Median | Std Dev | Current | Percentile | ||||||
|---|---|---|---|---|---|---|---|---|---|---|
| TTM | Forward | TTM | Forward | TTM | Forward | TTM | Forward | TTM | Forward | |
| Timeframe | ||||||||||
| 1 Year | 11.55% | 10.07% | 11.19% | 10.18% | 1.34% | 0.83% | 14.79% | 10.60% | 96.3% | 64.5% |
| 3 Years | 11.55% | 10.07% | 11.19% | 10.18% | 1.34% | 0.83% | 14.79% | 10.60% | 96.3% | 64.5% |
| 5 Years | 11.55% | 10.07% | 11.19% | 10.18% | 1.34% | 0.83% | 14.79% | 10.60% | 96.3% | 64.5% |
| 10 Years | 11.55% | 10.07% | 11.19% | 10.18% | 1.34% | 0.83% | 14.79% | 10.60% | 96.3% | 64.5% |