Intel Corporation — INTC
| Close Price | Market Cap | P/E Ratio | Forward P/E Ratio | Implied Growth* | Implied Forward Growth* | Dividend | P/B Ratio |
|---|---|---|---|---|---|---|---|
| $114.68 | $576.38B | - | 74.5 | N/A | 26.7% | - | 5.2 |
Latest Headlines
- · These 2 Tech Titans Just Declared Dividend Raises. Should You Buy One or Both?
- · Why SentinelOne Stock Is Sinking Today
- · Nvidia, AMD, & other chip names in focus at Computex 2026
- · Why PagerDuty Just Popped 30% Today
- · What Historically Happens to Stocks When the Fed Goes Silent in Summer
- · The CEOs of the world's biggest chip companies are descending on Taiwan next week
Revenue & Net Income
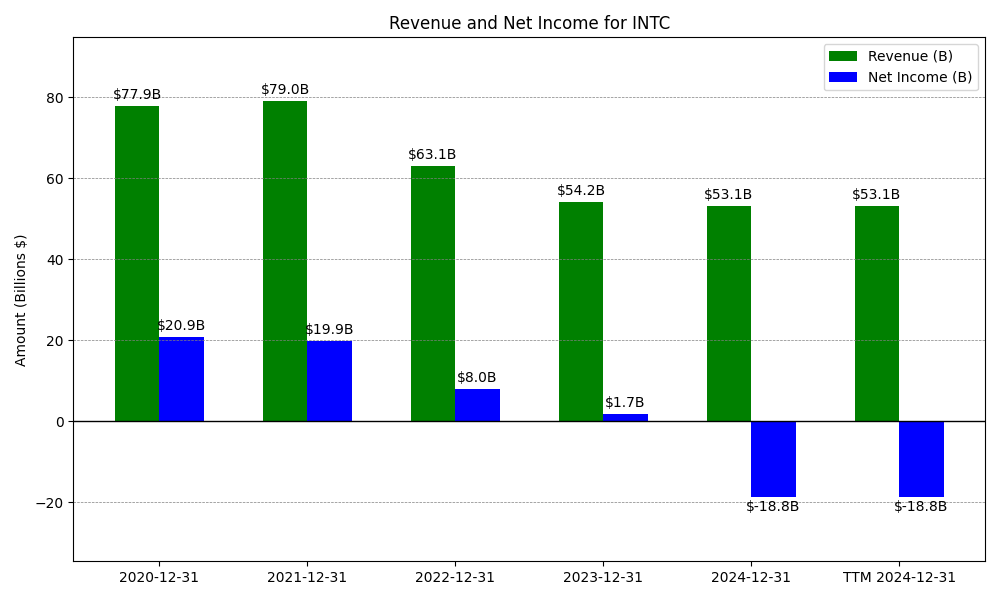
| Date | Revenue | Net_Income | EPS | Last_Updated | Revenue_Change | Net_Income_Change | EPS_Change | |
|---|---|---|---|---|---|---|---|---|
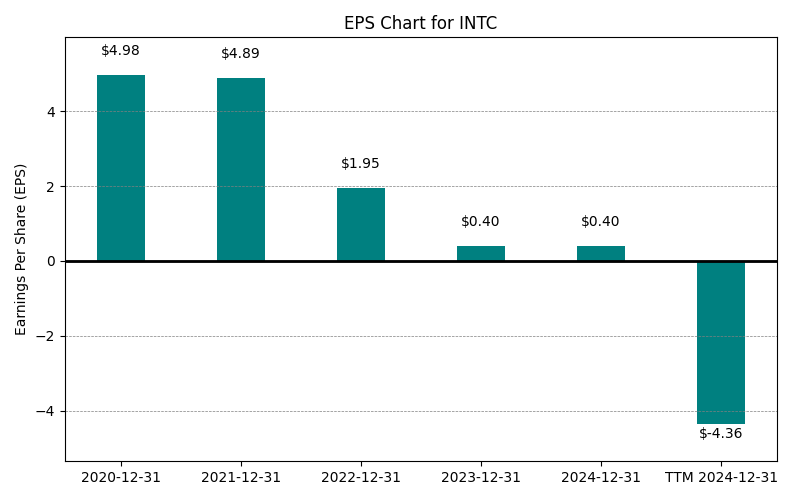
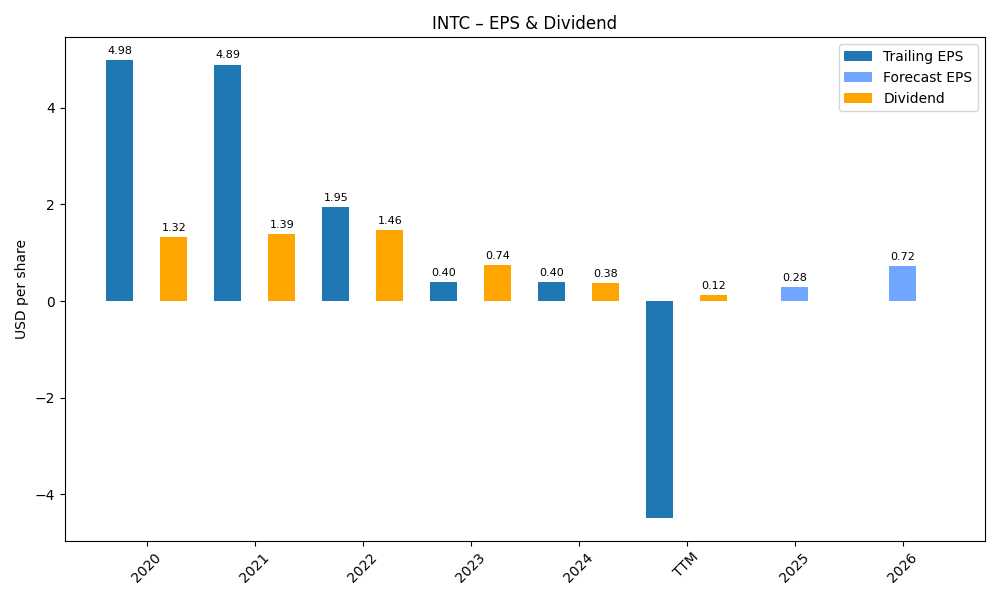
| 0 | 2020-12-31 | $77,867M | $20,899M | $4.98 | 2024-02-03 03:17:10 | N/A | N/A | N/A |
| 1 | 2021-12-31 | $79,024M | $19,868M | $4.89 | 2024-02-03 03:17:10 | 1.5% | -4.9% | -1.8% |
| 2 | 2022-12-31 | $63,054M | $8,014M | $1.95 | 2026-05-29 09:09:34 | -20.2% | -59.7% | -60.1% |
| 3 | 2023-12-31 | $54,228M | $1,689M | $0.40 | 2026-05-29 09:09:34 | -14.0% | -78.9% | -79.5% |
| 4 | 2024-12-31 | $53,101M | $-18,756M | $-4.38 | 2026-05-29 09:09:34 | -2.1% | -1210.5% | -1195.0% |
| 5 | 2025-12-31 | $52,853M | $-267M | $-0.06 | 2026-05-29 09:09:34 | -0.5% | -98.6% | -98.6% |
| 6 | TTM 2026-03-31 | $53,763M | $-3,174M | $-0.60 | 2026-04-27 08:53:37 | 1.7% | 1088.8% | 900.0% |
EPS
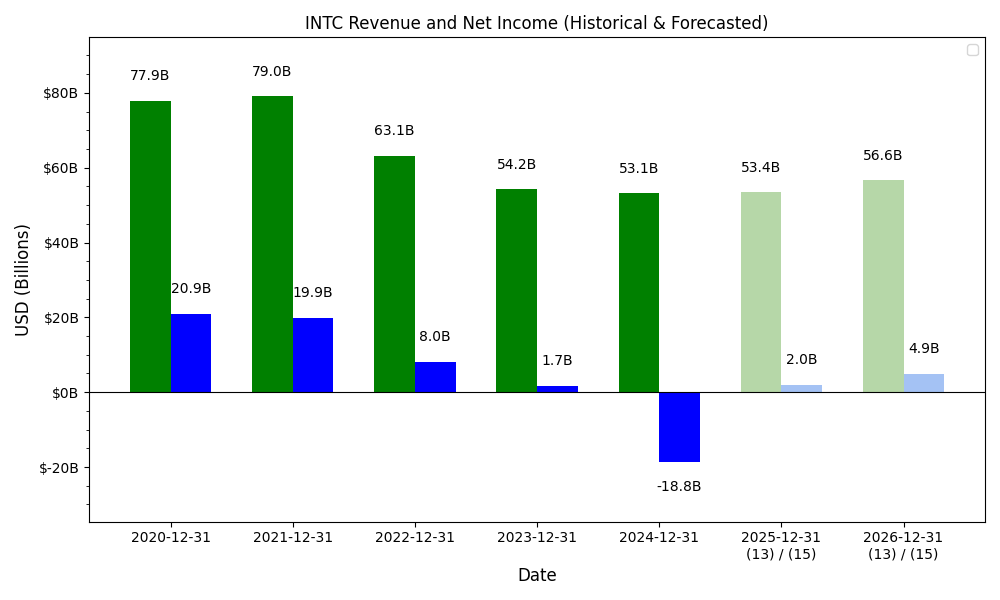
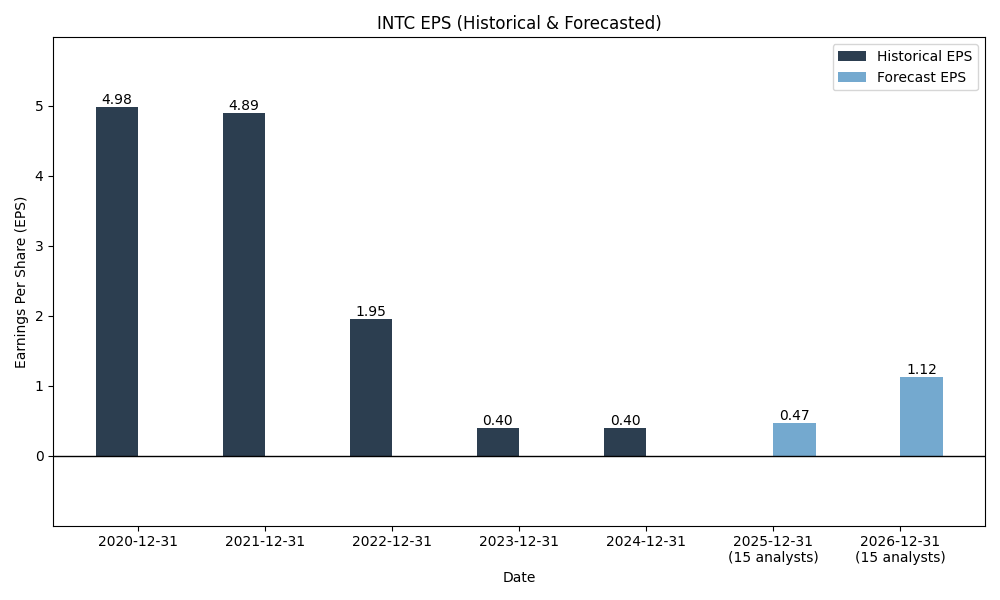
Forecasts
Y/Y % Change
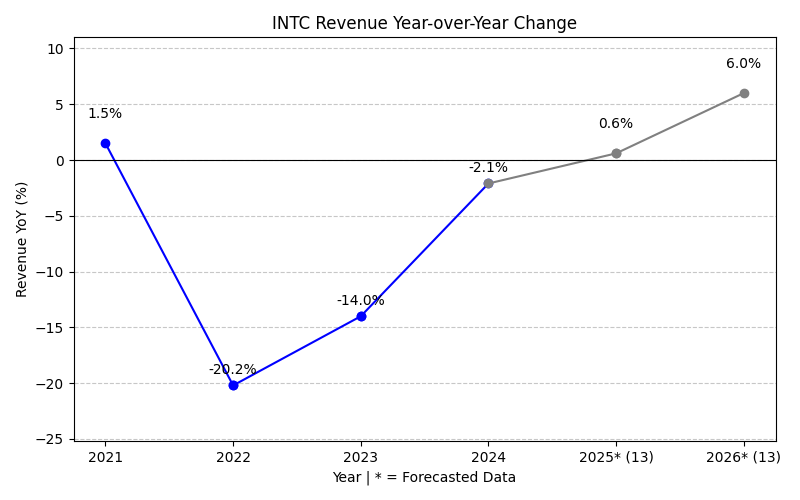
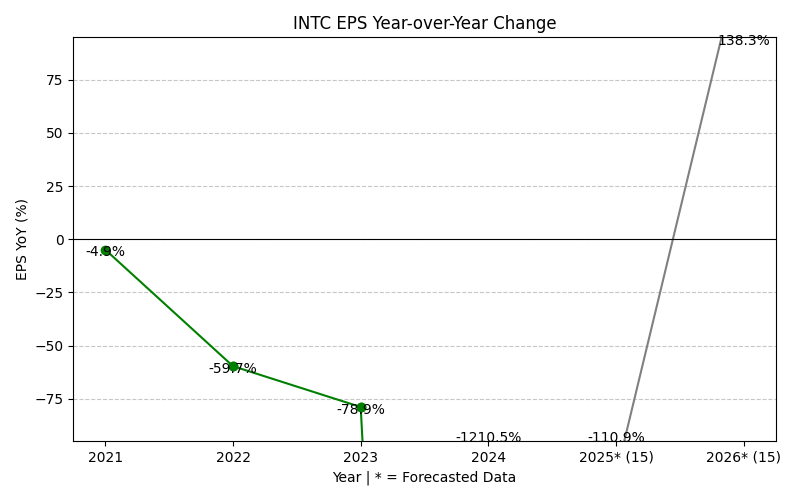
INTC Year-over-Year Growth
| 2020 | 2021 | 2022 | 2023 | 2024 | 2025 | 2026 | 2027 | Average | |
|---|---|---|---|---|---|---|---|---|---|
| Revenue Growth (%) | 1.5% | -20.2% | -14.0% | -2.1% | -0.5% | 11.0% | 11.0% | -1.9% | |
| Revenue Analysts (#) | 0 | 0 | 0 | 0 | 0 | 0 | 39 | 39 | |
| EPS Growth (%) | -4.9% | -59.7% | -78.9% | -1210.5% | -98.6% | -2148.1% | 41.5% | -508.5% | |
| EPS Analysts (#) | 0 | 0 | 0 | 0 | 0 | 0 | 38 | 39 |
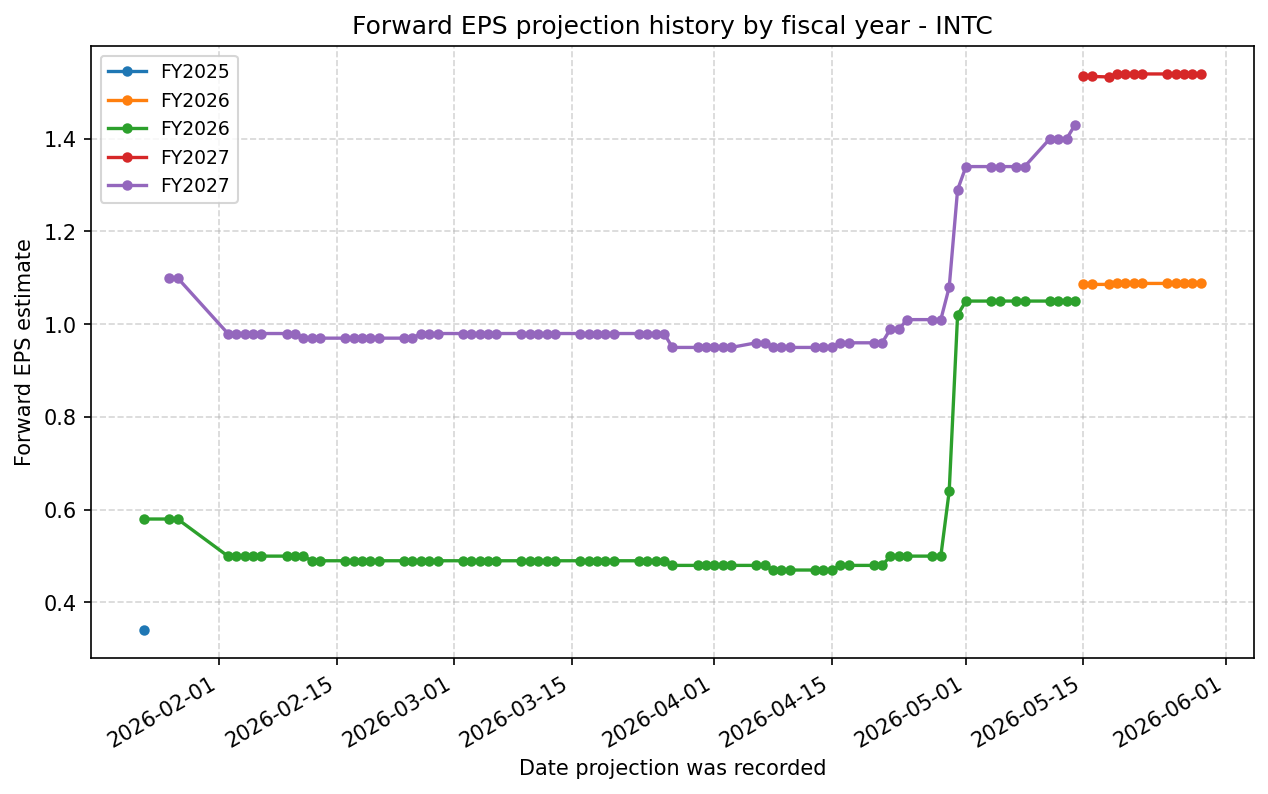
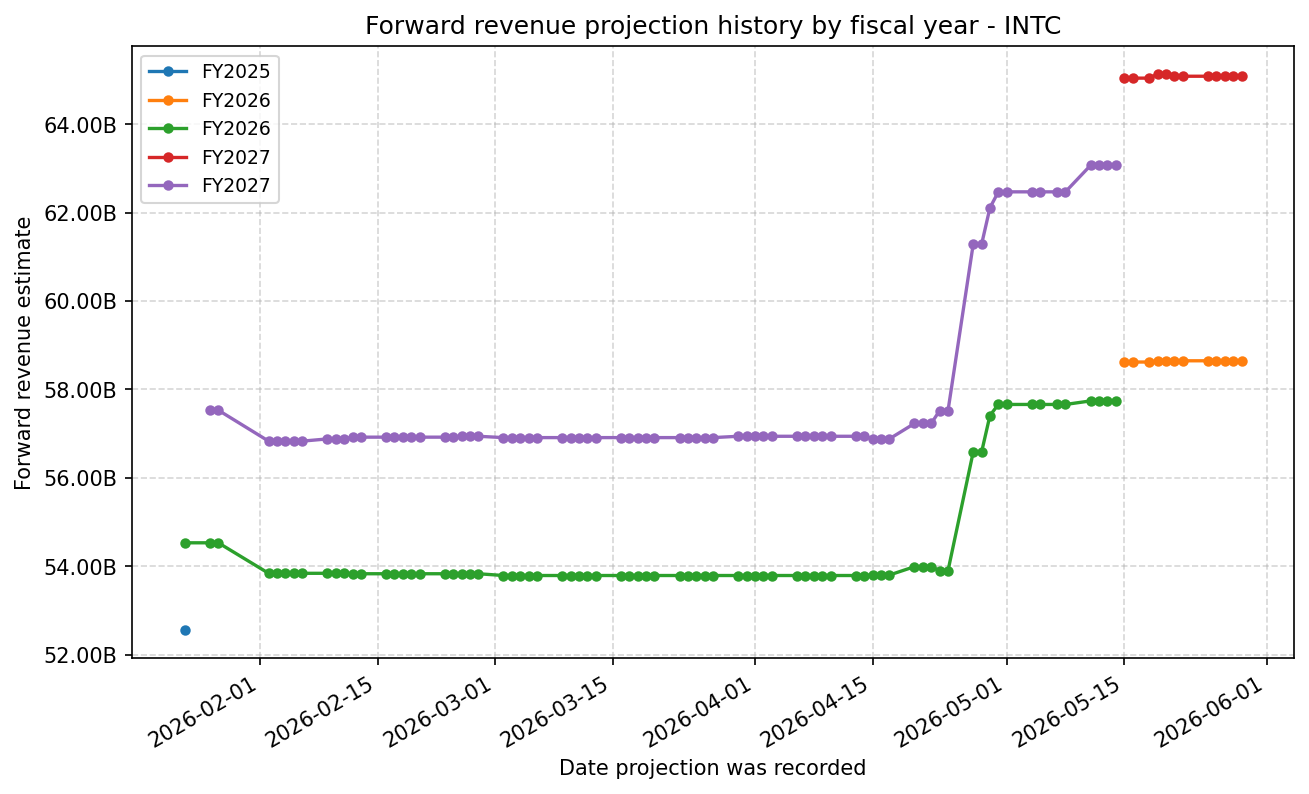
Forward Estimate History
How the next-FY EPS and revenue estimates have drifted over time. One line per fiscal year – past lines end when that FY became current.
Expenses
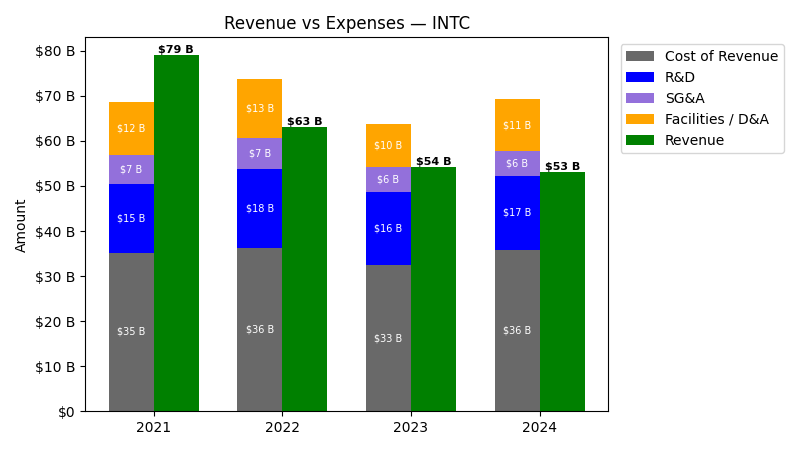
| Year | Revenue ($) | Cost of Revenue ($) | R&D ($) | SG&A ($) | Facilities / D&A ($) |
|---|---|---|---|---|---|
| 2021 | $79.0B | $23.4B | $15.2B | $6.5B | $11.8B |
| 2022 | $63.1B | $23.2B | $17.5B | $7.0B | $13.0B |
| 2023 | $54.2B | $22.9B | $16.0B | $5.6B | $9.6B |
| 2024 | $53.1B | $24.4B | $16.5B | $5.5B | $11.4B |
| 2025 | $52.9B | $22.8B | $13.8B | $4.6B | $11.7B |
| TTM | $53.8B | $22.5B | $13.5B | $4.5B | $12.2B |
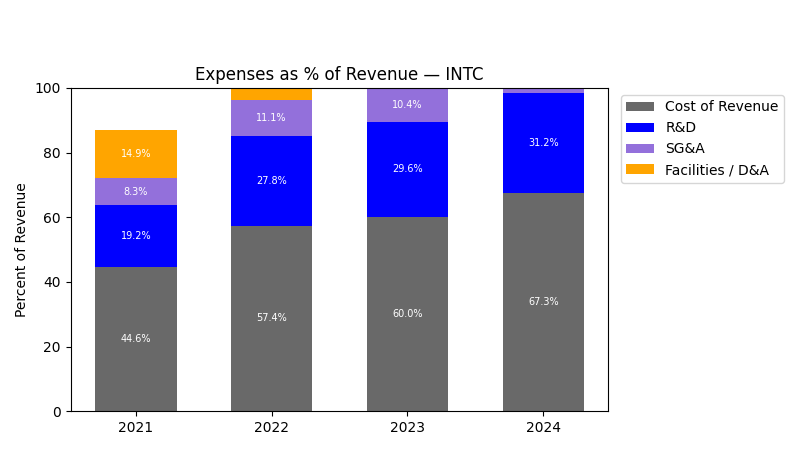
| Year | Revenue Change (%) | Cost of Revenue Change (%) | R&D Change (%) | SG&A Change (%) | Facilities / D&A Change (%) |
|---|---|---|---|---|---|
| 2022 | -20.21 | -1.13 | 15.39 | 7.02 | 10.54 |
| 2023 | -14.00 | -1.03 | -8.46 | -19.54 | -26.34 |
| 2024 | -2.08 | 6.38 | 3.12 | -2.25 | 18.51 |
| 2025 | -0.47 | -6.58 | -16.75 | -16.03 | 2.87 |
| TTM | 1.72 | -1.00 | -1.92 | -3.01 | 3.95 |
No unmapped expenses.
Segment Performance

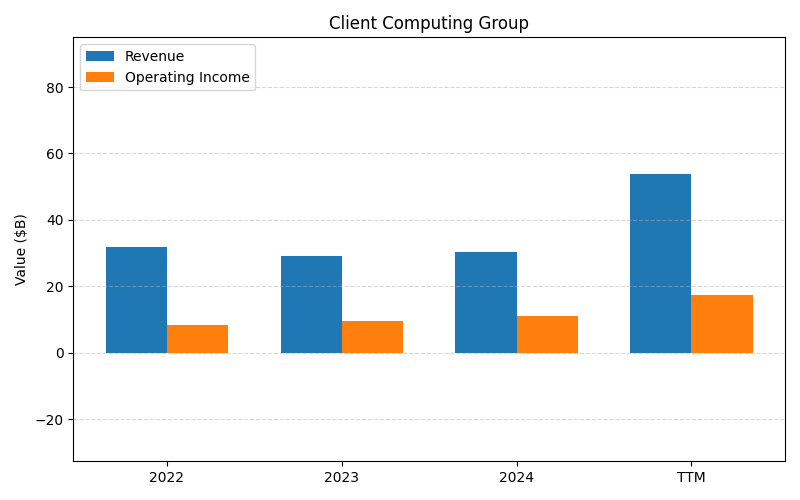
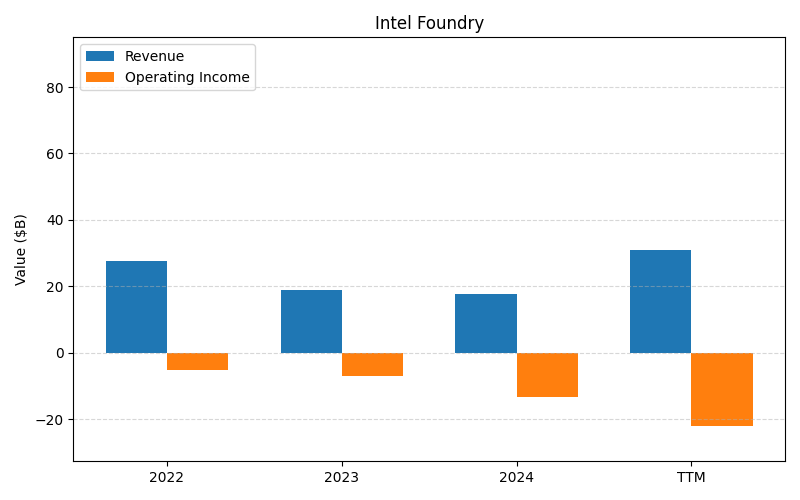
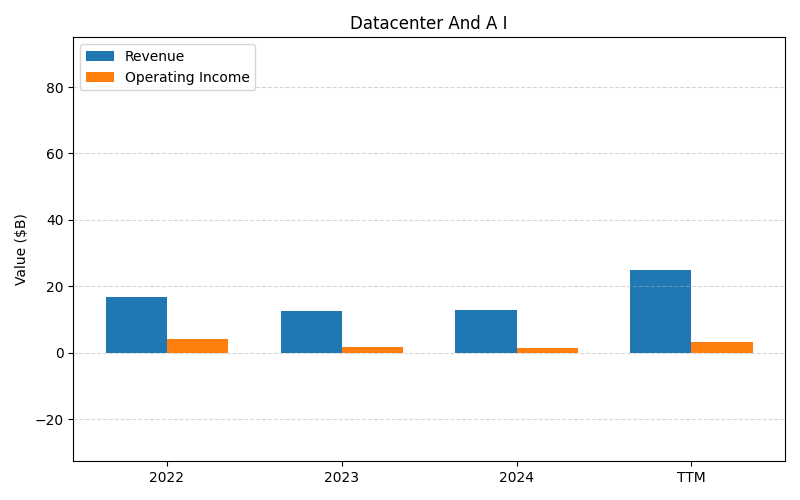
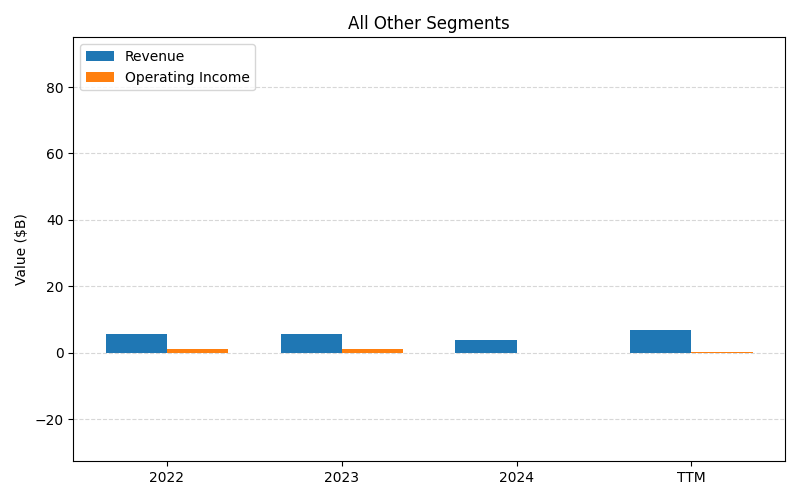
SEGMENTS v2025-09-09 · 2026-05-29 09:09 UTC — Units: $B. Rows list fiscal years (last 3 + TTM) with revenue and operating income for each segment; the final row shows the TTM revenue mix (operating income columns display “—” where mix is not applicable).
| Year | Client Computing Group Datacenter And A I And Network And Edge Rev | Client Computing Group Datacenter And A I And Network And Edge OI | Client Computing Group Rev | Client Computing Group OI | Intel Foundry Rev | Intel Foundry OI | Datacenter And A I Rev | Datacenter And A I OI | All Other Segments Rev | All Other Segments OI | Total Rev | Total OI |
|---|---|---|---|---|---|---|---|---|---|---|---|---|
| 2023 | 48.3B | 11.1B | 32.3B | 10.1B | 18.5B | -7.08B | 16B | 0.94B | 5.46B | 1.51B | 120.5B | 16.6B |
| 2024 | 49.5B | 13B | 33.3B | 11.6B | 17.3B | -13.3B | 16.1B | 1.41B | 3.60B | -0.06B | 119.9B | 12.7B |
| 2025 | 49.1B | 12.7B | 32.2B | 9.32B | 17.8B | -10.3B | 16.9B | 3.42B | 3.56B | 0.26B | 119.7B | 15.4B |
| TTM | 123.2B | 32.7B | 80.9B | 25.8B | 45.2B | -28.4B | 42.2B | 6.95B | 8.73B | 0.41B | 300.3B | 37.5B |
| % of Total (TTM) | 41.0% | — | 27.0% | — | 15.1% | — | 14.1% | — | 2.9% | — | 100% | — |
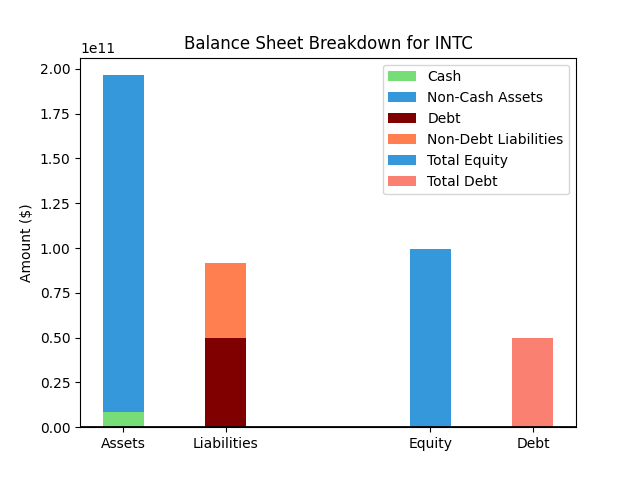
Balance Sheet
| Metric | Value | |
|---|---|---|
| 0 | Total Assets | $205,332M |
| 1 | Cash | $17,247M |
| 2 | Total Liabilities | $80,343M |
| 3 | Total Debt | $45,031M |
| 4 | Total Equity | $111,394M |
| 5 | Debt to Equity Ratio | 0.40 |
EPS & Dividend
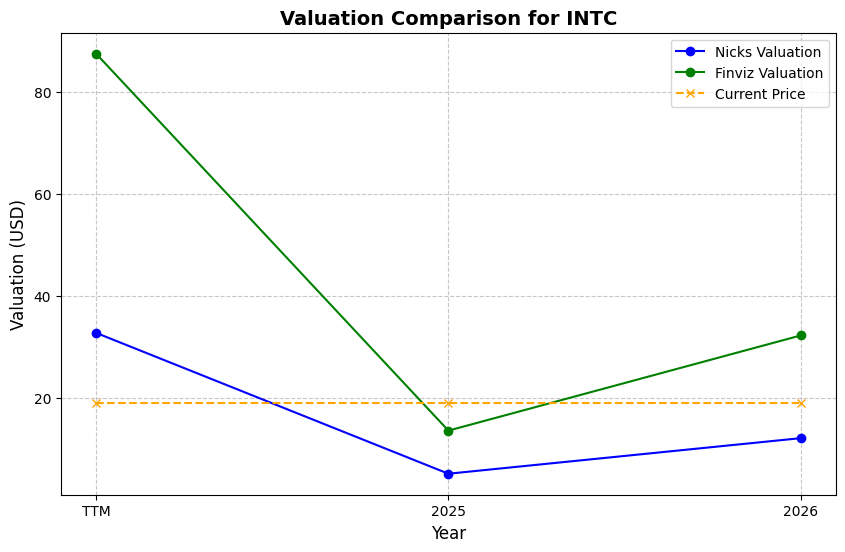
Valuation
| Share Price | Treasury Yield | Estimates | Fair Value (P/E) | Fair Value (P/S) | Current P/S | Current P/E |
|---|---|---|---|---|---|---|
| $114.68 | 4.5% | Nicks Growth: 5% Nick's Expected Margin: 25% FINVIZ Growth: 72% |
Nicks: 11 Finviz: 1746 |
Nick's: 2.640 | 10.7 | - |
| Basis | Year | Nicks Valuation | Nicks vs Share Price | Finviz Valuation | Finviz vs Share Price |
|---|---|---|---|---|---|
| $10.70 Revenue | TTM | $28.24 | -75.4% | $4670.30 | 3972.5% |
| $1.09 EPS | 2026 | $11.49 | -90.0% | $1900.10 | 1556.9% |
| $1.54 EPS | 2027 | $16.26 | -85.8% | $2688.97 | 2244.8% |
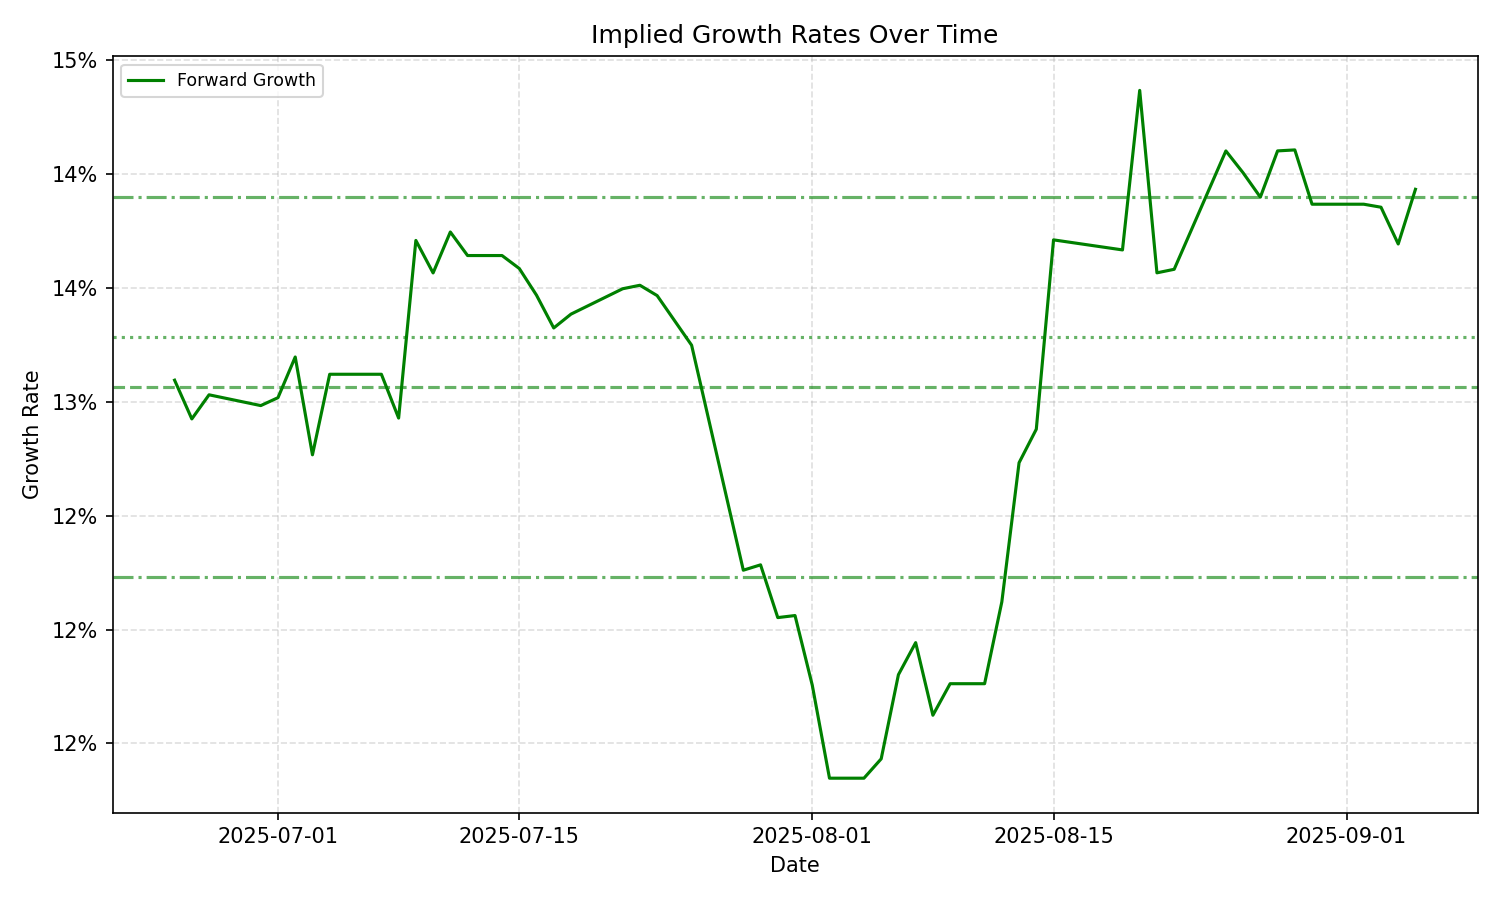
Implied Growth
| Average | Median | Std Dev | Current | Percentile | ||||||
|---|---|---|---|---|---|---|---|---|---|---|
| TTM | Forward | TTM | Forward | TTM | Forward | TTM | Forward | TTM | Forward | |
| Timeframe | ||||||||||
| 1 Year | 58.00% | 19.06% | 56.14% | 19.13% | 4.61% | 4.71% | 59.25% | 27.34% | 78.6% | 96.6% |
| 3 Years | 58.00% | 19.06% | 56.14% | 19.13% | 4.61% | 4.71% | 59.25% | 27.34% | 78.6% | 96.6% |
| 5 Years | 58.00% | 19.06% | 56.14% | 19.13% | 4.61% | 4.71% | 59.25% | 27.34% | 78.6% | 96.6% |
| 10 Years | 58.00% | 19.06% | 56.14% | 19.13% | 4.61% | 4.71% | 59.25% | 27.34% | 78.6% | 96.6% |