Robinhood Markets, Inc. — HOOD
| Close Price | Market Cap | P/E Ratio | Forward P/E Ratio | Implied Growth* | Implied Forward Growth* | Dividend | P/B Ratio |
|---|---|---|---|---|---|---|---|
| $94.30 | $84.92B | 45.8 | 34.6 | 20.9% | 17.7% | - | 9.1 |
Latest Headlines
- · Robinhood Is Opening the Door to U.S. Cannabis With Reform On the Horizon
- · Weekly Wrap: Crypto Prices Breakdown As Bitcoin Falls In May
- · This Risk ETF Is Riding Its Best Seven-Day Stretch in a Year
- · Coinbase, Robinhood Stocks Soar as Regulator Permits Crypto Perpetual Futures for U.S.
- · Week’s Best: Super Bowl Party May Cost J.P. Morgan Millions
- · HOOD Stock Hits 4-Month High After Analyst Upgrades – Retail Traders Target $100 By Market Close
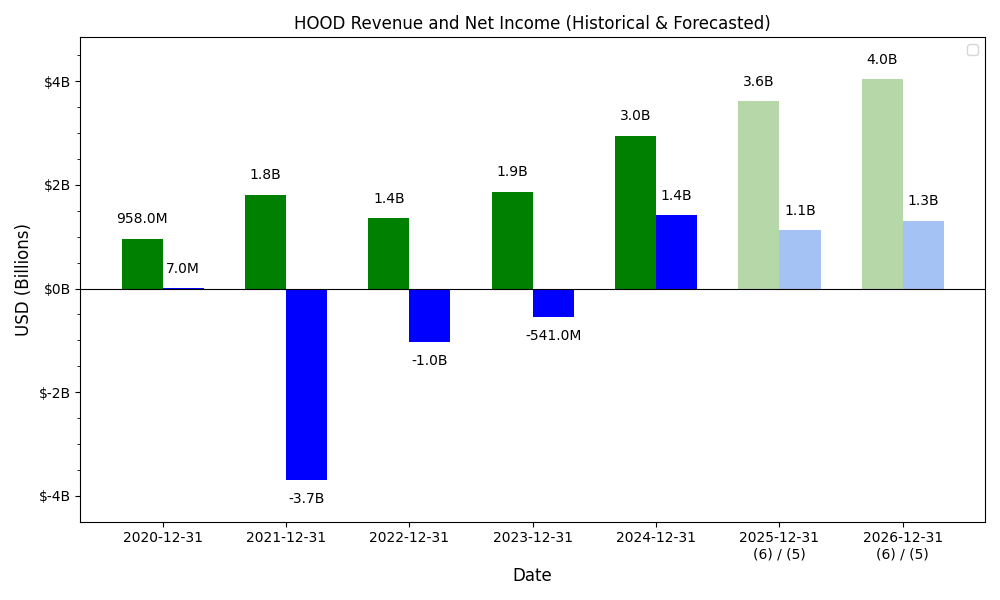
Revenue & Net Income
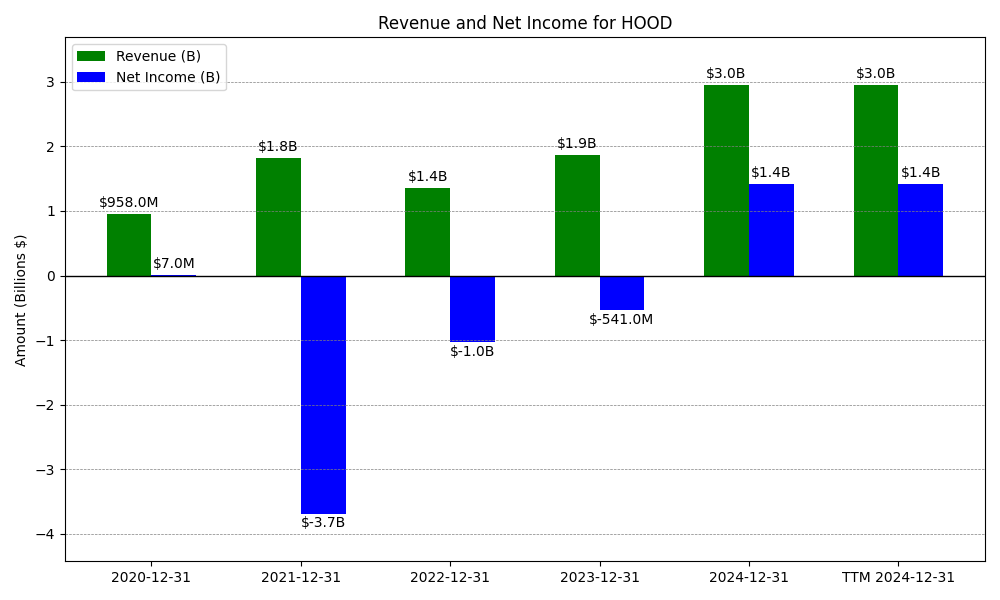
| Date | Revenue | Net_Income | EPS | Last_Updated | Revenue_Change | Net_Income_Change | EPS_Change | |
|---|---|---|---|---|---|---|---|---|
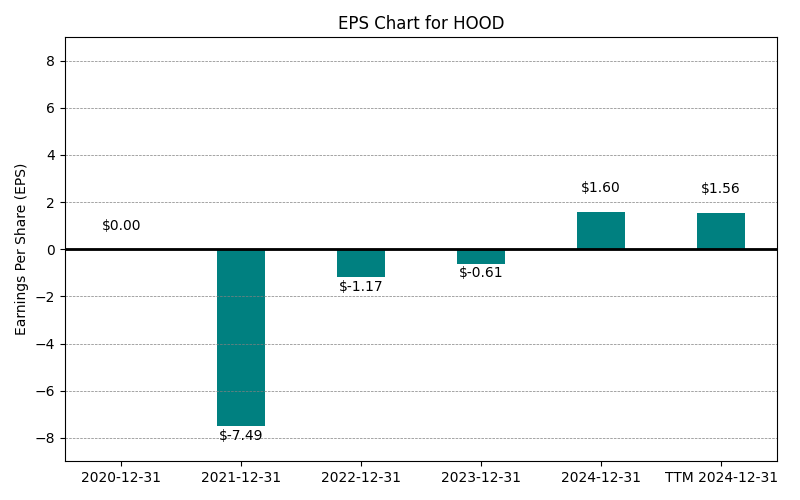
| 0 | 2020-12-31 | $958M | $7M | $0.00 | 2024-02-03 03:17:10 | N/A | N/A | N/A |
| 1 | 2021-12-31 | $1,815M | $-3,687M | $-7.49 | 2026-02-27 08:36:32 | 89.5% | -52771.4% | -180930.5% |
| 2 | 2022-12-31 | $1,358M | $-1,028M | $-1.17 | 2026-05-29 09:09:27 | -25.2% | -72.1% | -84.4% |
| 3 | 2023-12-31 | $1,865M | $-541M | $-0.61 | 2026-05-29 09:09:27 | 37.3% | -47.4% | -47.9% |
| 4 | 2024-12-31 | $2,951M | $1,411M | $1.60 | 2026-05-29 09:09:27 | 58.2% | -360.8% | -362.3% |
| 5 | 2025-12-31 | $4,473M | $1,883M | $2.12 | 2026-05-29 09:09:27 | 51.6% | 33.5% | 32.5% |
| 6 | TTM 2026-03-31 | $4,613M | $1,897M | $2.06 | 2026-04-30 08:49:33 | 3.1% | 0.7% | -2.8% |
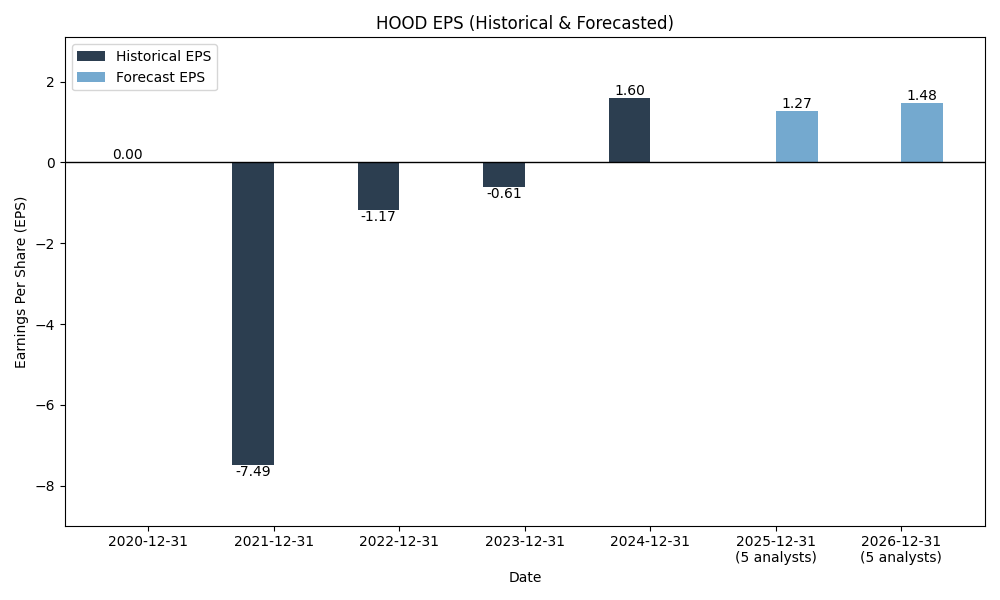
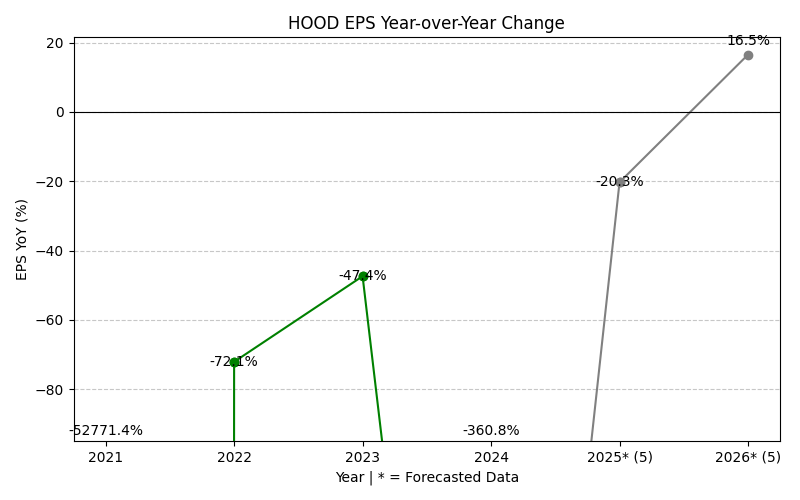
EPS
Forecasts
Y/Y % Change
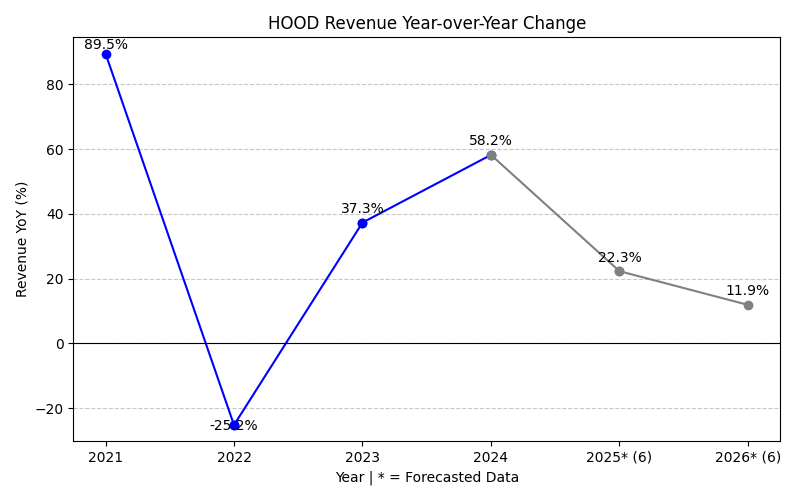
HOOD Year-over-Year Growth
| 2020 | 2021 | 2022 | 2023 | 2024 | 2025 | 2026 | 2027 | Average | |
|---|---|---|---|---|---|---|---|---|---|
| Revenue Growth (%) | 89.5% | -25.2% | 37.3% | 58.2% | 51.6% | 12.1% | 21.0% | 34.9% | |
| Revenue Analysts (#) | 0 | 0 | 0 | 0 | 0 | 0 | 22 | 23 | |
| EPS Growth (%) | -52771.4% | -72.1% | -47.4% | -360.8% | 33.5% | -10.1% | 32.9% | -7599.3% | |
| EPS Analysts (#) | 0 | 0 | 0 | 0 | 0 | 0 | 21 | 22 |
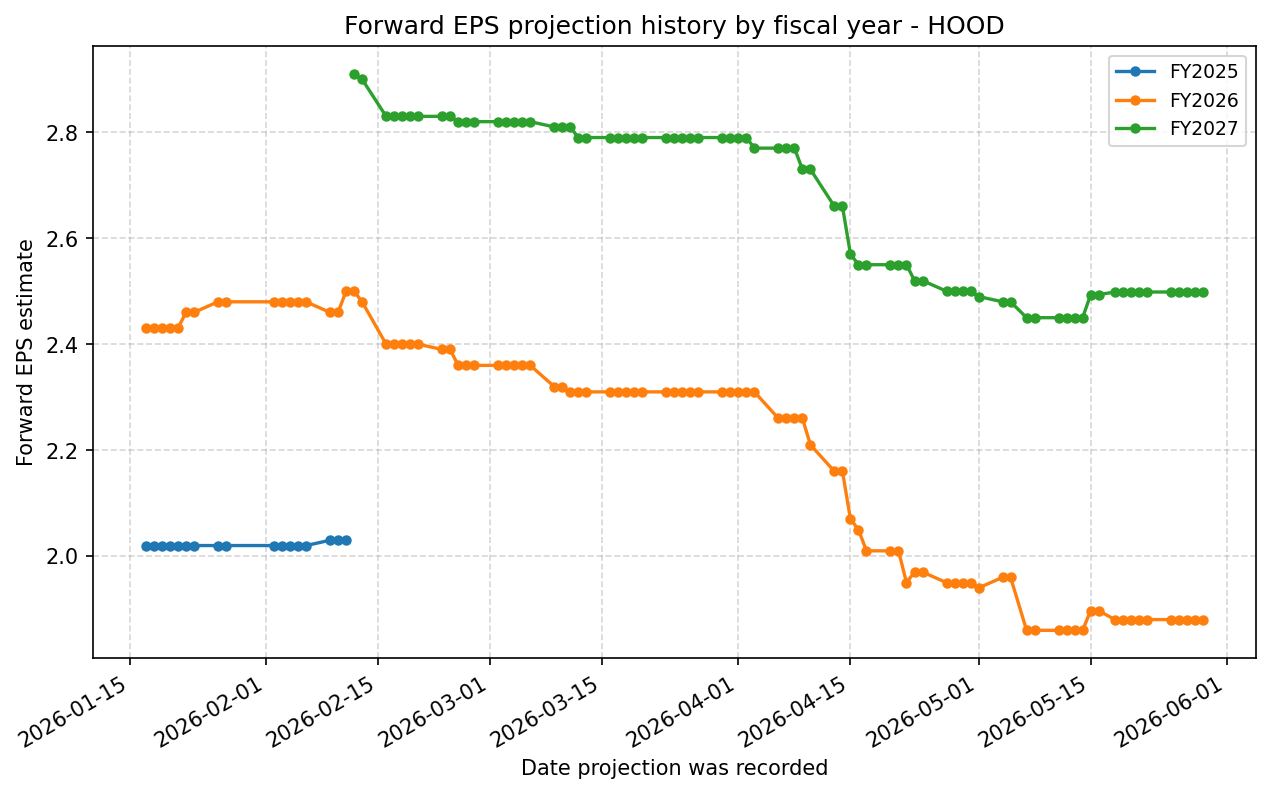
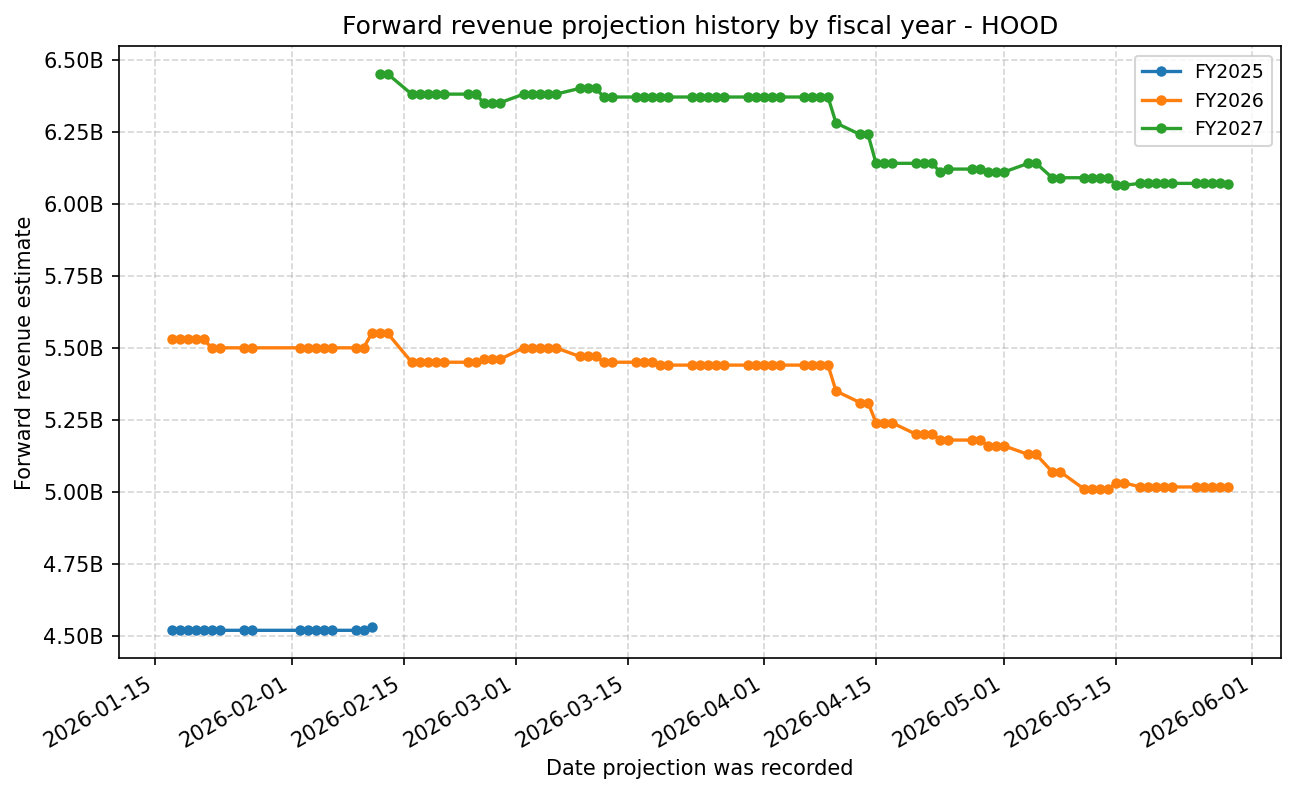
Forward Estimate History
How the next-FY EPS and revenue estimates have drifted over time. One line per fiscal year – past lines end when that FY became current.
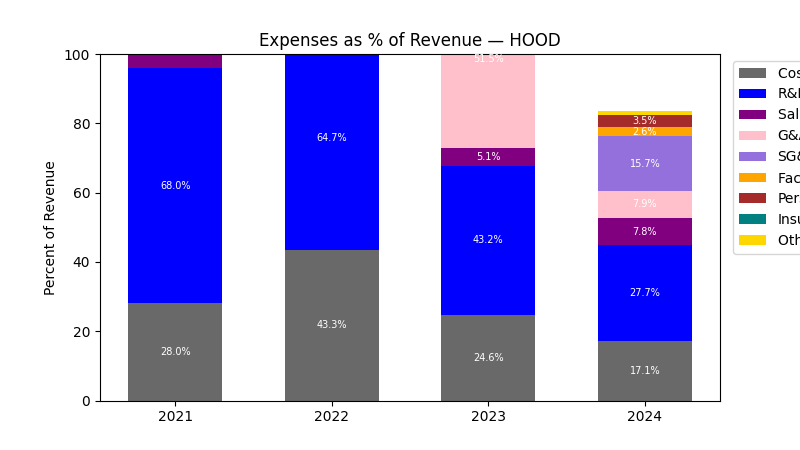
Expenses
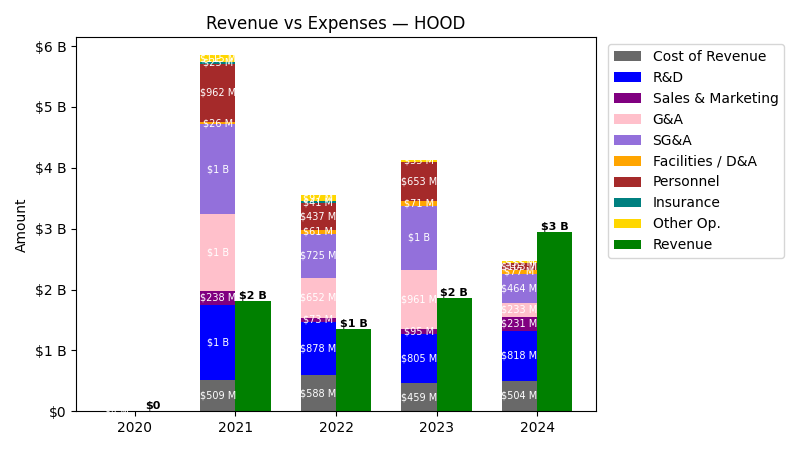
| Year | Revenue ($) | Cost of Revenue ($) | R&D ($) | Sales & Marketing ($) | G&A ($) | SG&A ($) | Facilities / D&A ($) | Personnel ($) | Insurance / Claims ($) | Other Operating ($) |
|---|---|---|---|---|---|---|---|---|---|---|
| 2022 | $1.4B | $527.0M | $878.0M | $73.0M | $652.0M | $725.0M | $61.0M | $437.0M | $41.0M | $36.0M |
| 2023 | $1.9B | $75.0M | $805.0M | $122.0M | $1.2B | $1.3B | $71.0M | $660.0M | $0.0 | $43.0M |
| 2024 | $3.0B | $530.0M | $818.0M | $231.0M | $132.0M | $363.0M | $77.0M | $103.0M | $0.0 | $76.0M |
| 2025 | $4.5B | $659.0M | $897.0M | $349.0M | $227.0M | $576.0M | $86.0M | $0.0 | $0.0 | $114.0M |
| TTM | $4.6B | $729.0M | $924.0M | $350.0M | $210.0M | $560.0M | $89.0M | $77.0M | $0.0 | $126.0M |
| Year | Revenue Change (%) | Cost of Revenue Change (%) | R&D Change (%) | Sales & Marketing Change (%) | G&A Change (%) | SG&A Change (%) | Facilities / D&A Change (%) | Personnel Change (%) | Insurance / Claims Change (%) | Other Operating Change (%) |
|---|---|---|---|---|---|---|---|---|---|---|
| 2023 | 37.33 | -85.77 | -8.31 | 67.12 | 79.29 | 78.07 | 16.39 | 51.03 | -100.0 | 19.44 |
| 2024 | 58.23 | 606.67 | 1.61 | 89.34 | -88.71 | -71.88 | 8.45 | -84.39 | NaN | 76.74 |
| 2025 | 51.58 | 24.34 | 9.66 | 51.08 | 71.97 | 58.68 | 11.69 | -100.00 | NaN | 50.00 |
| TTM | 3.13 | 10.62 | 3.01 | 0.29 | -7.49 | -2.78 | 3.49 | inf | NaN | 10.53 |
No unmapped expenses.
Segment Performance
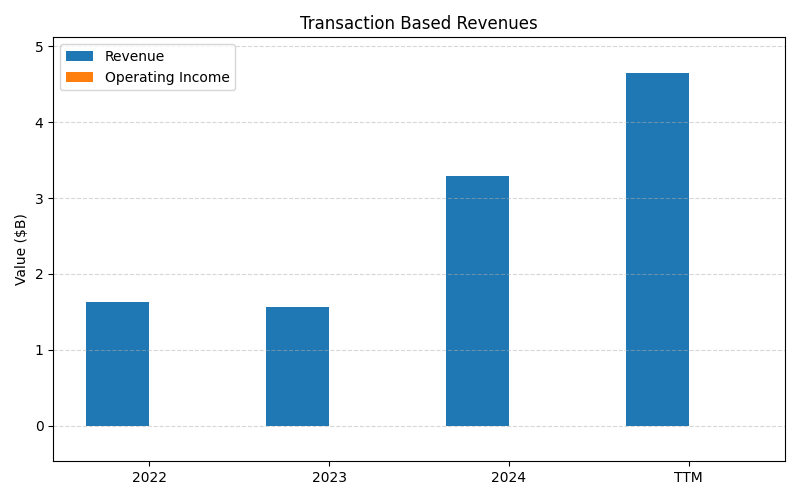
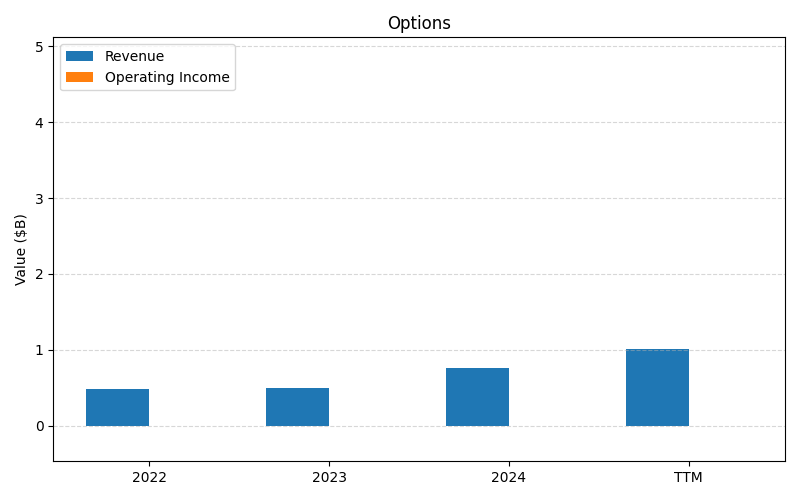
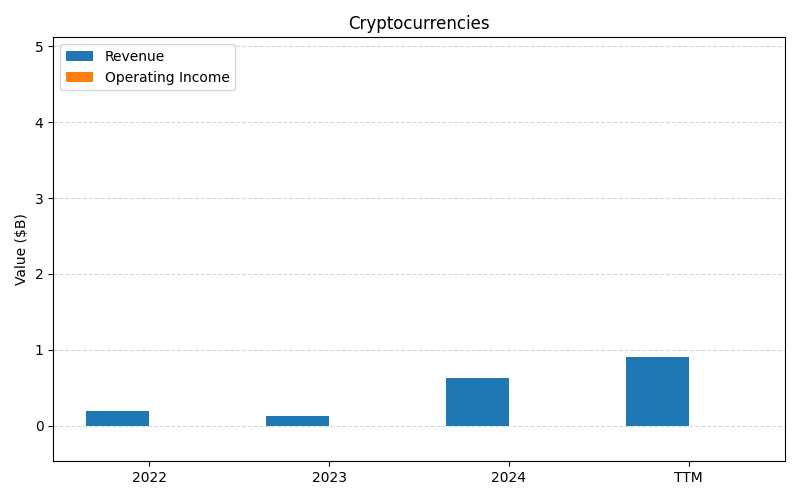
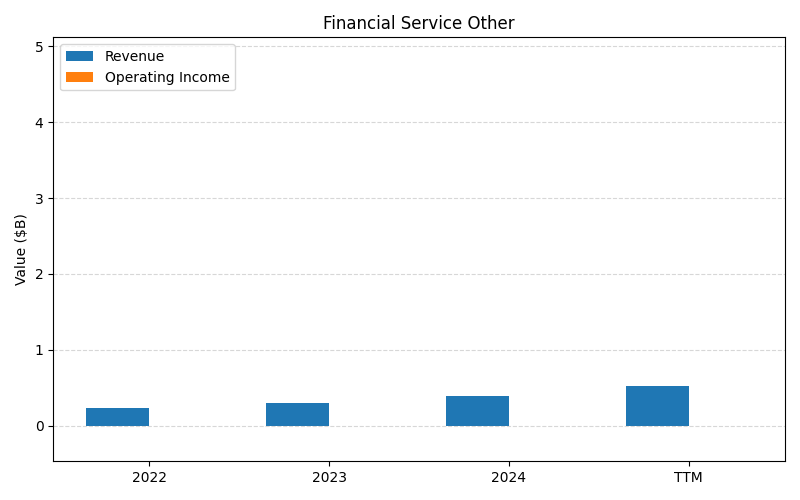
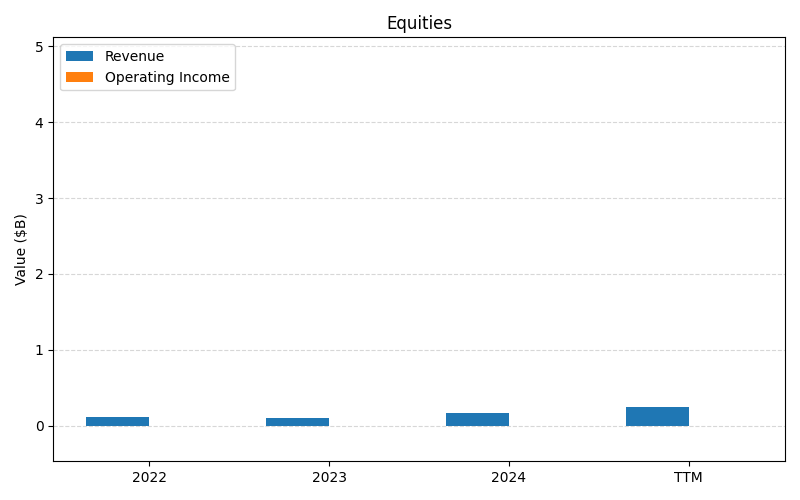
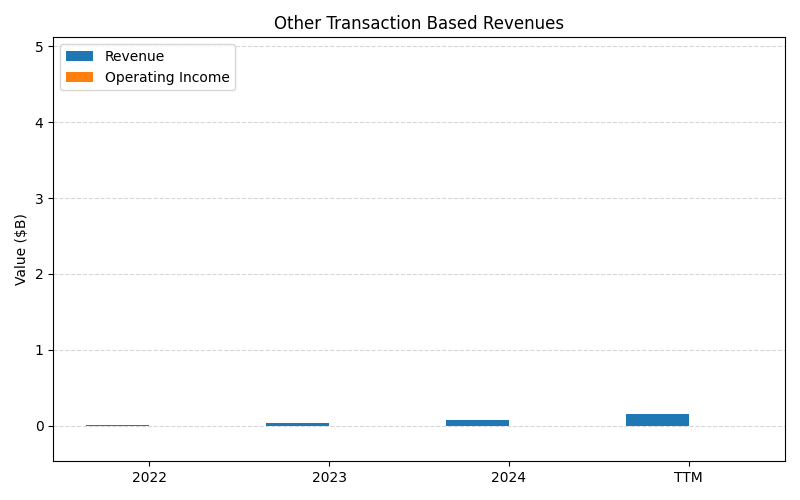
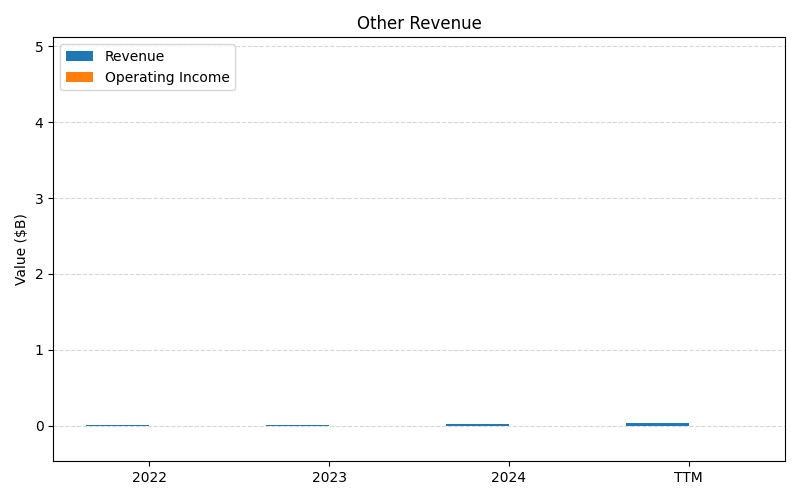
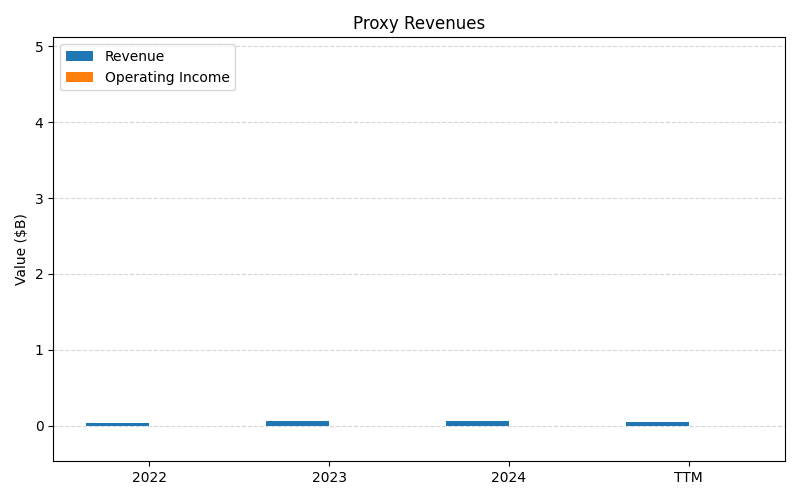
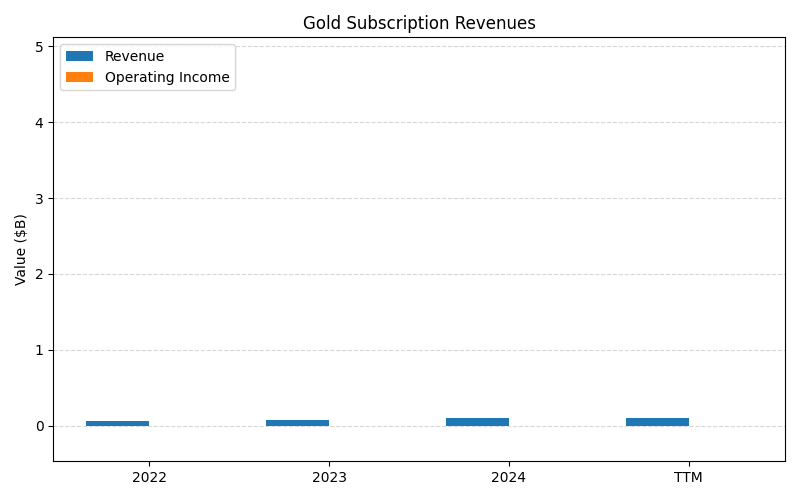
SEGMENTS v2025-09-09 · 2026-05-29 09:09 UTC — Units: $B. Rows list fiscal years (last 3 + TTM) with revenue for each segment; the final row shows the TTM revenue mix (operating income columns display “—” where mix is not applicable).
| Year | Transaction Based Revenues Rev | Options Rev | Cryptocurrencies Rev | Financial Service Other Rev | Equities Rev | Other Transaction Based Revenues Rev | Other Revenue Rev | Proxy Revenues Rev | Gold Subscription Revenues Rev | Total Rev |
|---|---|---|---|---|---|---|---|---|---|---|
| 2023 | 1.57B | 0.51B | 0.14B | 0.30B | 0.10B | 0.04B | 0.01B | 0.06B | 0.07B | 2.81B |
| 2024 | 3.29B | 0.76B | 0.63B | 0.39B | 0.18B | 0.08B | 0.03B | 0.06B | 0.11B | 5.53B |
| 2025 | 5.26B | 1.12B | 0.90B | 0.66B | 0.30B | 0.30B | 0.09B | 0.06B | 0.18B | 8.88B |
| TTM | 11.6B | 2.38B | 1.91B | 1.33B | 0.62B | 0.46B | 0.15B | 0.14B | – | 18.6B |
| % of Total (TTM) | 62.4% | 12.8% | 10.3% | 7.2% | 3.3% | 2.5% | 0.8% | 0.8% | – | 100% |
Balance Sheet
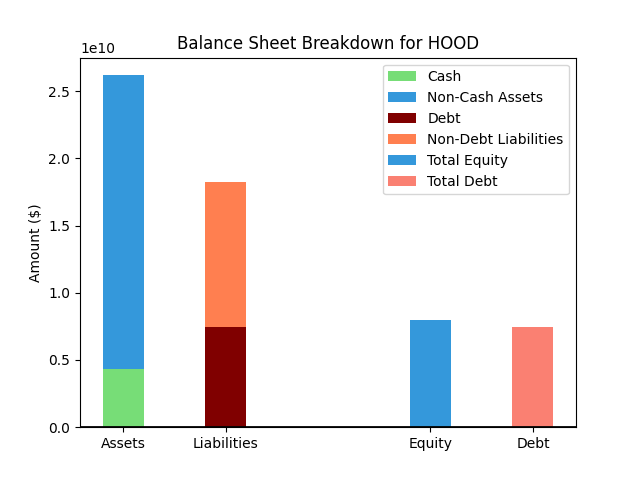
| Metric | Value | |
|---|---|---|
| 0 | Total Assets | $45,474M |
| 1 | Cash | $5,012M |
| 2 | Total Liabilities | $35,786M |
| 3 | Total Debt | $13,387M |
| 4 | Total Equity | $9,319M |
| 5 | Debt to Equity Ratio | 1.44 |
EPS & Dividend

Valuation
| Share Price | Treasury Yield | Estimates | Fair Value (P/E) | Fair Value (P/S) | Current P/S | Current P/E |
|---|---|---|---|---|---|---|
| $94.30 | 4.5% | Nicks Growth: 20% Nick's Expected Margin: 10% FINVIZ Growth: 14% |
Nicks: 42 Finviz: 25 |
Nick's: 4.242 | 18.4 | 45.8 |
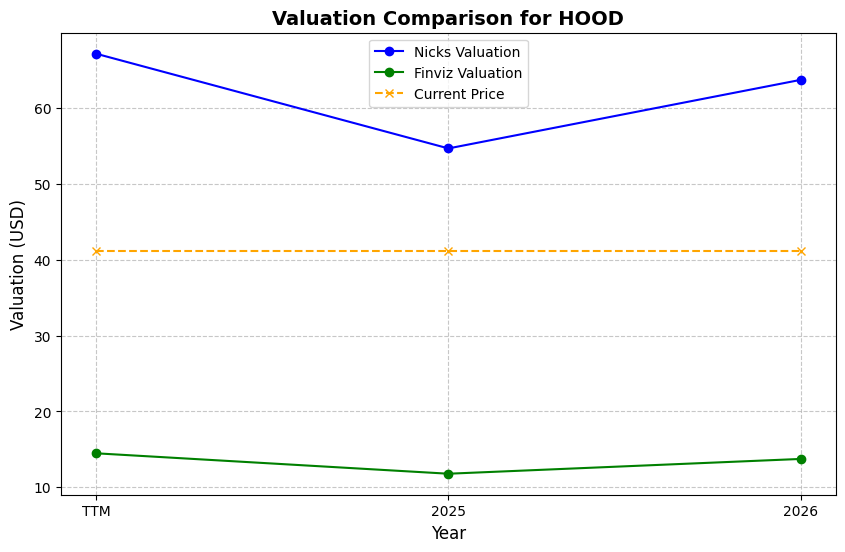
| Basis | Year | Nicks Valuation | Nicks vs Share Price | Finviz Valuation | Finviz vs Share Price |
|---|---|---|---|---|---|
| $2.06 EPS | TTM | $87.39 | -7.3% | $51.04 | -45.9% |
| $1.88 EPS | 2026 | $79.76 | -15.4% | $46.58 | -50.6% |
| $2.50 EPS | 2027 | $105.99 | 12.4% | $61.90 | -34.4% |
Implied Growth
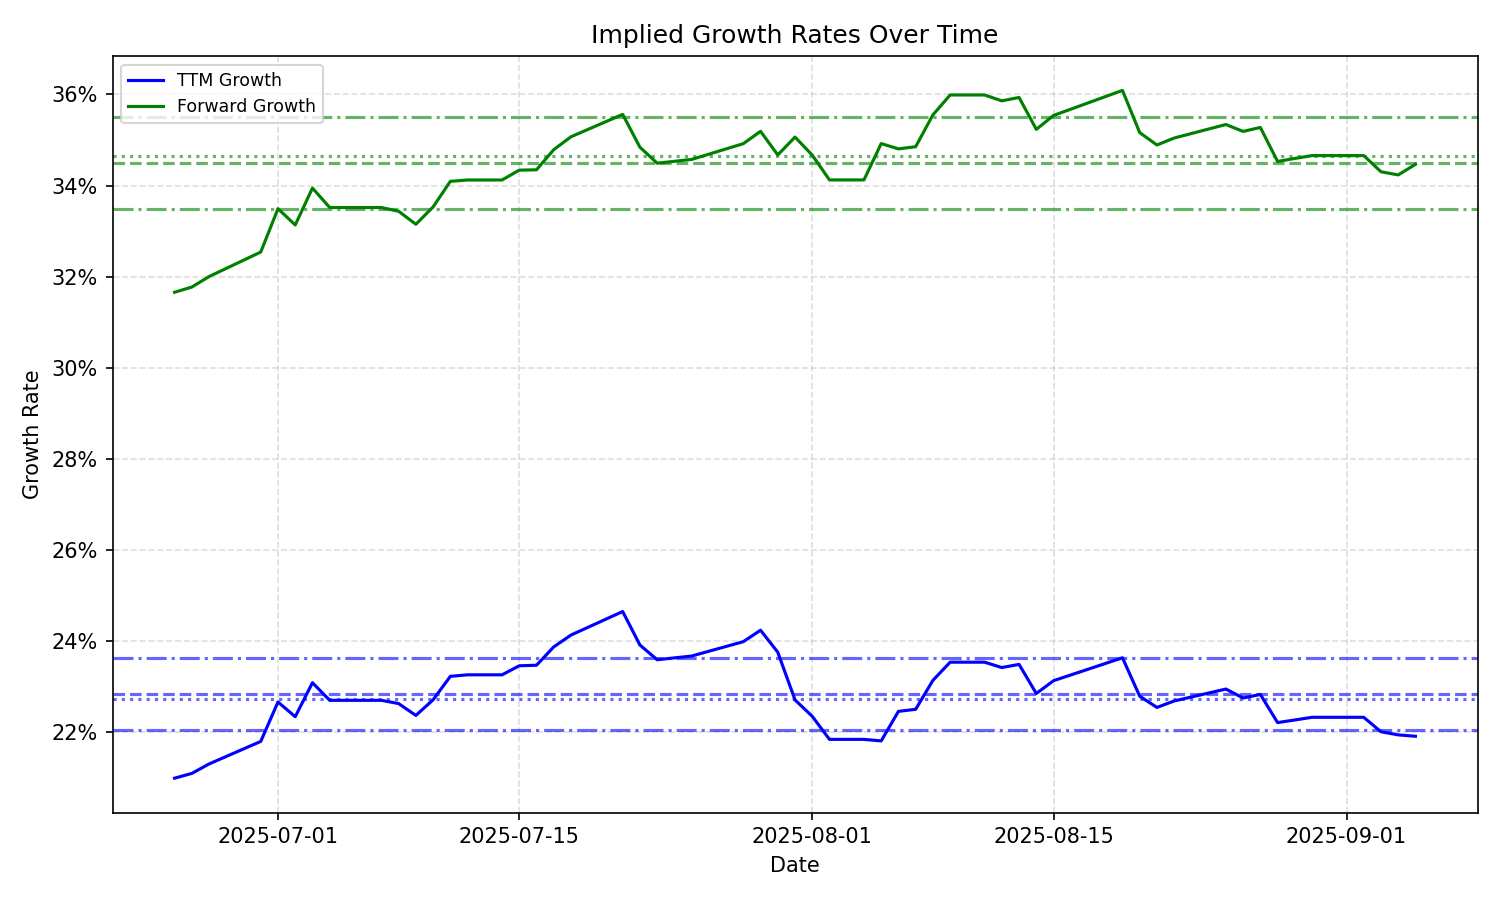
| Average | Median | Std Dev | Current | Percentile | ||||||
|---|---|---|---|---|---|---|---|---|---|---|
| TTM | Forward | TTM | Forward | TTM | Forward | TTM | Forward | TTM | Forward | |
| Timeframe | ||||||||||
| 1 Year | 21.36% | 27.08% | 21.79% | 33.52% | 2.63% | 9.97% | 19.66% | 16.47% | 31.0% | 29.8% |
| 3 Years | 21.36% | 27.08% | 21.79% | 33.52% | 2.63% | 9.97% | 19.66% | 16.47% | 31.0% | 29.8% |
| 5 Years | 21.36% | 27.08% | 21.79% | 33.52% | 2.63% | 9.97% | 19.66% | 16.47% | 31.0% | 29.8% |
| 10 Years | 21.36% | 27.08% | 21.79% | 33.52% | 2.63% | 9.97% | 19.66% | 16.47% | 31.0% | 29.8% |