Home Depot, Inc. (The) — HD
| Close Price | Market Cap | P/E Ratio | Forward P/E Ratio | Implied Growth* | Implied Forward Growth* | Dividend | P/B Ratio |
|---|---|---|---|---|---|---|---|
| $317.14 | $316.23B | 22.5 | 19.7 | 12.9% | 11.5% | $9.32 2.9% | 22.8 |
Latest Headlines
- · Home Depot Tests On Site Car Key Service To Deepen Store Relationships
- · 2 Mega-Cap Stocks on Our Buy List and 1 We Find Risky
- · Which retail giant — Walmart, Costco, or Best Buy — is built to win 2026?
- · Home Depot Stock: Is HD Underperforming the Consumer Discretionary Sector?
- · Jim Cramer Discusses Home Depot (HD) Stock
- · Carysil Ltd (BOM:524091) Q4 2026 Earnings Call Highlights: Strong Growth Amidst Global Challenges
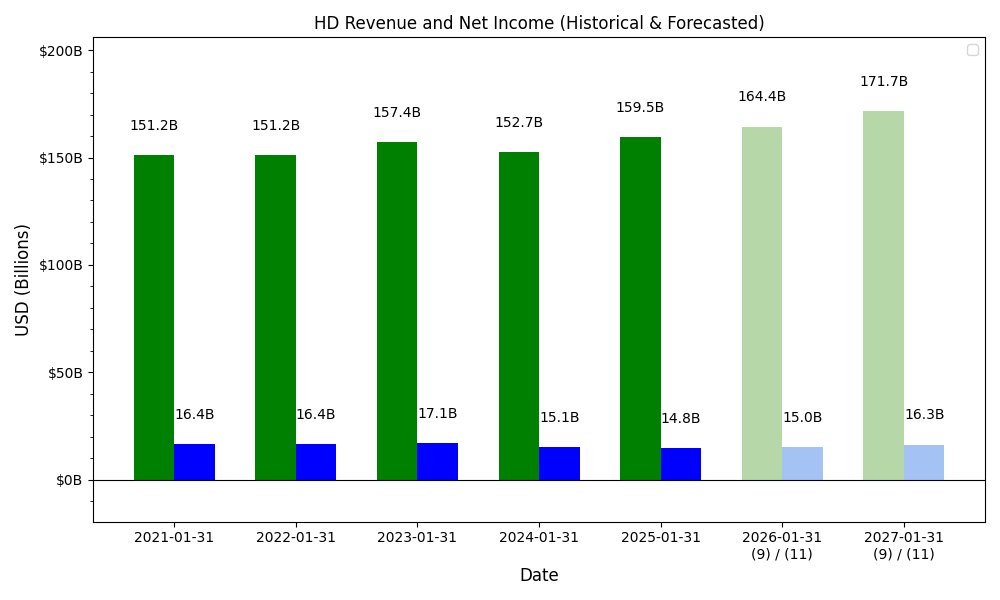
Revenue & Net Income

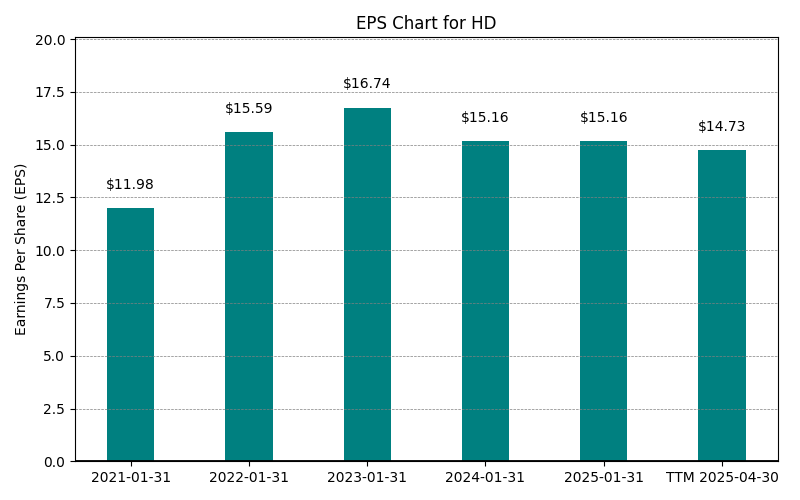
| Date | Revenue | Net_Income | EPS | Last_Updated | Revenue_Change | Net_Income_Change | EPS_Change | |
|---|---|---|---|---|---|---|---|---|
| 0 | 2021-01-31 | $151,157M | $16,433M | $11.98 | 2025-05-19 00:11:27 | N/A | N/A | N/A |
| 1 | 2022-01-31 | $151,157M | $16,433M | $16.74 | 2026-03-30 13:18:49 | 0.0% | 0.0% | 39.7% |
| 2 | 2023-01-31 | $157,403M | $17,105M | $16.74 | 2026-05-29 09:09:19 | 4.1% | 4.1% | 0.0% |
| 3 | 2024-01-31 | $152,669M | $15,143M | $15.16 | 2026-05-29 09:09:19 | -3.0% | -11.5% | -9.4% |
| 4 | 2025-01-31 | $159,514M | $14,806M | $14.96 | 2026-05-29 09:09:19 | 4.5% | -2.2% | -1.3% |
| 5 | 2026-01-31 | $164,683M | $14,156M | $14.26 | 2026-05-29 09:09:19 | 3.2% | -4.4% | -4.7% |
| 6 | TTM 2026-04-30 | $166,592M | $14,012M | $14.07 | 2026-05-21 09:08:34 | 1.2% | -1.0% | -1.3% |
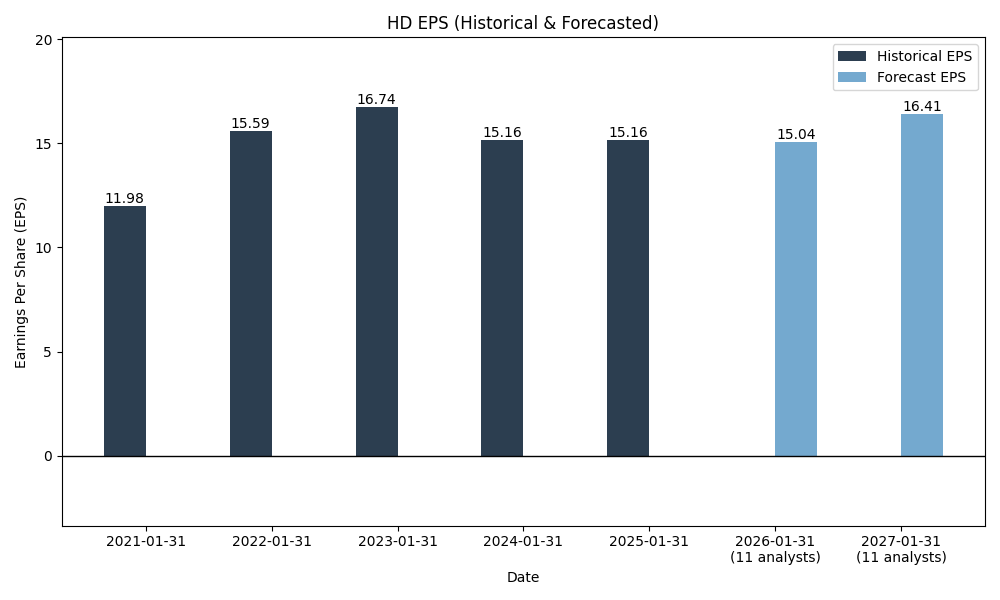
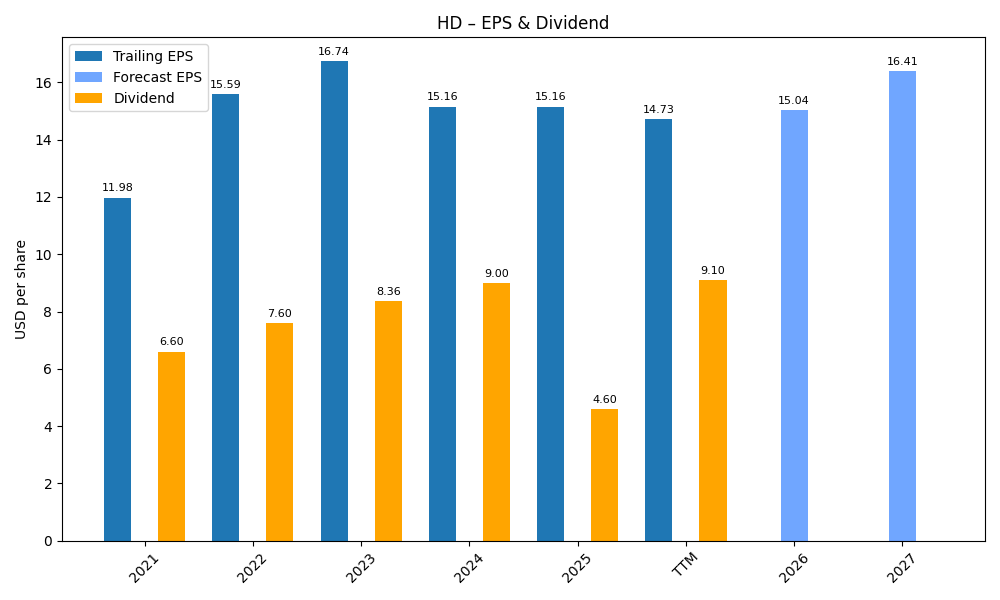
EPS
Forecasts
Y/Y % Change
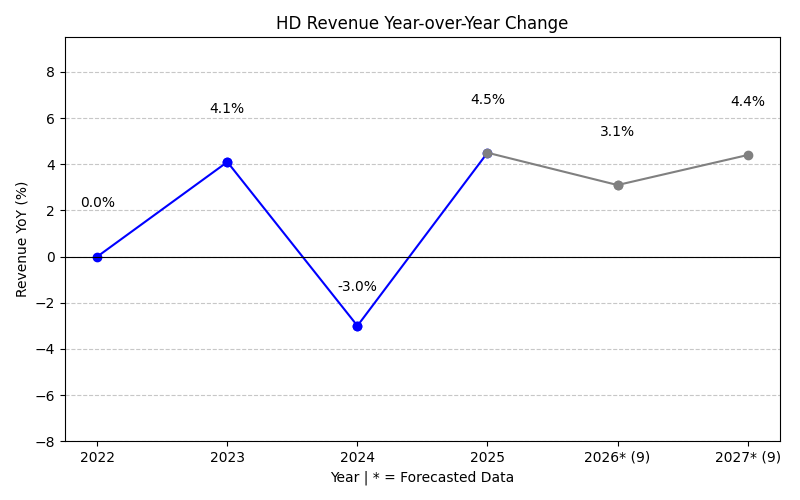
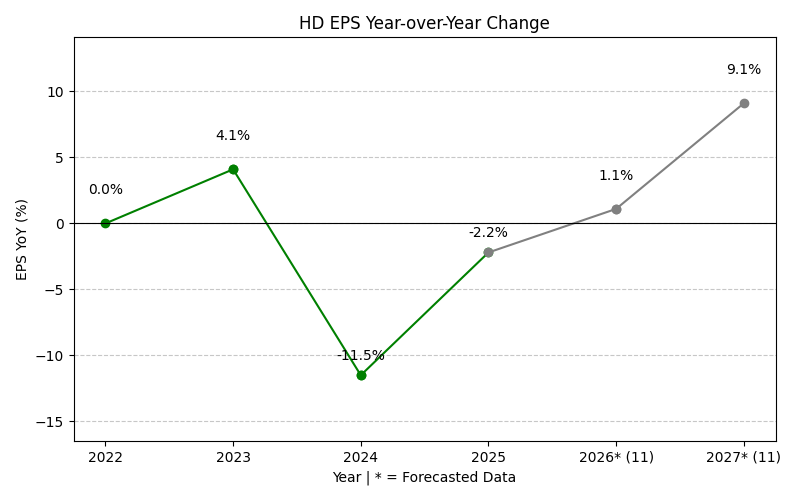
HD Year-over-Year Growth
| 2021 | 2022 | 2023 | 2024 | 2025 | 2026 | 2027 | 2028 | Average | |
|---|---|---|---|---|---|---|---|---|---|
| Revenue Growth (%) | 0.0% | 4.1% | -3.0% | 4.5% | 3.2% | 3.8% | 3.8% | 2.3% | |
| Revenue Analysts (#) | 0 | 0 | 0 | 0 | 0 | 0 | 32 | 32 | |
| EPS Growth (%) | 0.0% | 4.1% | -11.5% | -2.2% | -4.4% | 5.4% | 7.6% | -0.1% | |
| EPS Analysts (#) | 0 | 0 | 0 | 0 | 0 | 0 | 34 | 34 |
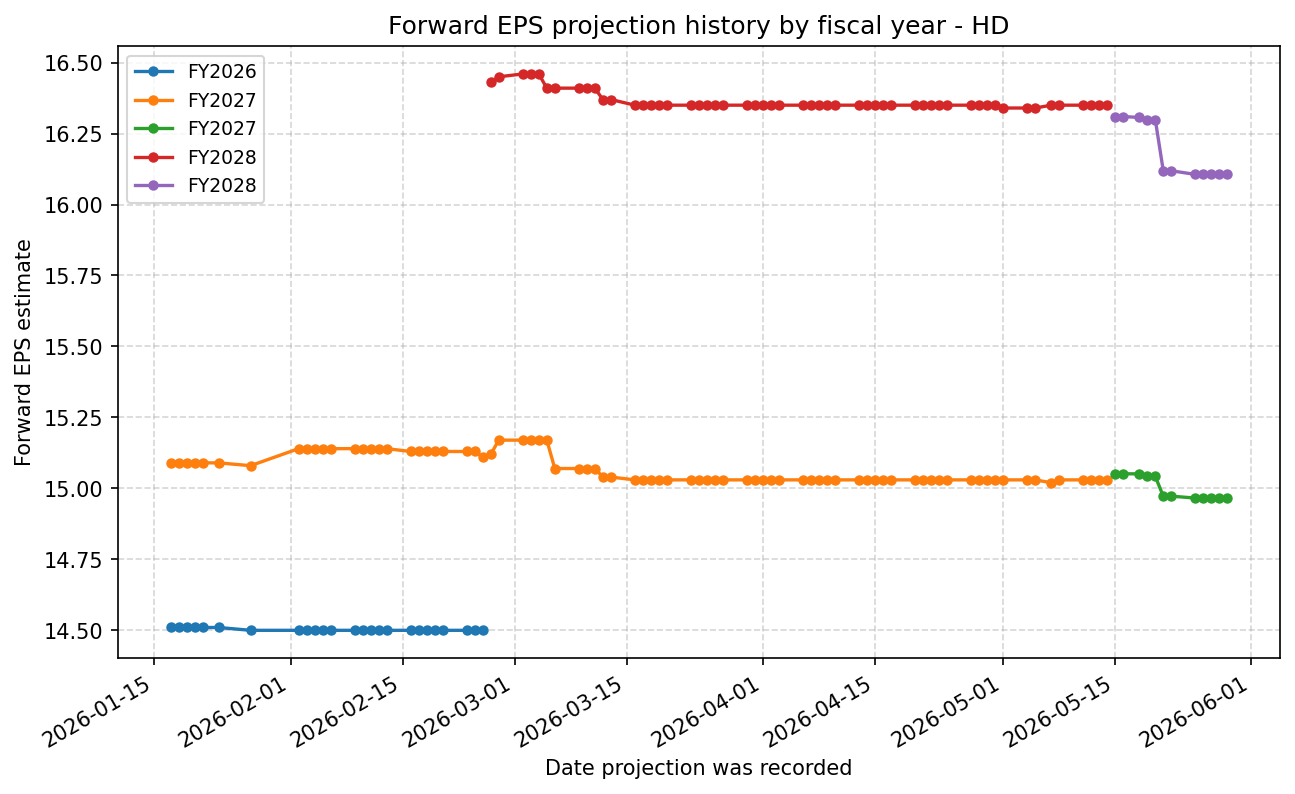
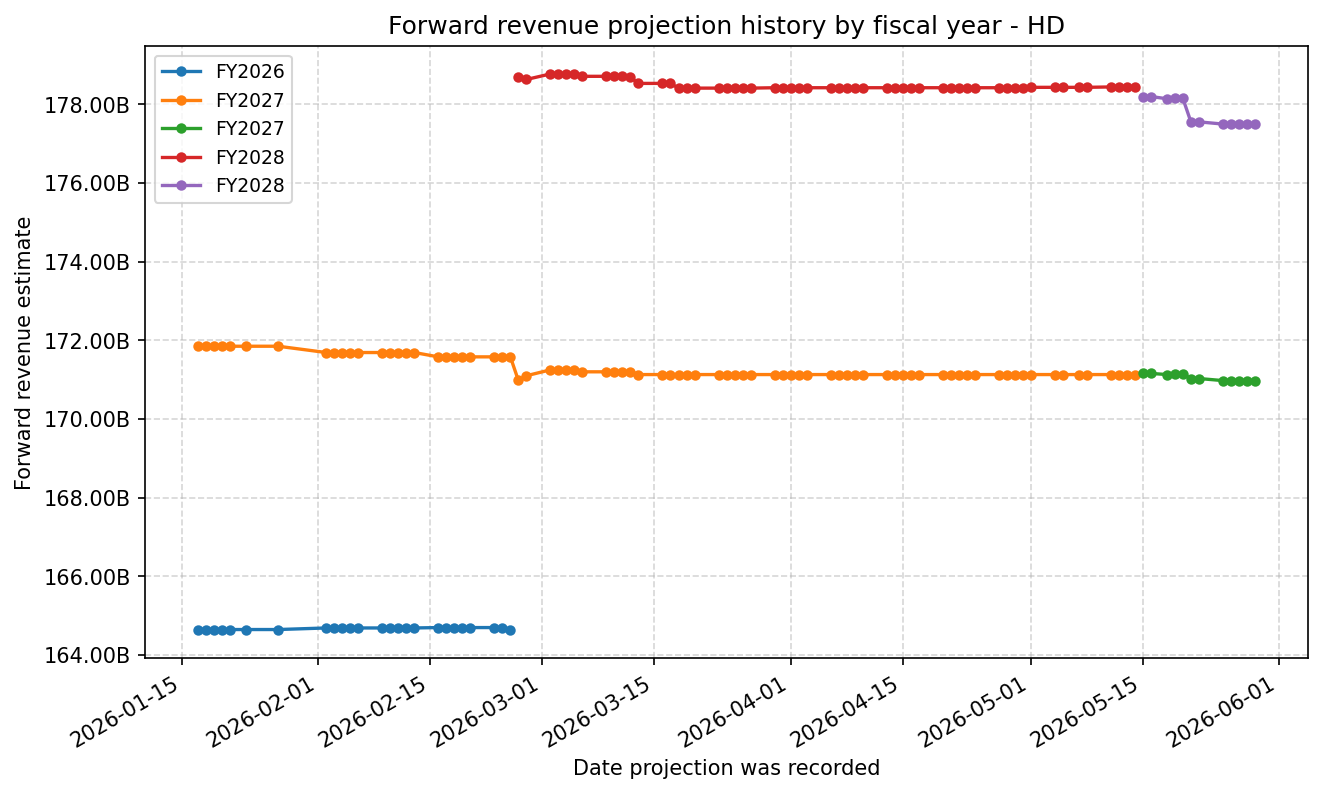
Forward Estimate History
How the next-FY EPS and revenue estimates have drifted over time. One line per fiscal year – past lines end when that FY became current.
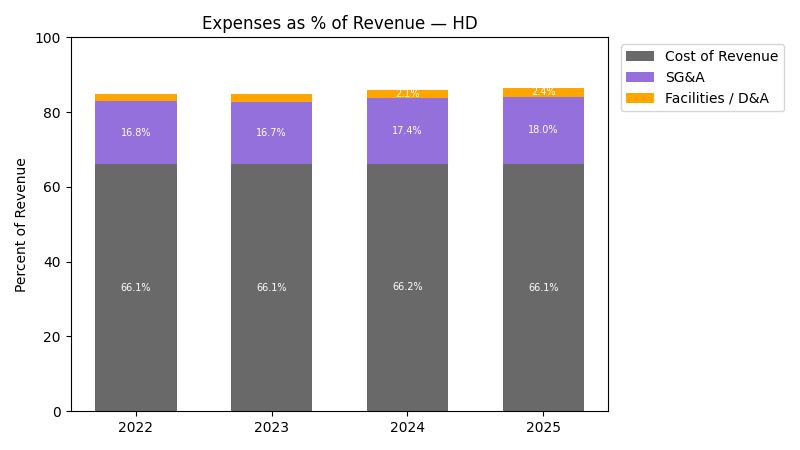
Expenses
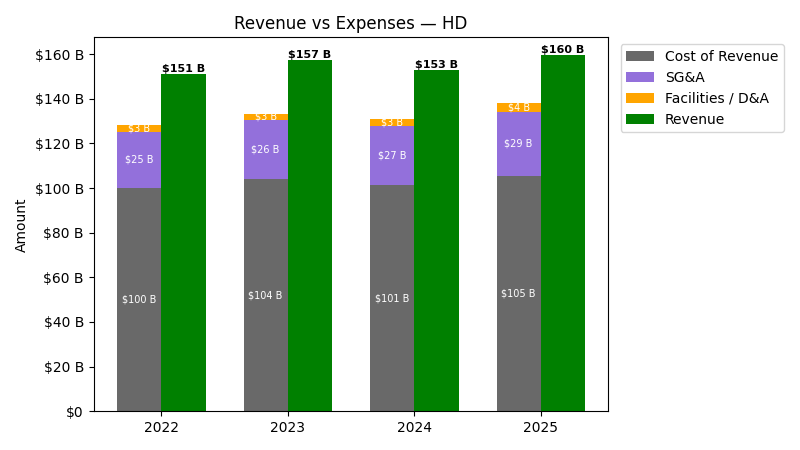
| Year | Revenue ($) | Cost of Revenue ($) | SG&A ($) | Facilities / D&A ($) |
|---|---|---|---|---|
| 2023 | $157.4B | $101.1B | $26.3B | $3.0B |
| 2024 | $152.7B | $97.9B | $26.6B | $3.2B |
| 2025 | $159.5B | $101.7B | $28.7B | $3.8B |
| 2026 | $164.7B | $104.8B | $30.7B | $4.1B |
| Year | Revenue Change (%) | Cost of Revenue Change (%) | SG&A Change (%) | Facilities / D&A Change (%) |
|---|---|---|---|---|
| 2024 | -3.01 | -3.21 | 1.19 | 9.14 |
| 2025 | 4.48 | 3.91 | 8.08 | 15.83 |
| 2026 | 3.24 | 3.08 | 6.80 | 9.57 |
No unmapped expenses.
Segment Performance
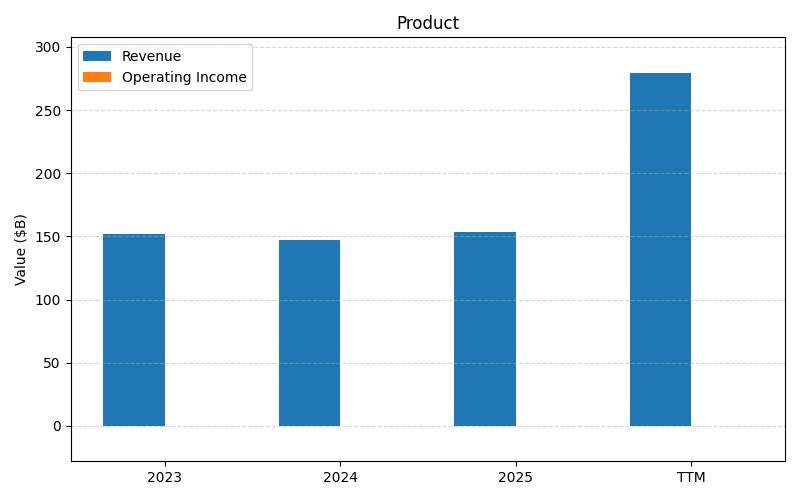
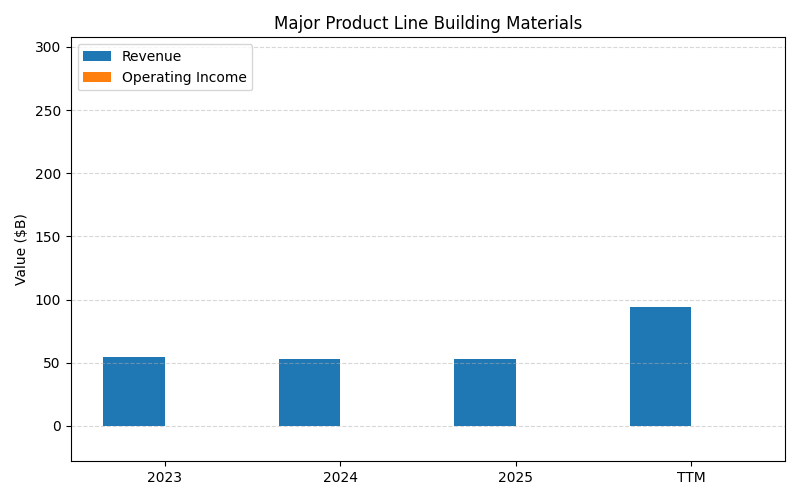
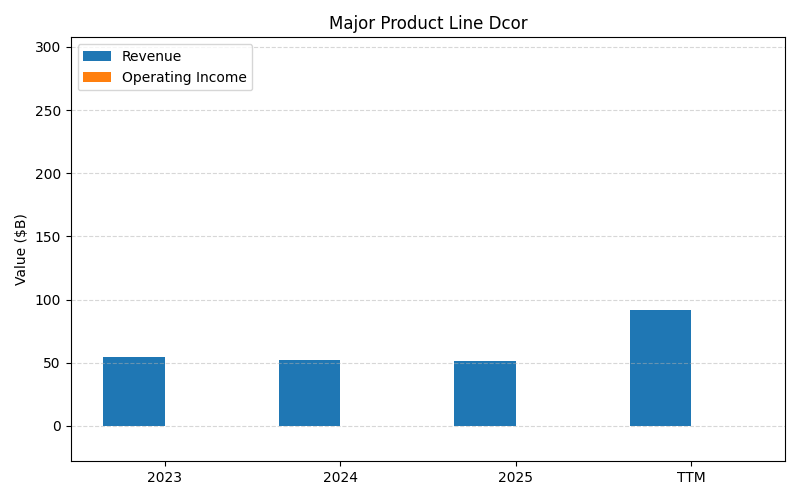
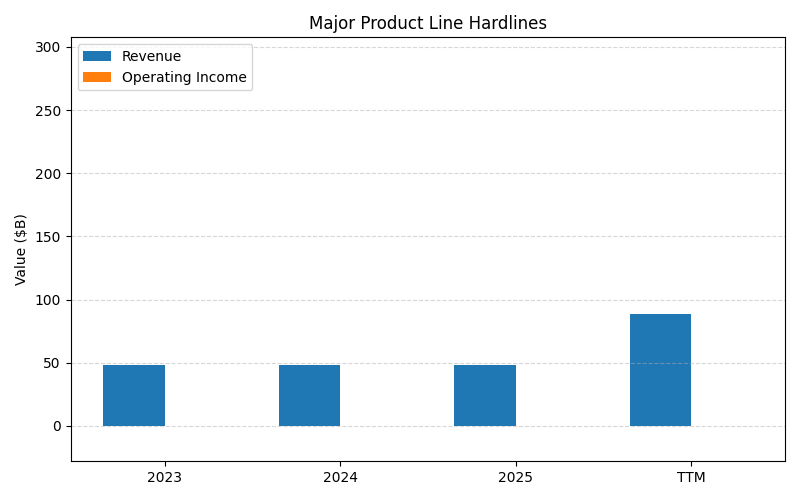
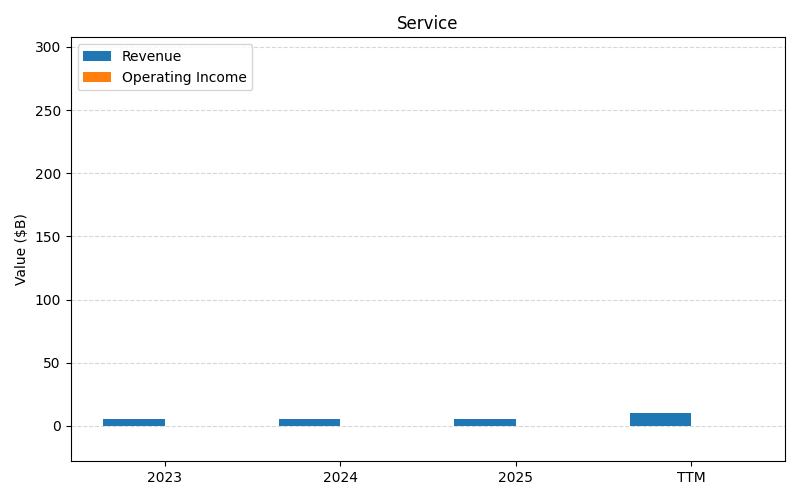
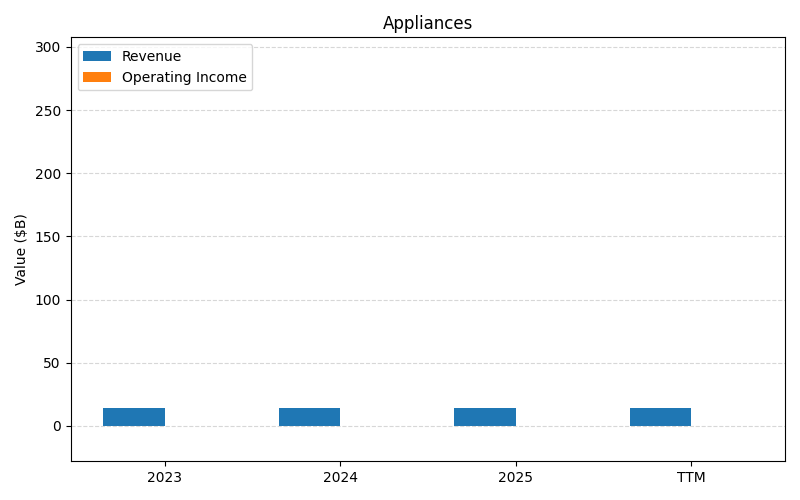
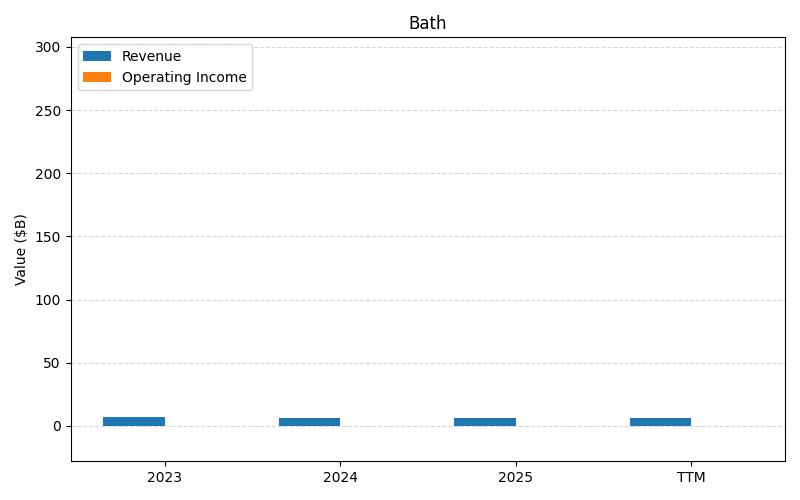
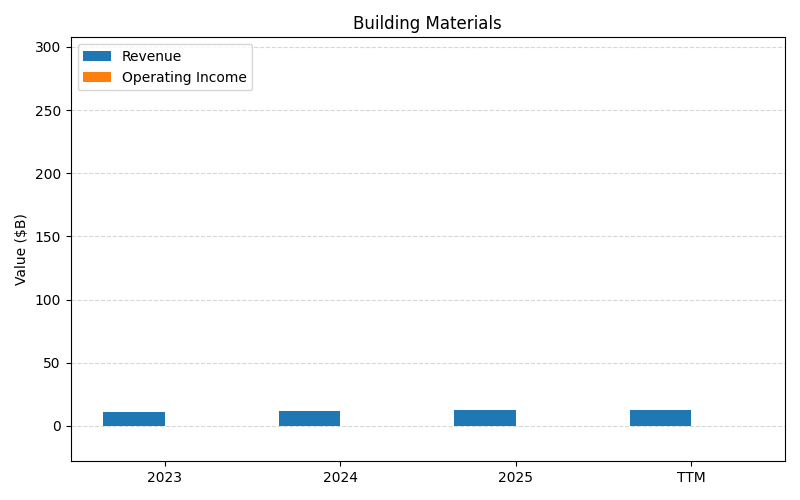
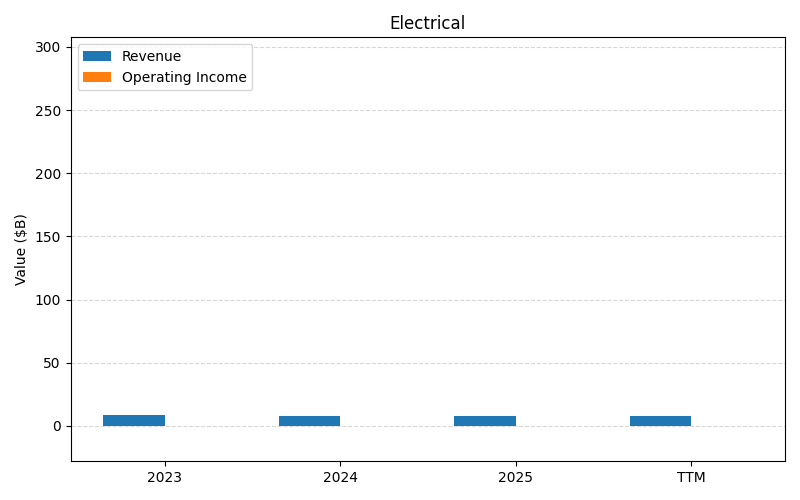
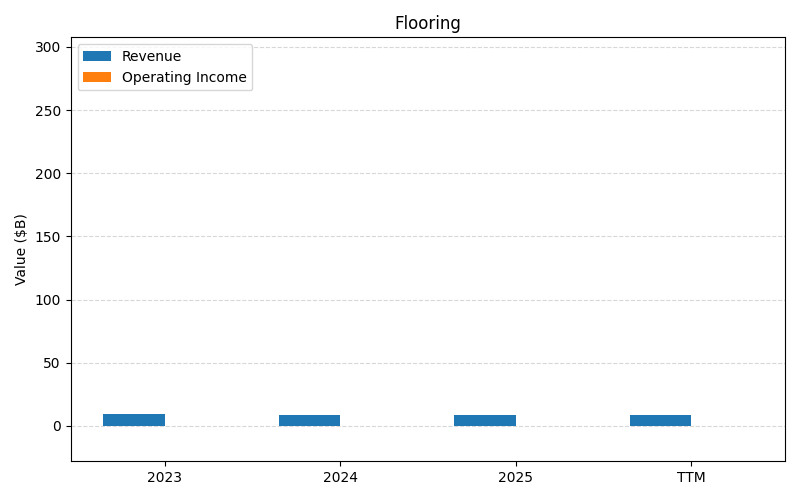

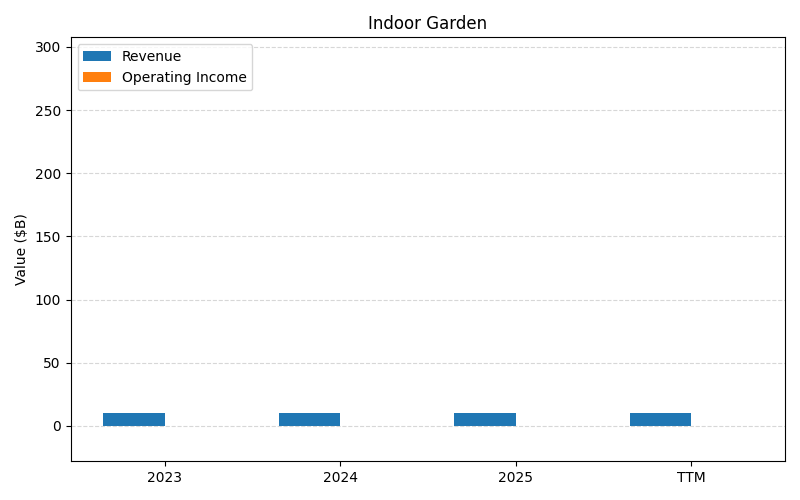
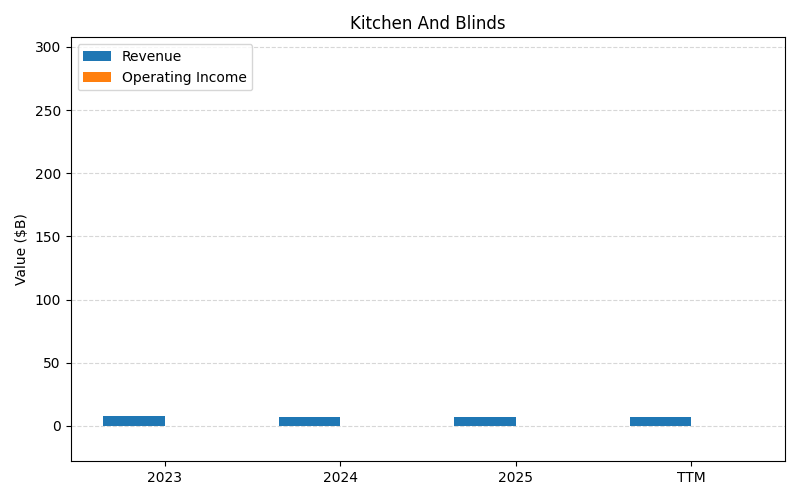

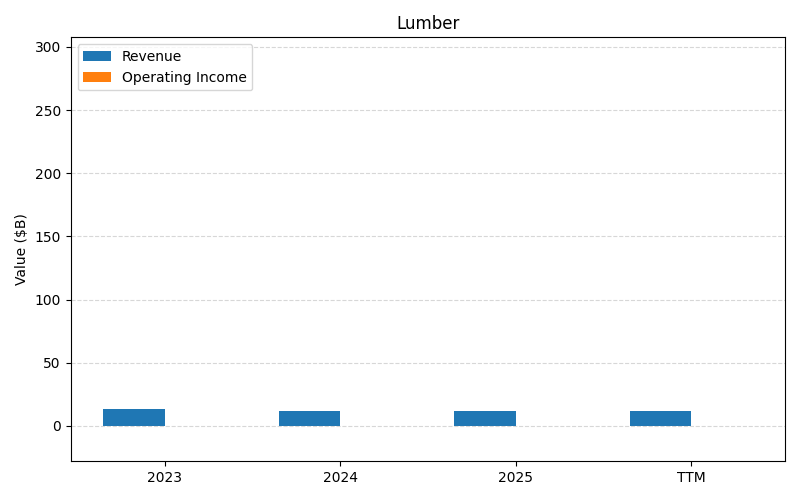


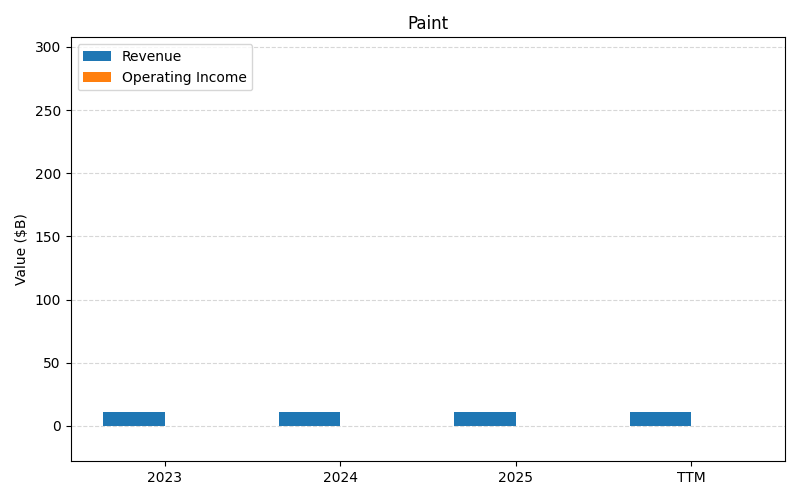
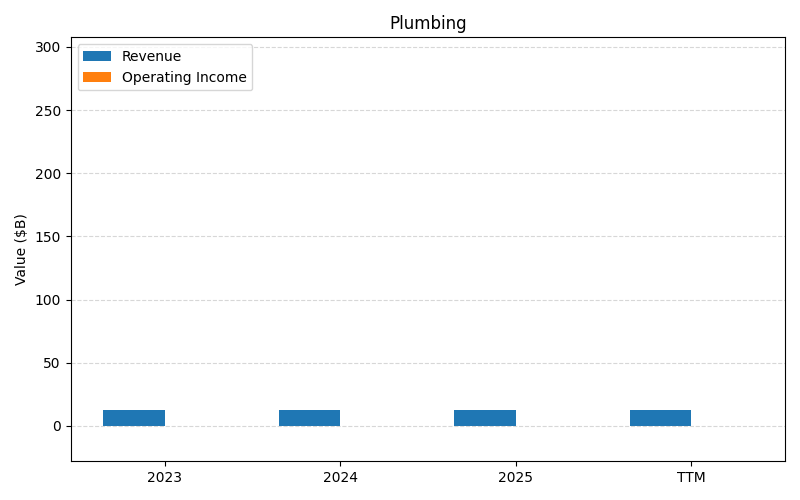
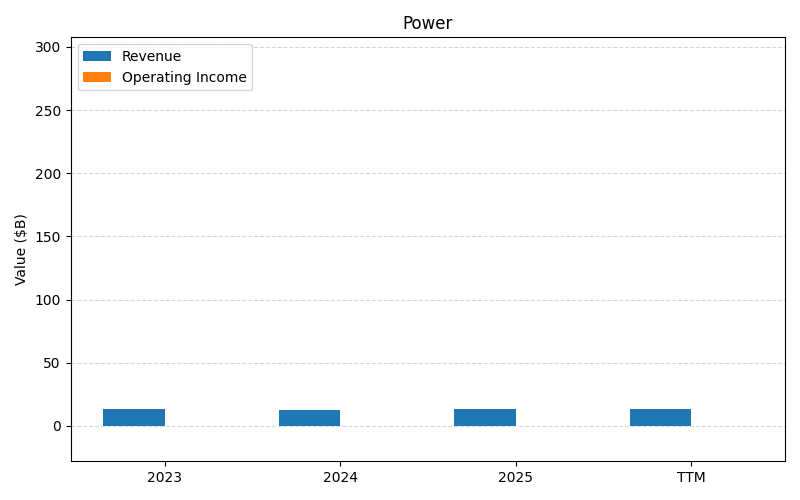
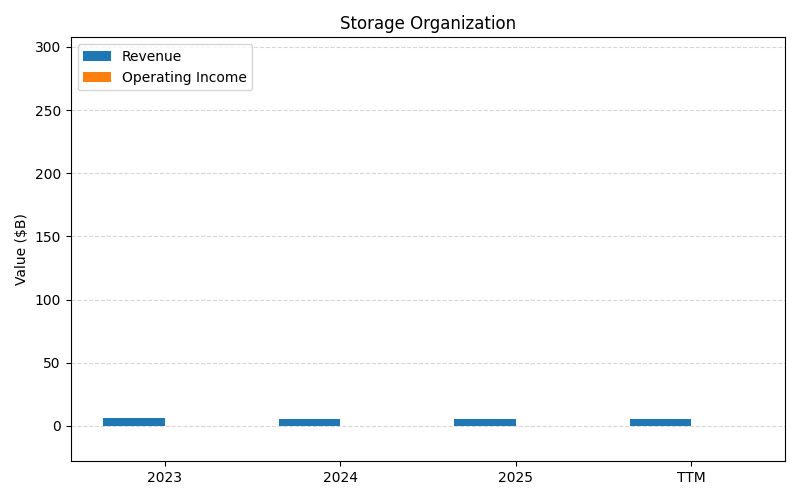
SEGMENTS v2025-09-09 · 2026-05-29 09:09 UTC — Units: $B. Rows list fiscal years (last 3 + TTM) with revenue for each segment; the final row shows the TTM revenue mix (operating income columns display “—” where mix is not applicable).
| Year | Prod Rev | Major Product Line Building Materials Rev | Major Product Line Dcor Rev | Major Product Line Hardlines Rev | Services Rev | Appliances Rev | Bath Rev | Building Materials Rev | Electrical Rev | Flooring Rev | Hardware Rev | Indoor Garden Rev | Kitchen And Blinds Rev | Lighting Rev | Lumber Rev | Millwork Rev | Outdoor Garden Rev | Paint Rev | Plumbing Rev | Power Rev | Storage Organization Rev | Total Rev |
|---|---|---|---|---|---|---|---|---|---|---|---|---|---|---|---|---|---|---|---|---|---|---|
| 2024 | 146.8B | 52.6B | 52.8B | 47.3B | 5.83B | 13.9B | 6.58B | 12.1B | 7.99B | 8.70B | 8.96B | 10.3B | 8.00B | 4.55B | 11.7B | 8.46B | 10.4B | 11B | 12.3B | 12.8B | 4.88B | 458B |
| 2025 | 153.7B | 52.9B | 52.5B | 47.7B | 5.84B | 14.1B | 6.46B | 12.4B | 7.88B | 8.69B | 8.98B | 10.3B | 7.89B | 4.22B | 11.8B | 8.33B | 10.3B | 11.2B | 12.5B | 13.2B | 4.90B | 465.7B |
| 2026 | 159B | 52.4B | 51.7B | 47.8B | 5.65B | 14B | 6.50B | 12.4B | 8.01B | 8.23B | 8.98B | 10.2B | 7.98B | 4.01B | 11.4B | 8.19B | 10.5B | 11B | 12.5B | 13.2B | 5.05B | 468.6B |
| TTM | 391.7B | 131.2B | 129.3B | 119.6B | 14.2B | – | – | – | – | – | – | – | – | – | – | – | – | – | – | – | – | 785.9B |
| % of Total (TTM) | 49.8% | 16.7% | 16.4% | 15.2% | 1.8% | – | – | – | – | – | – | – | – | – | – | – | – | – | – | – | – | 100% |
Segment Performance (Axis 2)
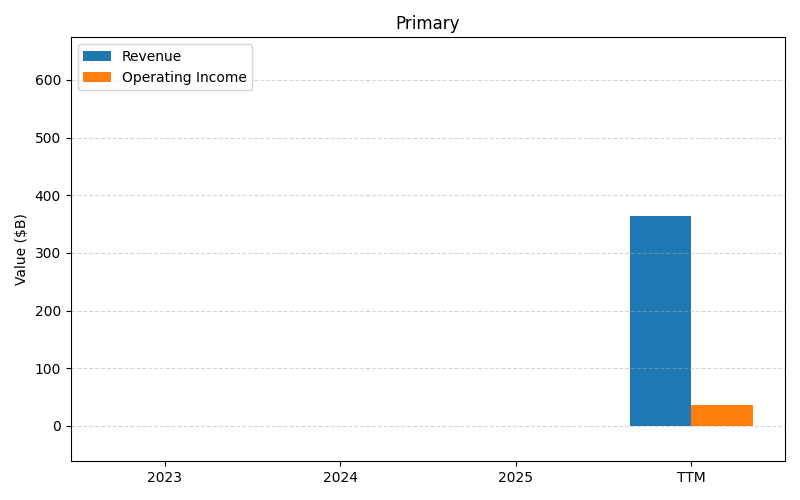
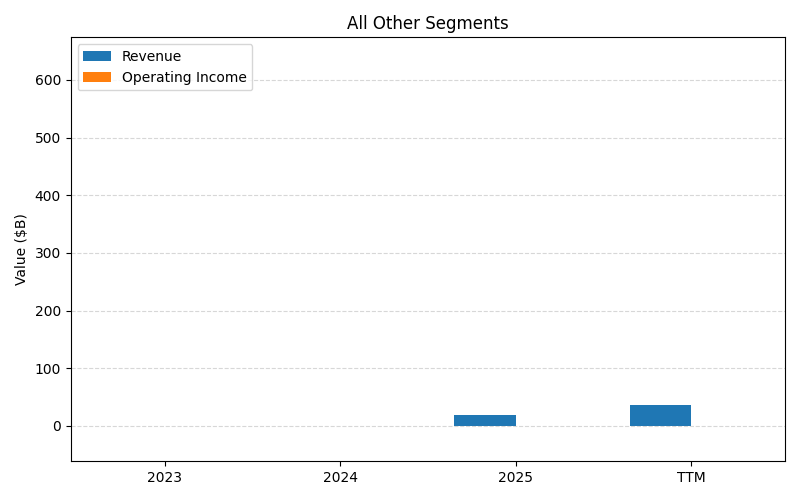
SEGMENTS v2025-09-09 · 2026-05-29 09:09 UTC — Units: $T. Rows list fiscal years (last 3 + TTM) with revenue and operating income for each segment; the final row shows the TTM revenue mix (operating income columns display “—” where mix is not applicable).
| Year | Primary Rev | Primary OI | All Other Segments Rev | All Other Segments OI | Total Rev | Total OI |
|---|---|---|---|---|---|---|
| 2024 | 0.46T | 0.02T | – | – | 0.46T | 0.02T |
| 2025 | 0.61T | 0.04T | 0.02T | 0.00T | 0.63T | 0.04T |
| 2026 | 0.61T | 0.04T | 0.04T | 0.00T | 0.65T | 0.04T |
| TTM | 1.45T | 0.10T | 0.07T | 0.00T | 1.52T | 0.10T |
| % of Total (TTM) | 95.3% | — | 4.7% | — | 100% | — |
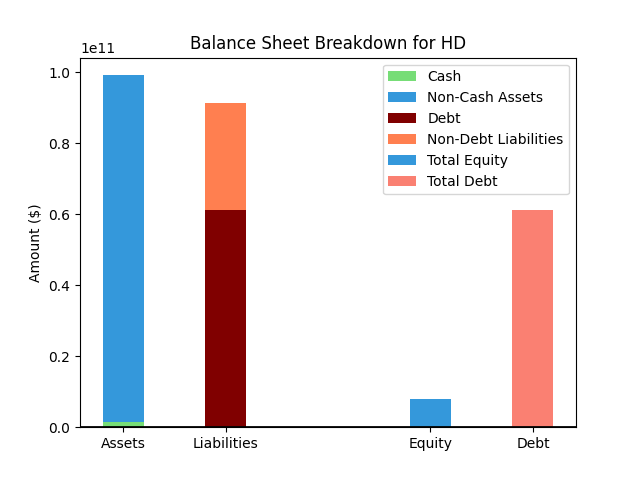
Balance Sheet
| Metric | Value | |
|---|---|---|
| 0 | Total Assets | $105,095M |
| 1 | Cash | $1,389M |
| 2 | Total Liabilities | $92,282M |
| 3 | Total Debt | $65,350M |
| 4 | Total Equity | $12,813M |
| 5 | Debt to Equity Ratio | 5.10 |
EPS & Dividend
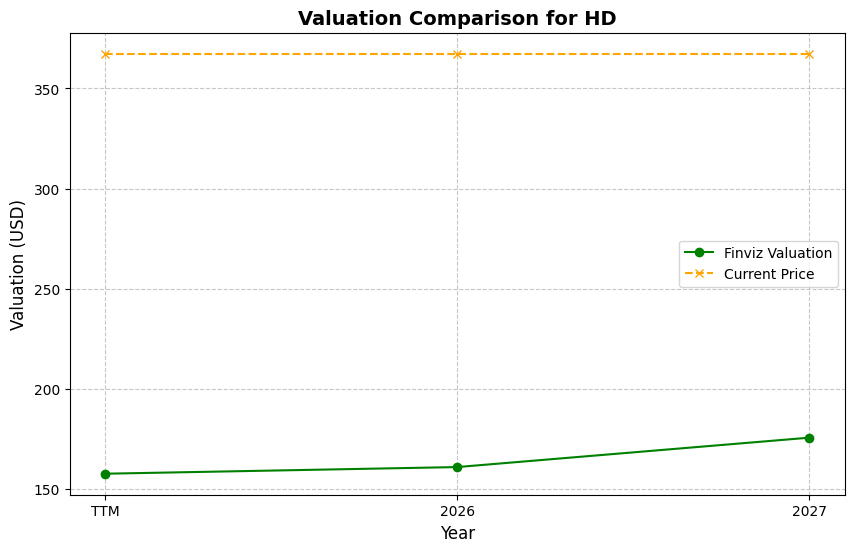
Valuation
| Share Price | Treasury Yield | Estimates | Fair Value (P/E) | Fair Value (P/S) | Current P/S | Current P/E |
|---|---|---|---|---|---|---|
| $317.14 | 4.5% | FINVIZ Growth: 6% | Nicks: 6 Finviz: 12 |
Nick's: 0.000 | 1.9 | 22.5 |
| Basis | Year | Nicks Valuation | Nicks vs Share Price | Finviz Valuation | Finviz vs Share Price |
|---|---|---|---|---|---|
| $14.07 EPS | TTM | $89.22 | -71.9% | $165.83 | -47.7% |
| $14.97 EPS | 2027 | $94.90 | -70.1% | $176.39 | -44.4% |
| $16.11 EPS | 2028 | $102.13 | -67.8% | $189.83 | -40.1% |
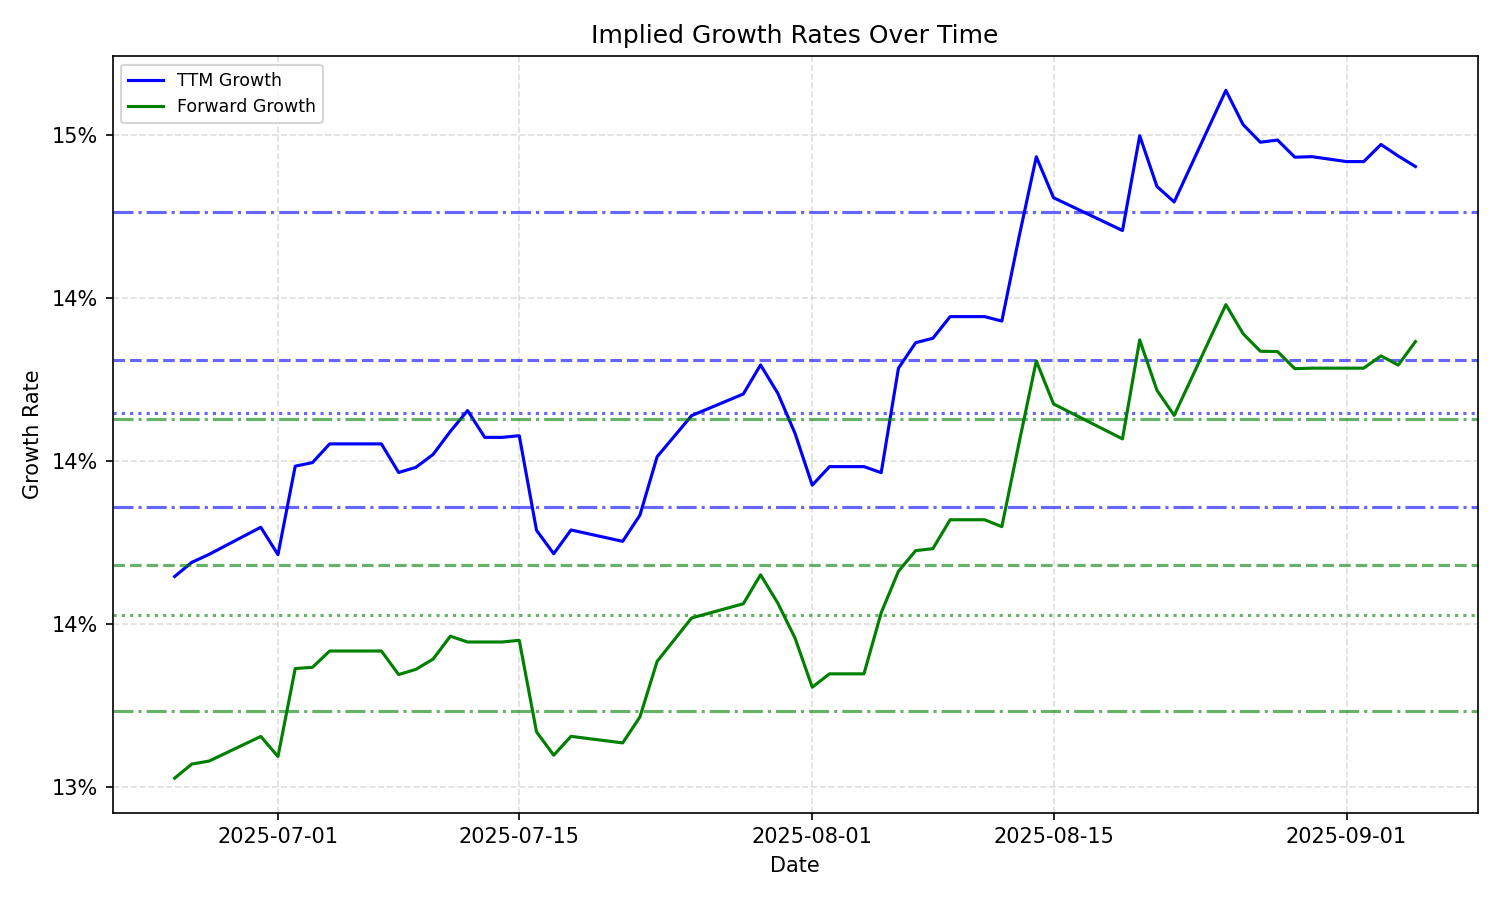
Implied Growth
| Average | Median | Std Dev | Current | Percentile | ||||||
|---|---|---|---|---|---|---|---|---|---|---|
| TTM | Forward | TTM | Forward | TTM | Forward | TTM | Forward | TTM | Forward | |
| Timeframe | ||||||||||
| 1 Year | 13.86% | 13.04% | 13.98% | 13.28% | 0.73% | 1.01% | 13.06% | 11.60% | 15.0% | 12.9% |
| 3 Years | 13.86% | 13.04% | 13.98% | 13.28% | 0.73% | 1.01% | 13.06% | 11.60% | 15.0% | 12.9% |
| 5 Years | 13.86% | 13.04% | 13.98% | 13.28% | 0.73% | 1.01% | 13.06% | 11.60% | 15.0% | 12.9% |
| 10 Years | 13.86% | 13.04% | 13.98% | 13.28% | 0.73% | 1.01% | 13.06% | 11.60% | 15.0% | 12.9% |