Good Times Restaurants Inc. — GTIM
| Close Price | Market Cap | P/E Ratio | Forward P/E Ratio | Implied Growth* | Implied Forward Growth* | Dividend | P/B Ratio |
|---|---|---|---|---|---|---|---|
| $1.29 | $13.62M | 7.6 | 64.5 | 1.7% | 24.9% | - | 0.4 |
Latest Headlines
- · GTIM Stock Down Post Q2 Earnings, Same-Store Sales Drop
- · Good Times (GTIM) Q2 2026 Earnings Transcript
- · Good Times Restaurants Reports Results for the Fiscal 2026 Second Quarter Ended March 31, 2026
- · Good Times Restaurants to Release Results on May 7, 2026 for the Fiscal 2026 Second Quarter Ended March 31, 2026
- · RAVE Slips 23.1% in 3 Months: Should You Still Hold the Stock or Sell?
- · Flanigan's Gains 22.5% in Three Months: How to Play the Stock?
Revenue & Net Income
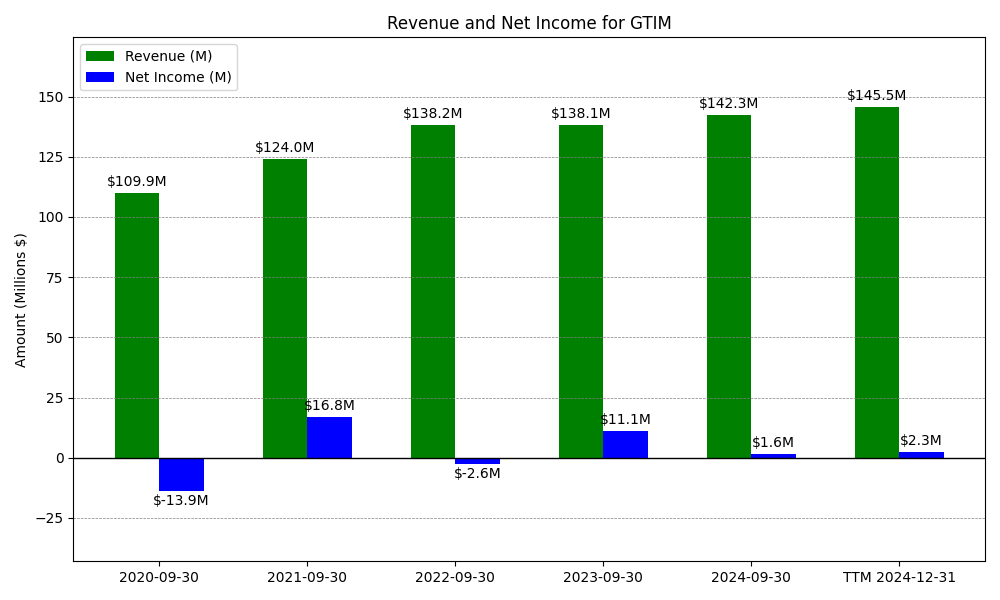
| Date | Revenue | Net_Income | EPS | Last_Updated | Revenue_Change | Net_Income_Change | EPS_Change | |
|---|---|---|---|---|---|---|---|---|
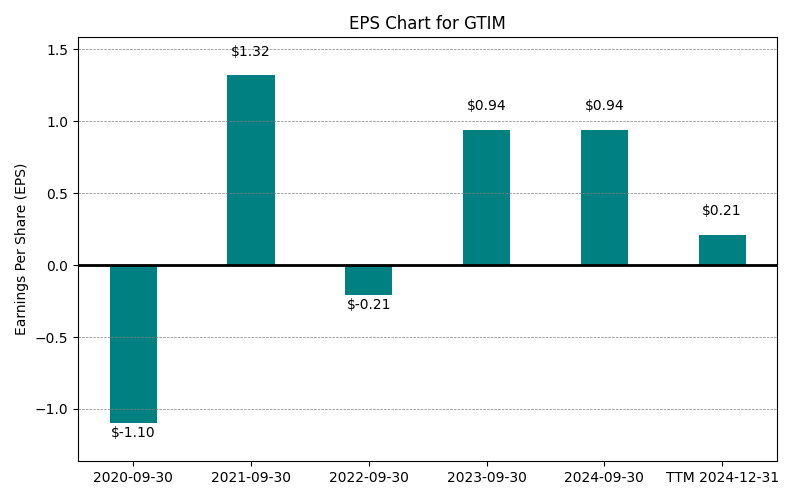
| 0 | 2020-09-30 | $110M | $-14M | $-1.10 | 2024-02-04 04:18:32 | N/A | N/A | N/A |
| 1 | 2021-09-30 | $138M | $-3M | $1.32 | 2026-02-11 08:42:17 | 25.8% | -81.0% | -220.0% |
| 2 | 2022-09-30 | $138M | $-3M | $-0.21 | 2026-05-29 09:09:14 | 0.0% | 0.0% | -115.9% |
| 3 | 2023-09-30 | $138M | $11M | $0.94 | 2026-05-29 09:09:14 | -0.0% | -519.8% | -547.6% |
| 4 | 2024-09-30 | $142M | $2M | $0.15 | 2026-05-29 09:09:14 | 3.1% | -85.5% | -84.0% |
| 5 | 2025-09-30 | $142M | $1M | $0.10 | 2026-05-29 09:09:14 | -0.5% | -36.5% | -33.3% |
| 6 | TTM 2026-03-31 | $137M | $2M | $0.17 | 2026-05-19 09:08:32 | -3.3% | 77.1% | 70.0% |
EPS
Forecasts


Y/Y % Change


No data available
Forward Estimate History
How the next-FY EPS and revenue estimates have drifted over time. One line per fiscal year – past lines end when that FY became current.
Expenses
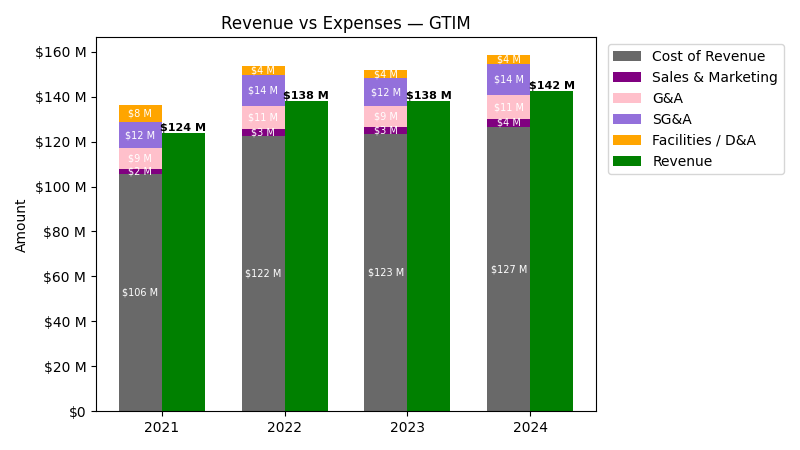
| Year | Revenue ($) | Cost of Revenue ($) | Sales & Marketing ($) | G&A ($) | SG&A ($) | Facilities / D&A ($) |
|---|---|---|---|---|---|---|
| 2022 | $138.2M | $118.2M | $3.2M | $10.5M | $13.7M | $4.1M |
| 2023 | $138.2M | $119.0M | $3.3M | $9.2M | $12.4M | $3.8M |
| 2024 | $142.4M | $122.7M | $3.5M | $10.6M | $14.1M | $3.8M |
| 2025 | $141.6M | $124.0M | $3.3M | $9.7M | $13.0M | $4.0M |
| TTM | $137.0M | $119.0M | $4.0M | $8.8M | $12.8M | $3.8M |
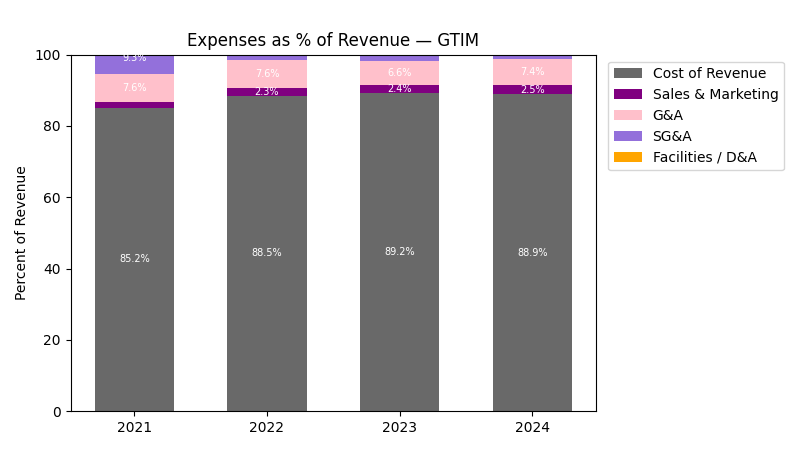
| Year | Revenue Change (%) | Cost of Revenue Change (%) | Sales & Marketing Change (%) | G&A Change (%) | SG&A Change (%) | Facilities / D&A Change (%) |
|---|---|---|---|---|---|---|
| 2023 | -0.03 | 0.68 | 2.97 | -12.95 | -9.27 | -7.52 |
| 2024 | 3.05 | 3.10 | 8.29 | 15.45 | 13.57 | 2.59 |
| 2025 | -0.53 | 1.11 | -6.04 | -8.00 | -7.51 | 5.20 |
| TTM | -3.30 | -4.05 | 20.81 | -9.40 | -1.72 | -5.14 |
No unmapped expenses.
Segment Performance
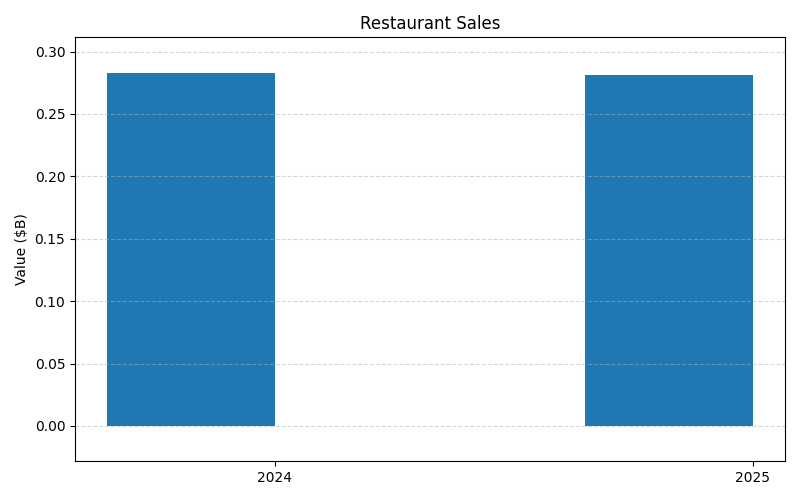
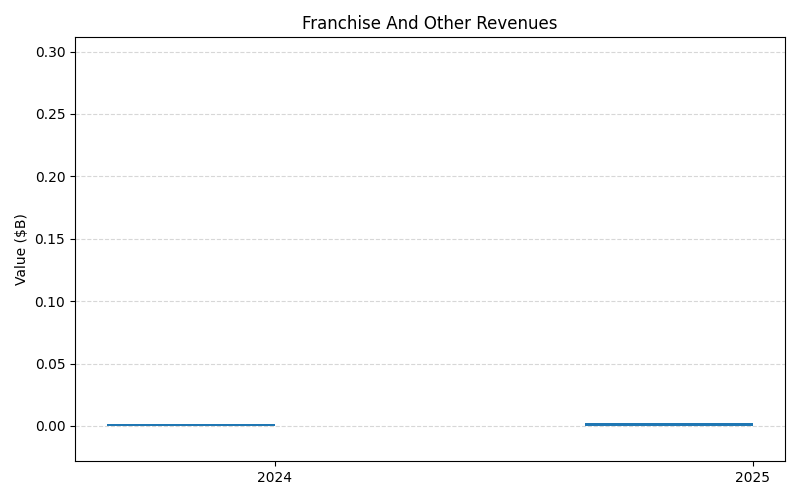
SEGMENTS v2025-09-09 · 2026-05-29 09:09 UTC — Units: $M. Rows list fiscal years (last 3 + TTM) with revenue for each segment; the final row shows the TTM revenue mix (operating income columns display “—” where mix is not applicable).
| Year | Restaurant Sales Rev | Franchise And Other Revenues Rev | Total Rev |
|---|---|---|---|
| 2024 | 283.1M | 1.65M | 284.8M |
| 2025 | 281.2M | 2.03M | 283.3M |
Segment Performance (Axis 2)
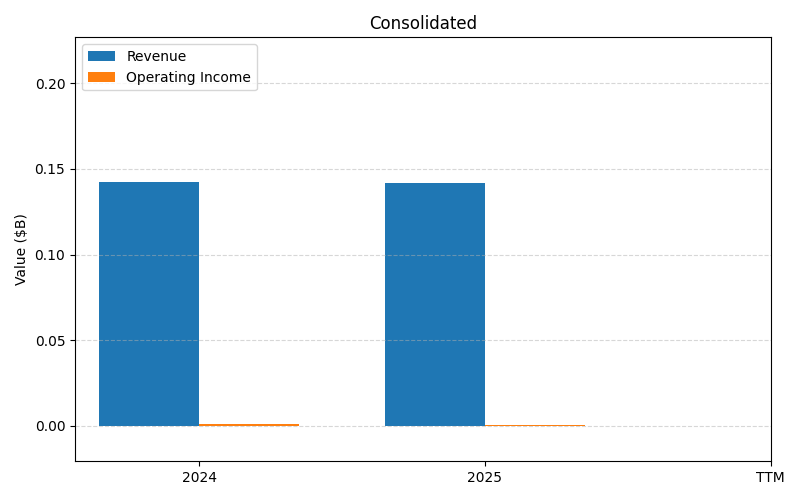
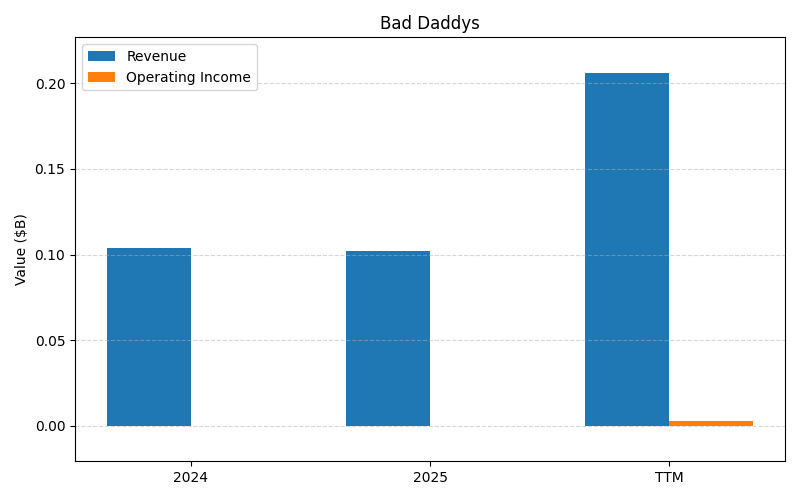
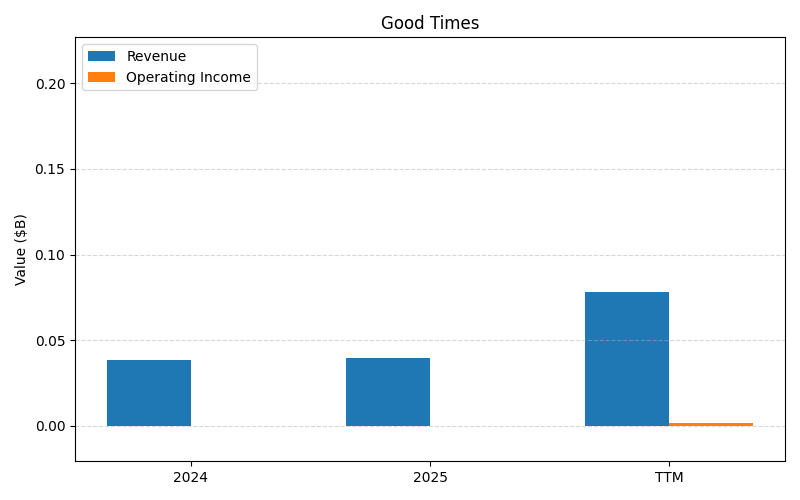
SEGMENTS v2025-09-09 · 2026-05-29 09:09 UTC — Units: $M. Rows list fiscal years (last 3 + TTM) with revenue and operating income for each segment; the final row shows the TTM revenue mix (operating income columns display “—” where mix is not applicable).
| Year | Consolidated Rev | Consolidated OI | Bad Daddys Rev | Bad Daddys OI | Good Times Rev | Good Times OI | Corporate Rev | Corporate OI | Total Rev | Total OI |
|---|---|---|---|---|---|---|---|---|---|---|
| 2024 | 142.4M | 1.38M | 103.9M | – | 38.5M | – | 0.00M | – | 284.8M | 1.38M |
| 2025 | 141.6M | 0.33M | 102.2M | – | 39.4M | – | – | – | 283.3M | 0.33M |
| TTM | 692.1M | 1.40M | 501.5M | 0.00M | 190.6M | 0.00M | – | – | 1384.3M | 1.40M |
| % of Total (TTM) | 50.0% | — | 36.2% | — | 13.8% | — | – | — | 100% | — |
Balance Sheet
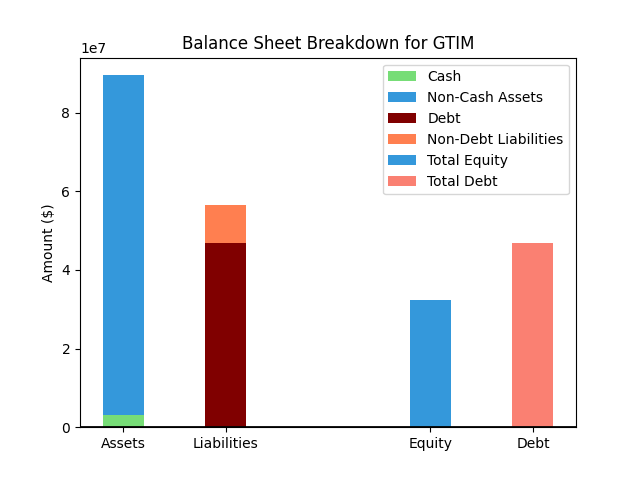
| Metric | Value | |
|---|---|---|
| 0 | Total Assets | $81M |
| 1 | Cash | $3M |
| 2 | Total Liabilities | $47M |
| 3 | Total Debt | $38M |
| 4 | Total Equity | $33M |
| 5 | Debt to Equity Ratio | 1.15 |
EPS & Dividend

Valuation

No data available
No data available
Implied Growth
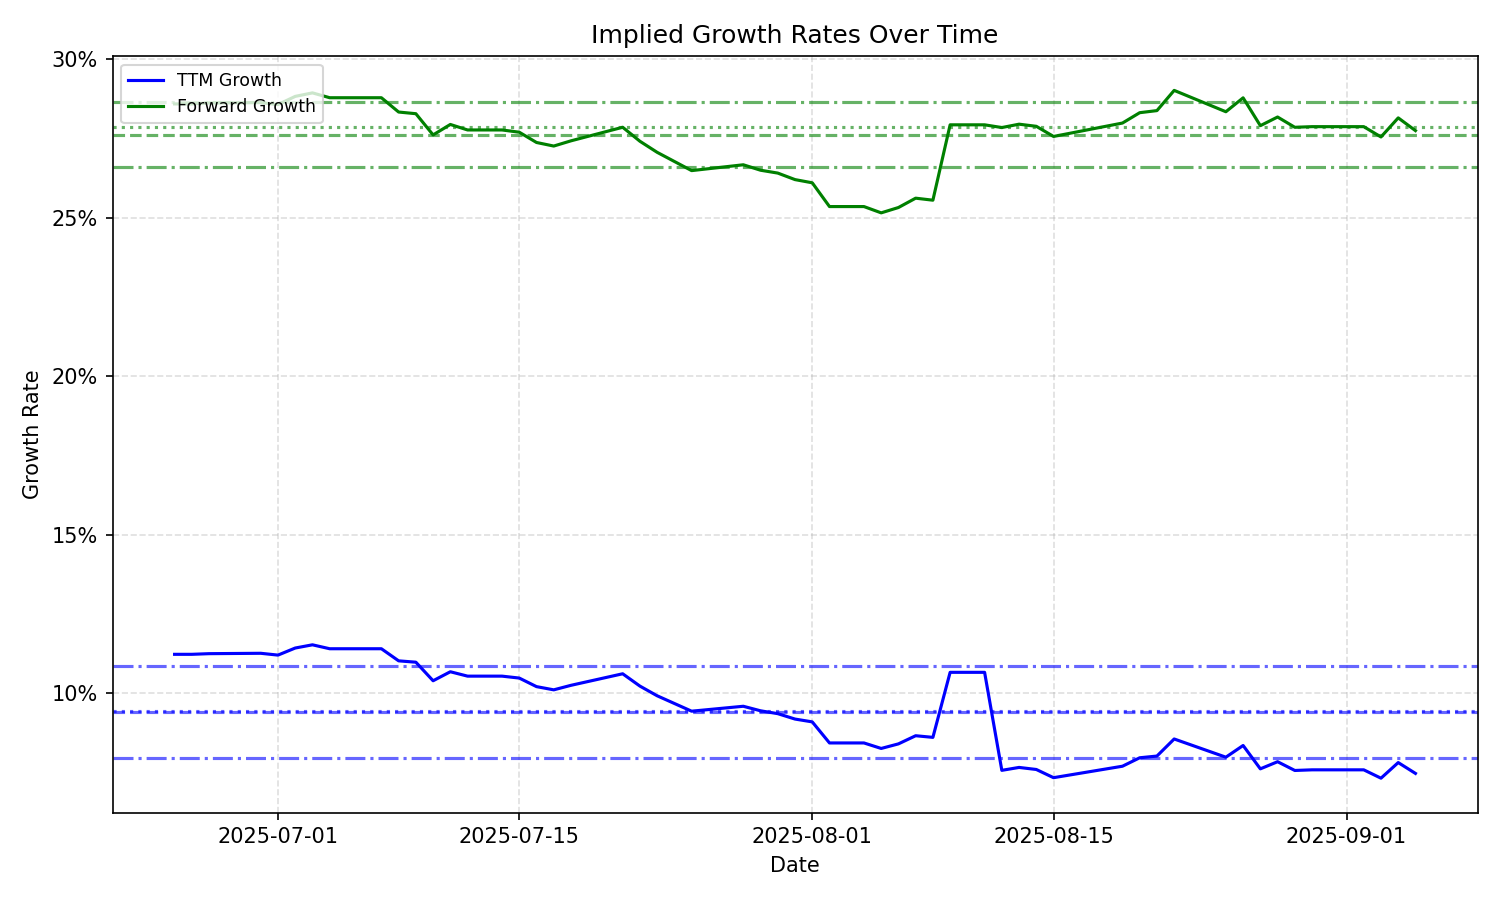
| Average | Median | Std Dev | Current | Percentile | ||||||
|---|---|---|---|---|---|---|---|---|---|---|
| TTM | Forward | TTM | Forward | TTM | Forward | TTM | Forward | TTM | Forward | |
| Timeframe | ||||||||||
| 1 Year | 7.06% | 26.51% | 7.16% | 27.09% | 2.51% | 1.61% | 1.88% | 25.13% | 6.6% | 28.9% |
| 3 Years | 7.06% | 26.51% | 7.16% | 27.09% | 2.51% | 1.61% | 1.88% | 25.13% | 6.6% | 28.9% |
| 5 Years | 7.06% | 26.51% | 7.16% | 27.09% | 2.51% | 1.61% | 1.88% | 25.13% | 6.6% | 28.9% |
| 10 Years | 7.06% | 26.51% | 7.16% | 27.09% | 2.51% | 1.61% | 1.88% | 25.13% | 6.6% | 28.9% |