Goldman Sachs Group, Inc. (The) — GS
| Close Price | Market Cap | P/E Ratio | Forward P/E Ratio | Implied Growth* | Implied Forward Growth* | Dividend | P/B Ratio |
|---|---|---|---|---|---|---|---|
| $1025.56 | $302.55B | 18.7 | 15.7 | 10.9% | 9.1% | $18.00 1.8% | 2.9 |
Latest Headlines
- · Bonds May Finally Be Ready to Give Stocks a Run for Their Money
- · Morgan Stanley Joins Elite List As Stock Hits Highs; Goldman Sachs Rides Massive Deals Wave
- · India Doubled Tariffs on Silver and Gold Imports To Protect a Plunging Rupee; Will Foreign US Treasury Bond Dumping Cause the US To Follow Suit?
- · Is AI Hiking Your Energy Bill? Nic Carter Says 'The Data Doesn't Support It'
- · SpaceX Said to Cut IPO Value Goal to at Least $1.8 Trillion
- · Equity Data Science (EDS) Appoints Sebastian Lonza as Chief Revenue Officer to Accelerate Growth Across Institutional Markets
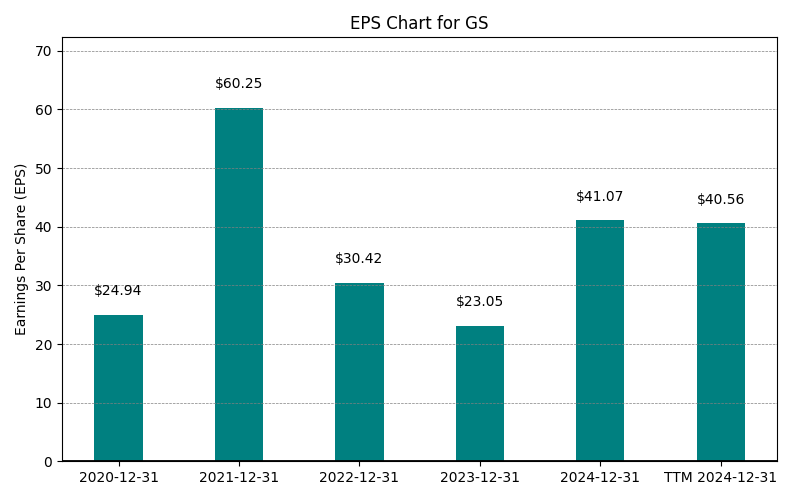
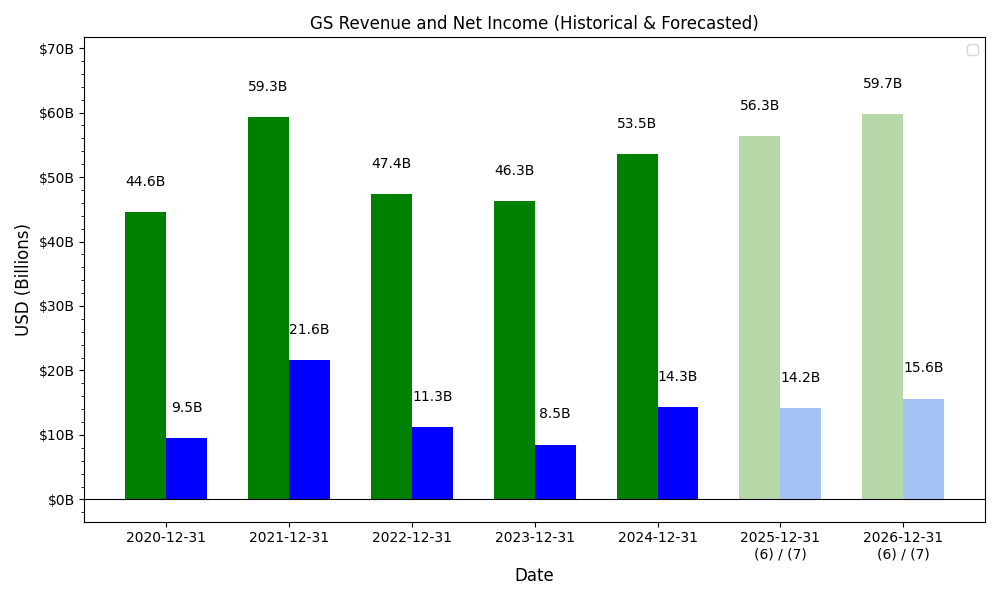
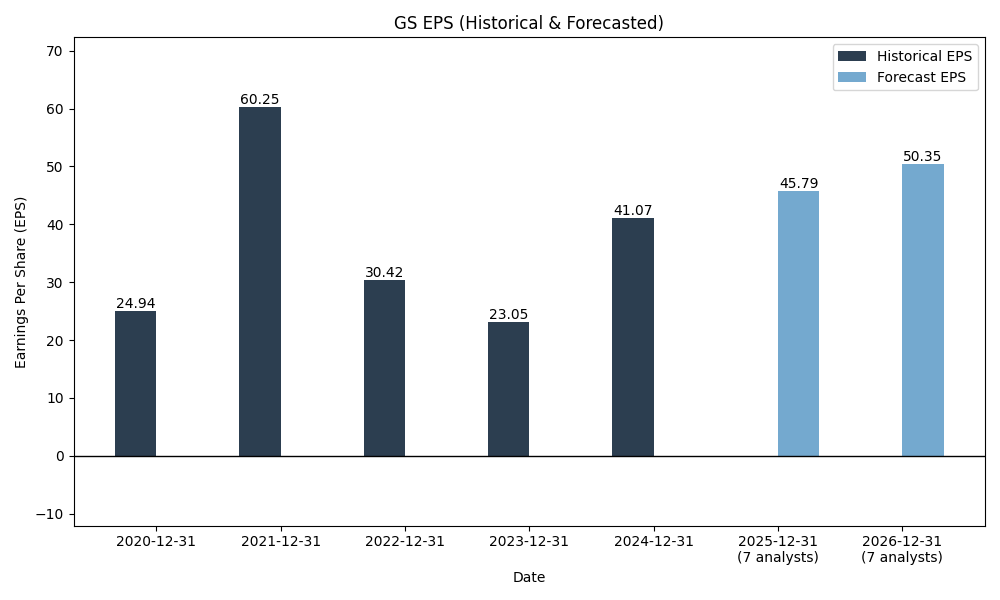
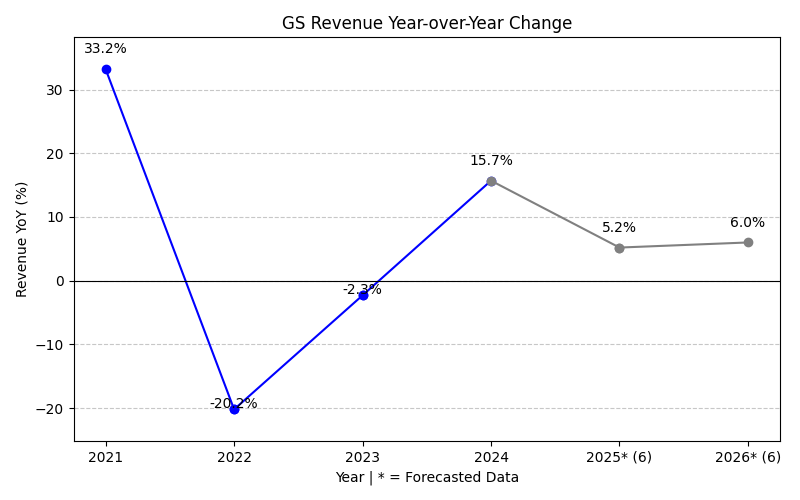
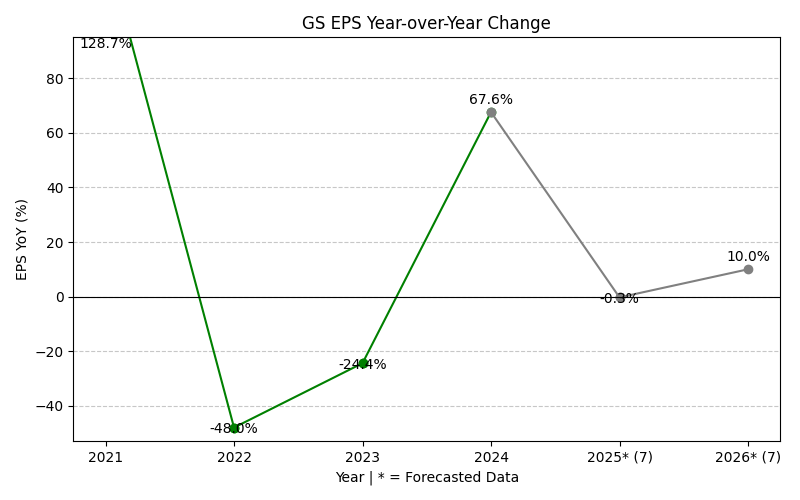
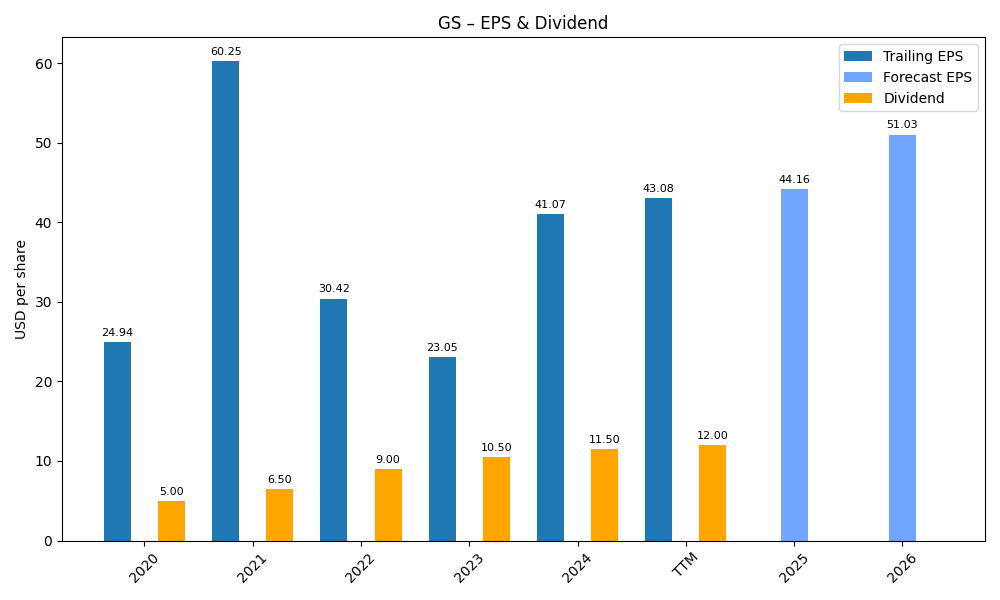
Revenue & Net Income
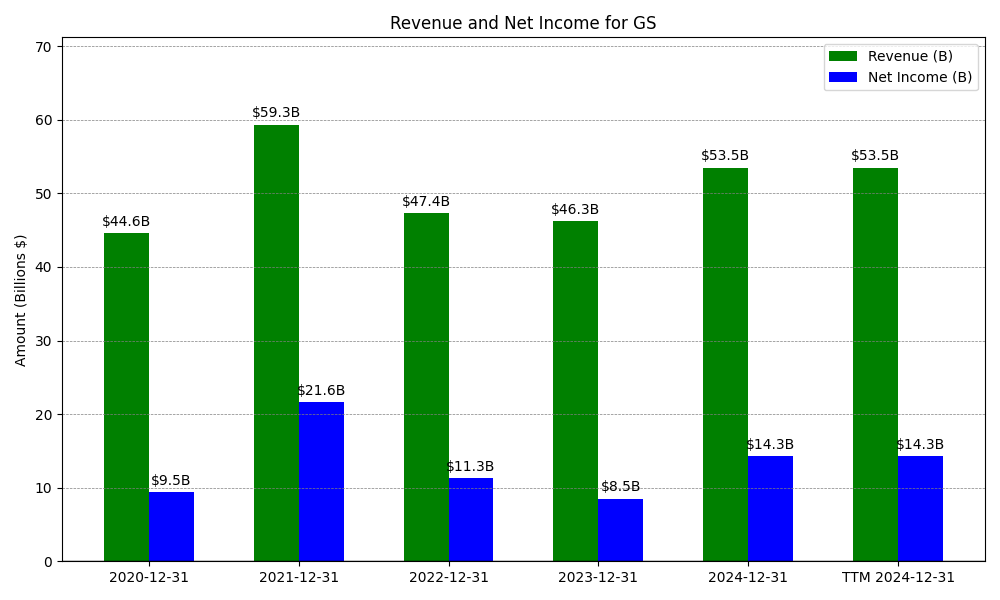
| Date | Revenue | Net_Income | EPS | Last_Updated | Revenue_Change | Net_Income_Change | EPS_Change | |
|---|---|---|---|---|---|---|---|---|
| 0 | 2020-12-31 | $44,559M | $9,459M | $24.94 | 2024-02-09 04:07:07 | N/A | N/A | N/A |
| 1 | 2021-12-31 | $59,339M | $21,635M | $30.42 | 2026-03-05 08:35:07 | 33.2% | 128.7% | 22.0% |
| 2 | 2022-12-31 | $47,365M | $11,261M | $30.42 | 2026-05-29 09:08:59 | -20.2% | -48.0% | 0.0% |
| 3 | 2023-12-31 | $46,254M | $8,516M | $23.05 | 2026-05-29 09:08:59 | -2.3% | -24.4% | -24.2% |
| 4 | 2024-12-31 | $53,512M | $14,276M | $41.07 | 2026-05-29 09:08:59 | 15.7% | 67.6% | 78.2% |
| 5 | 2025-12-31 | $58,283M | $17,176M | $51.95 | 2026-05-29 09:08:59 | 8.9% | 20.3% | 26.5% |
| 6 | TTM 2026-03-31 | $60,448M | $18,068M | $54.75 | 2026-04-15 08:36:46 | 3.7% | 5.2% | 5.4% |
EPS
Forecasts
Y/Y % Change
GS Year-over-Year Growth
| 2020 | 2021 | 2022 | 2023 | 2024 | 2025 | 2026 | 2027 | Average | |
|---|---|---|---|---|---|---|---|---|---|
| Revenue Growth (%) | 33.2% | -20.2% | -2.3% | 15.7% | 8.9% | 9.4% | 4.8% | 7.1% | |
| Revenue Analysts (#) | 0 | 0 | 0 | 0 | 0 | 0 | 19 | 19 | |
| EPS Growth (%) | 128.7% | -48.0% | -24.4% | 67.6% | 20.3% | 2.0% | 10.2% | 22.3% | |
| EPS Analysts (#) | 0 | 0 | 0 | 0 | 0 | 0 | 23 | 22 |
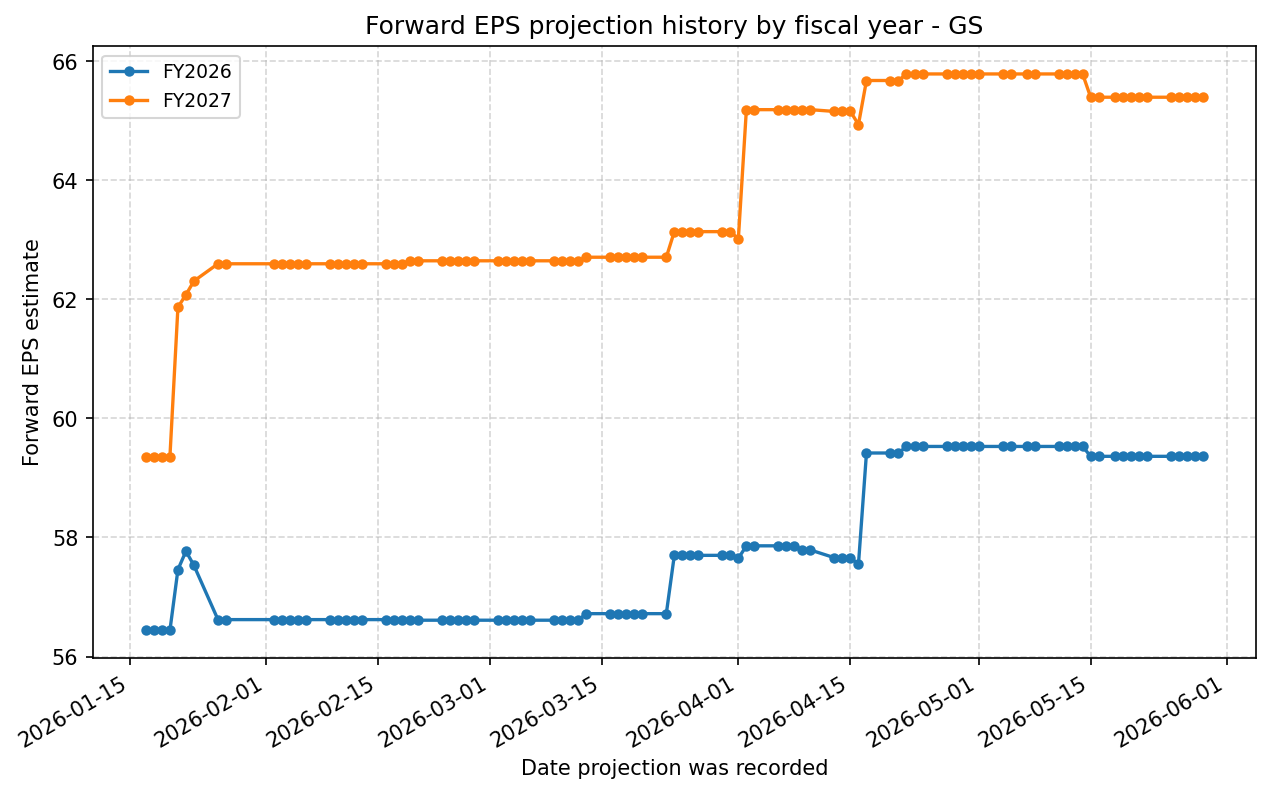
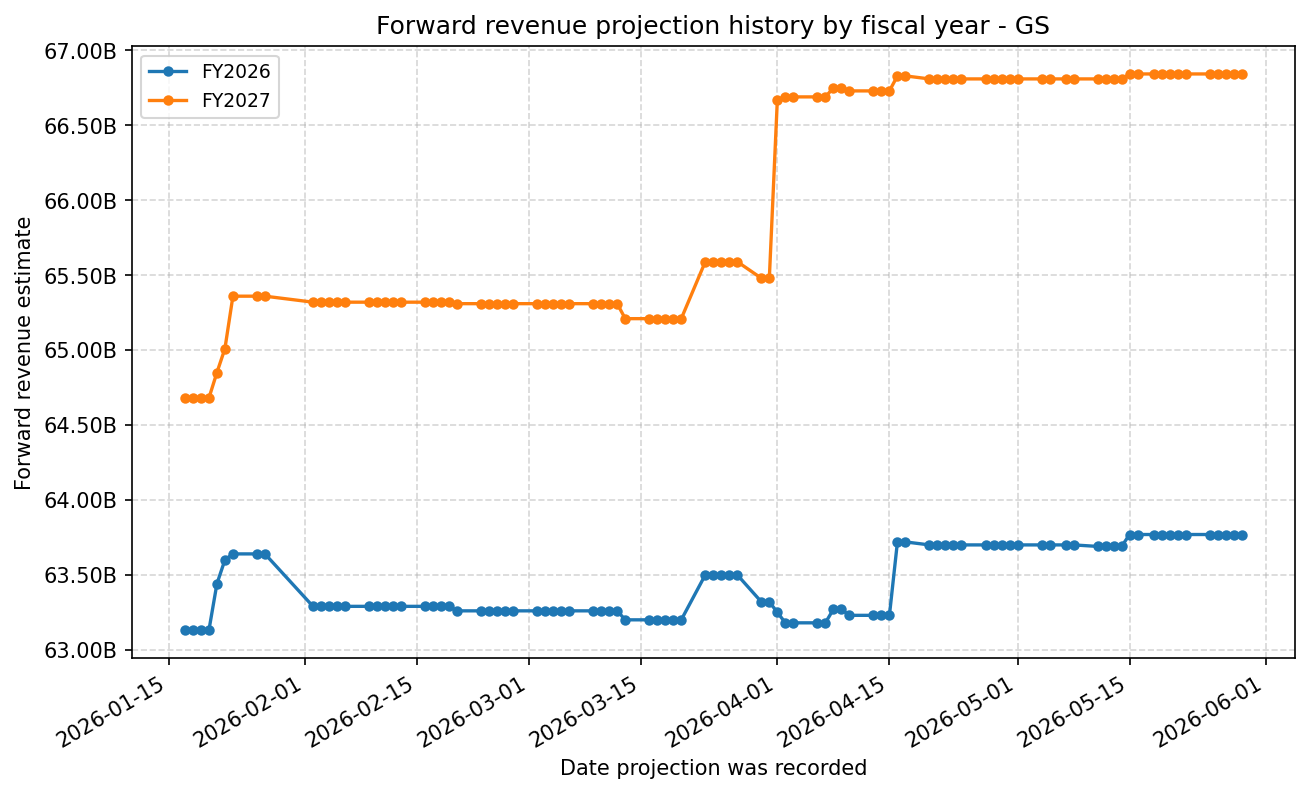
Forward Estimate History
How the next-FY EPS and revenue estimates have drifted over time. One line per fiscal year – past lines end when that FY became current.
Expenses
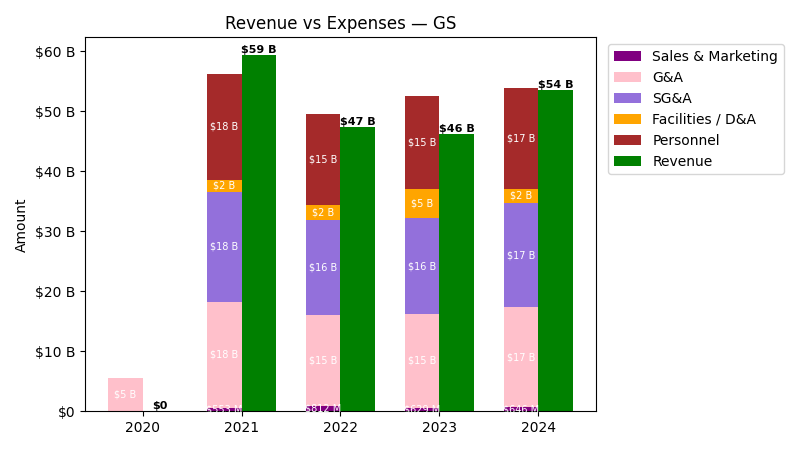
| Year | Revenue ($) | Sales & Marketing ($) | G&A ($) | SG&A ($) | Facilities / D&A ($) | Personnel ($) |
|---|---|---|---|---|---|---|
| 2021 | $59.3B | $553.0M | $17.7B | $18.3B | $2.0B | $17.7B |
| 2022 | $47.4B | $812.0M | $15.1B | $16.0B | $2.5B | $15.1B |
| 2023 | $46.3B | $629.0M | $15.5B | $16.1B | $4.9B | $15.5B |
| 2024 | $53.5B | $646.0M | $16.7B | $17.4B | $2.4B | $16.7B |
| 2025 | $58.3B | $710.0M | $18.9B | $19.6B | $2.2B | $18.9B |
| TTM | $60.4B | $740.0M | $19.4B | $20.2B | $2.2B | $19.4B |
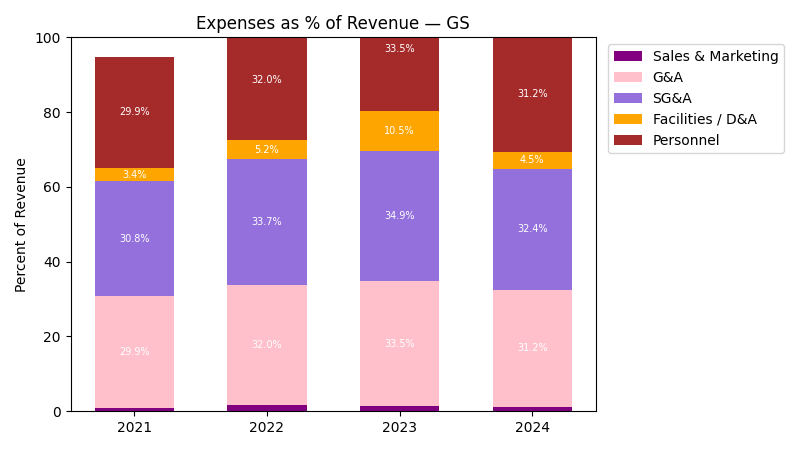
| Year | Revenue Change (%) | Sales & Marketing Change (%) | G&A Change (%) | SG&A Change (%) | Facilities / D&A Change (%) | Personnel Change (%) |
|---|---|---|---|---|---|---|
| 2022 | -20.18 | 46.84 | -14.51 | -12.65 | 21.84 | -14.51 |
| 2023 | -2.35 | -22.54 | 2.32 | 1.05 | 97.80 | 2.32 |
| 2024 | 15.69 | 2.70 | 7.79 | 7.59 | -50.74 | 7.79 |
| 2025 | 8.92 | 9.91 | 13.17 | 13.05 | -8.78 | 13.17 |
| TTM | 3.71 | 4.23 | 2.84 | 2.89 | -0.50 | 2.84 |
No unmapped expenses.
Balance Sheet
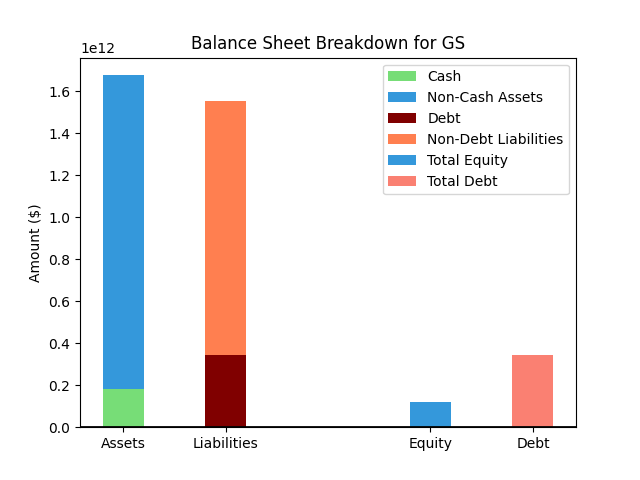
| Metric | Value | |
|---|---|---|
| 0 | Total Assets | $2,060,180M |
| 1 | Cash | $179,530M |
| 2 | Total Liabilities | $1,937,398M |
| 3 | Total Debt | $434,737M |
| 4 | Total Equity | $122,782M |
| 5 | Debt to Equity Ratio | 3.54 |
EPS & Dividend
Valuation
| Share Price | Treasury Yield | Estimates | Fair Value (P/E) | Fair Value (P/S) | Current P/S | Current P/E |
|---|---|---|---|---|---|---|
| $1025.56 | 4.5% | Nicks Growth: 2% Nick's Expected Margin: 10% FINVIZ Growth: 12% |
Nicks: 8 Finviz: 20 |
Nick's: 0.780 | 5.0 | 18.7 |
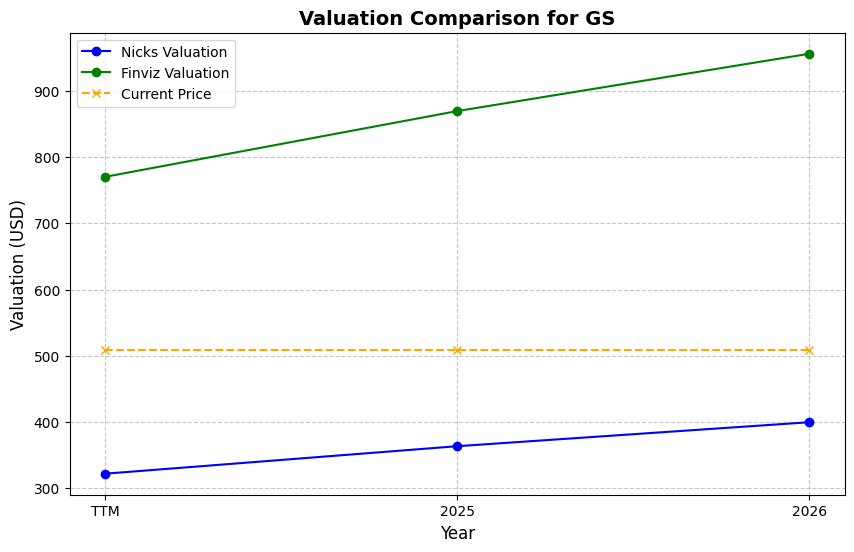
| Basis | Year | Nicks Valuation | Nicks vs Share Price | Finviz Valuation | Finviz vs Share Price |
|---|---|---|---|---|---|
| $54.75 EPS | TTM | $427.09 | -58.4% | $1084.79 | 5.8% |
| $59.36 EPS | 2026 | $463.09 | -54.8% | $1176.21 | 14.7% |
| $65.40 EPS | 2027 | $510.16 | -50.3% | $1295.78 | 26.3% |
Implied Growth
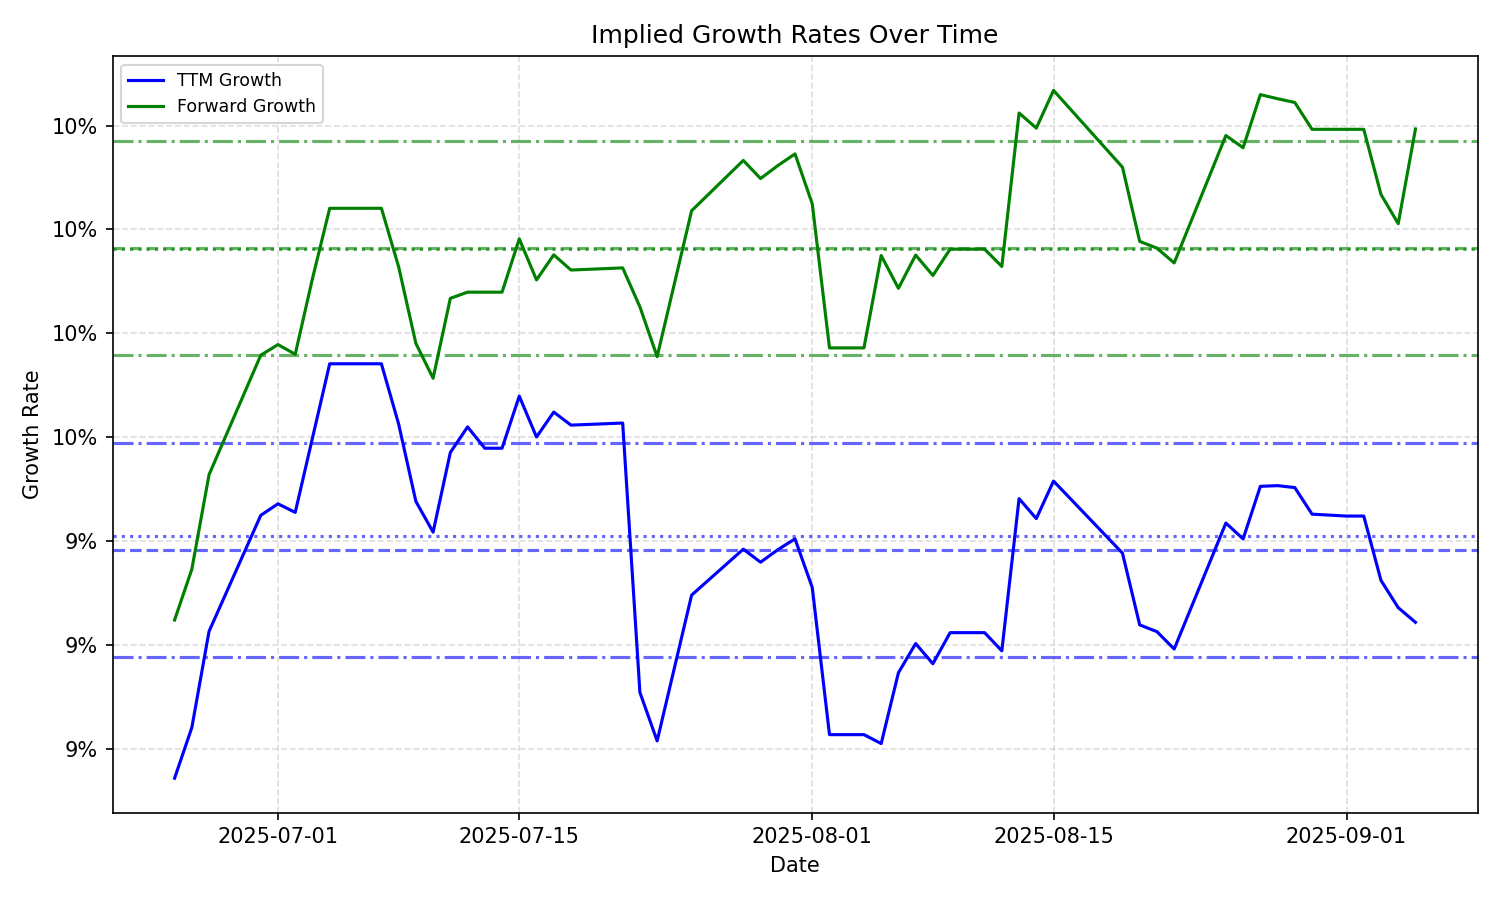
| Average | Median | Std Dev | Current | Percentile | ||||||
|---|---|---|---|---|---|---|---|---|---|---|
| TTM | Forward | TTM | Forward | TTM | Forward | TTM | Forward | TTM | Forward | |
| Timeframe | ||||||||||
| 1 Year | 9.58% | 9.24% | 9.52% | 9.76% | 0.63% | 1.42% | 10.75% | 8.88% | 96.3% | 38.0% |
| 3 Years | 9.58% | 9.24% | 9.52% | 9.76% | 0.63% | 1.42% | 10.75% | 8.88% | 96.3% | 38.0% |
| 5 Years | 9.58% | 9.24% | 9.52% | 9.76% | 0.63% | 1.42% | 10.75% | 8.88% | 96.3% | 38.0% |
| 10 Years | 9.58% | 9.24% | 9.52% | 9.76% | 0.63% | 1.42% | 10.75% | 8.88% | 96.3% | 38.0% |