Group 1 Automotive, Inc. — GPI
| Close Price | Market Cap | P/E Ratio | Forward P/E Ratio | Implied Growth* | Implied Forward Growth* | Dividend | P/B Ratio |
|---|---|---|---|---|---|---|---|
| $316.34 | $3.76B | 12.0 | 6.7 | 6.3% | 0.5% | $2.20 0.7% | 1.3 |
Latest Headlines
- · FedEx upgraded, Dollar General downgraded: Wall Street's top analyst calls
- · Is Group 1 Automotive (GPI) Offering Value After Recent Share Price Weakness?
- · This Auto Retailer Repurchased $72 Million of Stock. One Fund Added $65 Million More
- · What to Know About a $38 Million Bet on monday.com Amid a 75% Stock Drop
- · Group 1 Automotive trims 700 jobs in Q1 amid uncertain market
- · Group 1 Automotive Appoints Daniel McHenry as President and CEO, UK
Revenue & Net Income
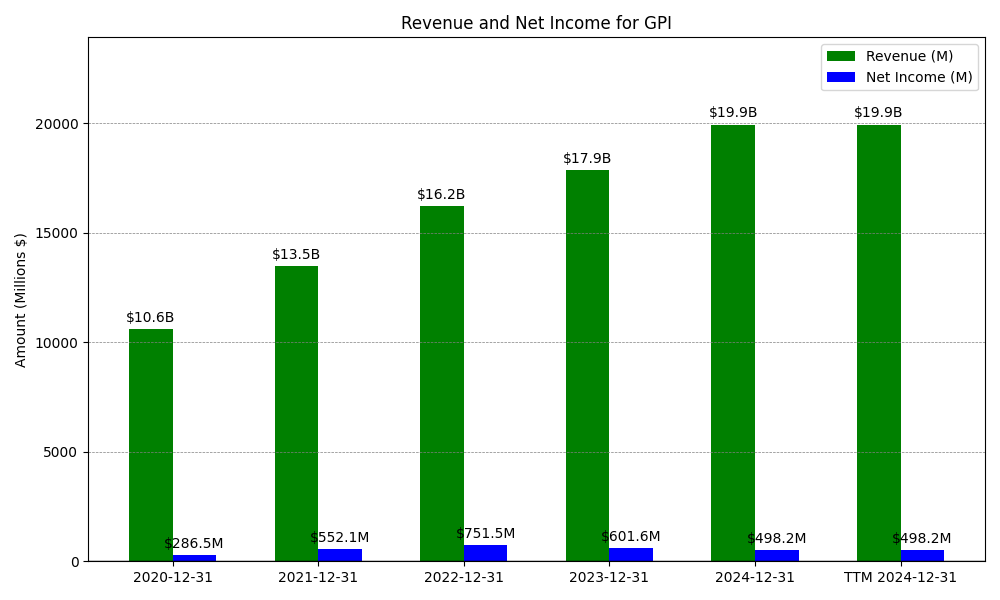
| Date | Revenue | Net_Income | EPS | Last_Updated | Revenue_Change | Net_Income_Change | EPS_Change | |
|---|---|---|---|---|---|---|---|---|
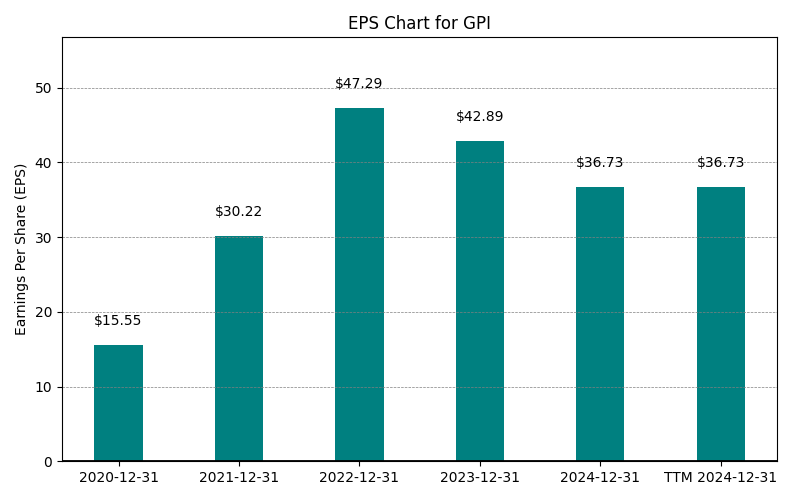
| 0 | 2020-12-31 | $10,600M | $286M | $15.55 | 2024-02-06 05:06:00 | N/A | N/A | N/A |
| 1 | 2021-12-31 | $13,482M | $552M | $51.10 | 2026-02-16 08:41:33 | 27.2% | 92.7% | 228.6% |
| 2 | 2022-12-31 | $16,222M | $752M | $51.10 | 2026-05-29 09:08:52 | 20.3% | 36.1% | 0.0% |
| 3 | 2023-12-31 | $17,874M | $602M | $42.89 | 2026-05-29 09:08:52 | 10.2% | -19.9% | -16.1% |
| 4 | 2024-12-31 | $19,934M | $498M | $36.73 | 2026-05-29 09:08:52 | 11.5% | -17.2% | -14.4% |
| 5 | 2025-12-31 | $22,571M | $325M | $26.70 | 2026-05-29 09:08:52 | 13.2% | -34.7% | -27.3% |
| 6 | TTM 2026-03-31 | $22,473M | $327M | $26.31 | 2026-05-04 08:53:20 | -0.4% | 0.6% | -1.4% |
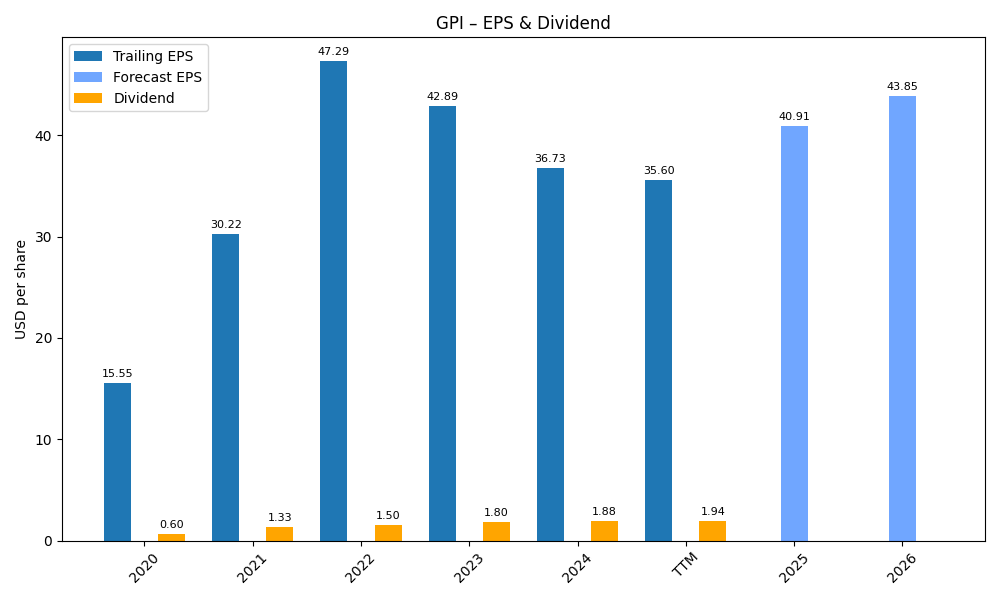
EPS
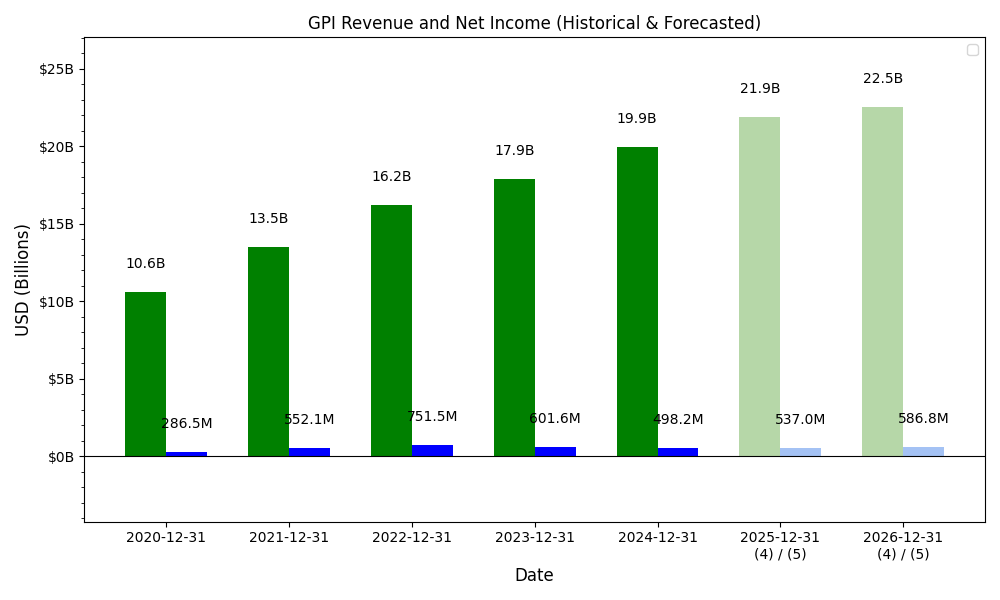
Forecasts
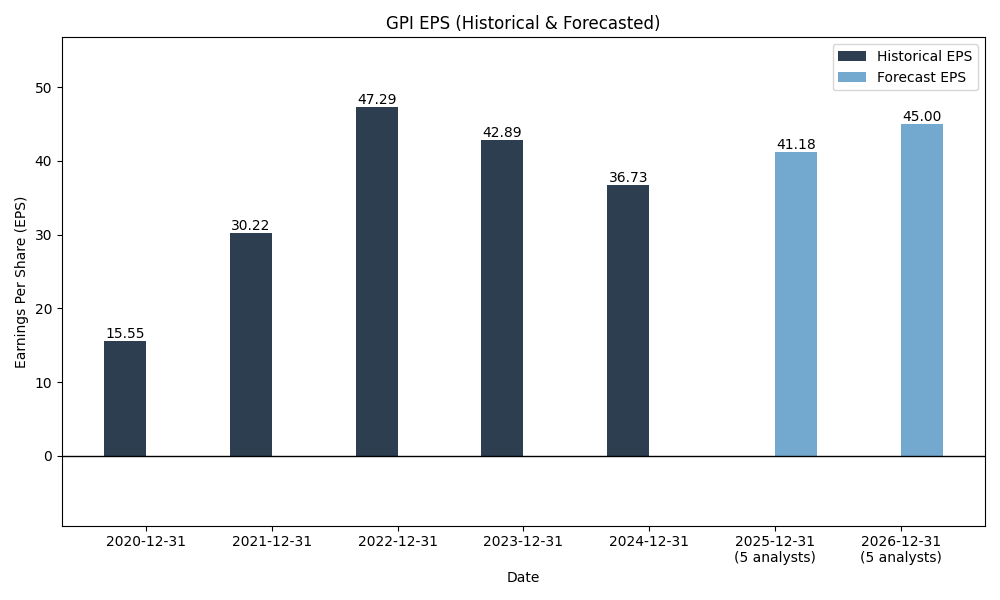
Y/Y % Change
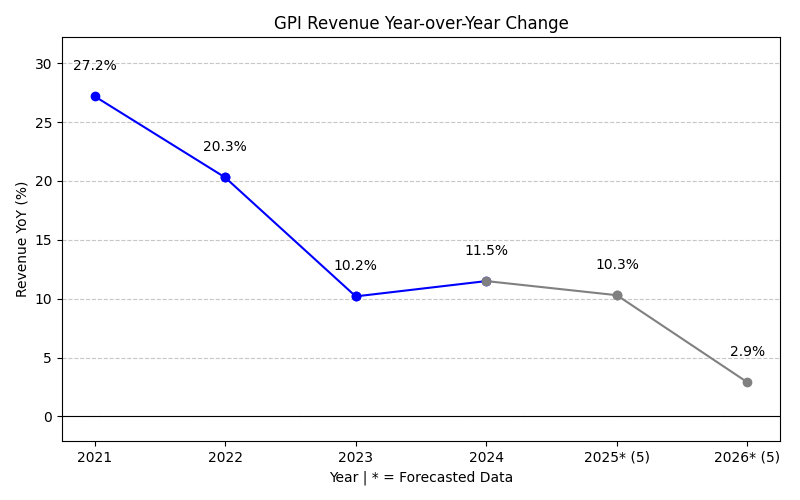
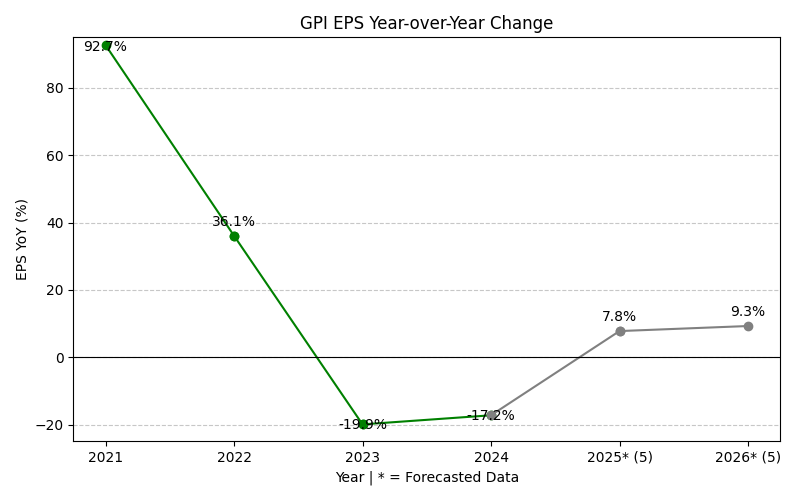
GPI Year-over-Year Growth
| 2020 | 2021 | 2022 | 2023 | 2024 | 2025 | 2026 | 2027 | Average | |
|---|---|---|---|---|---|---|---|---|---|
| Revenue Growth (%) | 27.2% | 20.3% | 10.2% | 11.5% | 13.2% | 1.1% | 3.2% | 12.4% | |
| Revenue Analysts (#) | 0 | 0 | 0 | 0 | 0 | 0 | 11 | 11 | |
| EPS Growth (%) | 92.7% | 36.1% | -19.9% | -17.2% | -34.7% | 54.5% | 12.7% | 17.7% | |
| EPS Analysts (#) | 0 | 0 | 0 | 0 | 0 | 0 | 12 | 12 |
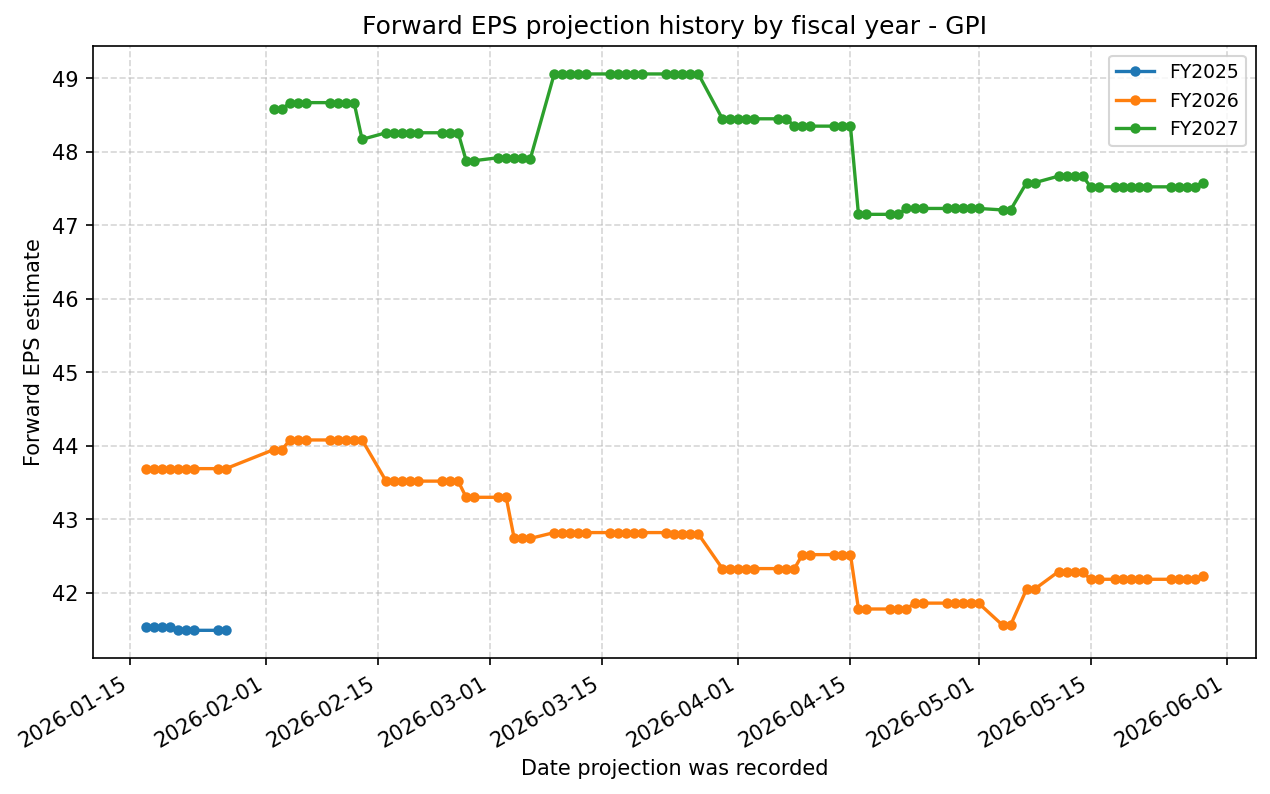
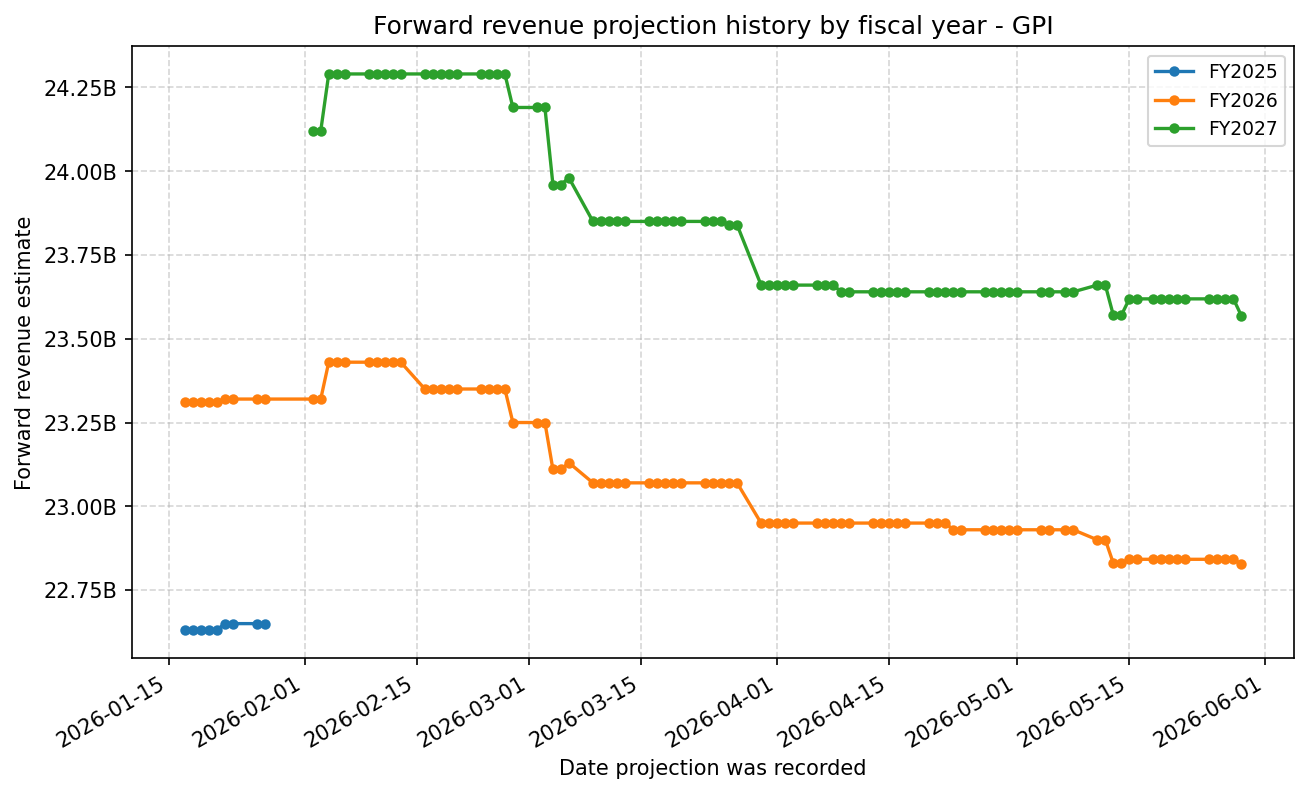
Forward Estimate History
How the next-FY EPS and revenue estimates have drifted over time. One line per fiscal year – past lines end when that FY became current.
Expenses
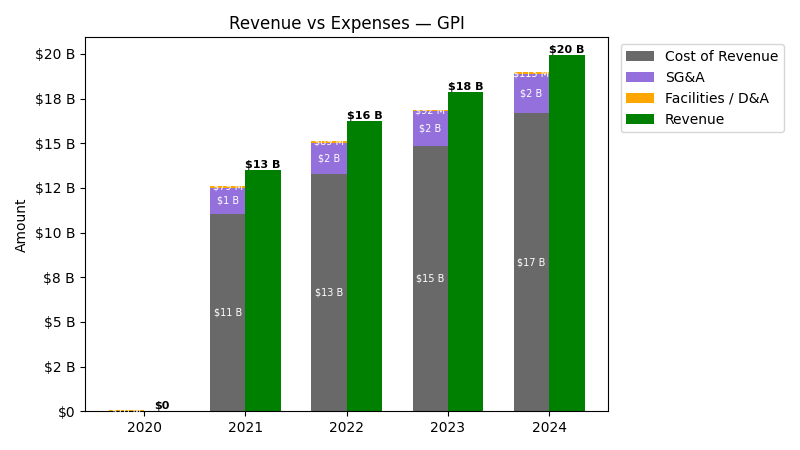
| Year | Revenue ($) | Cost of Revenue ($) | SG&A ($) | Facilities / D&A ($) |
|---|---|---|---|---|
| 2022 | $16.2B | $13.2B | $1.8B | $89.3M |
| 2023 | $17.9B | $14.8B | $1.9B | $92.0M |
| 2024 | $19.9B | $16.6B | $2.2B | $113.1M |
| 2025 | $22.6B | $18.8B | $2.5B | $121.1M |
| TTM | $22.5B | $18.7B | $2.5B | $122.9M |
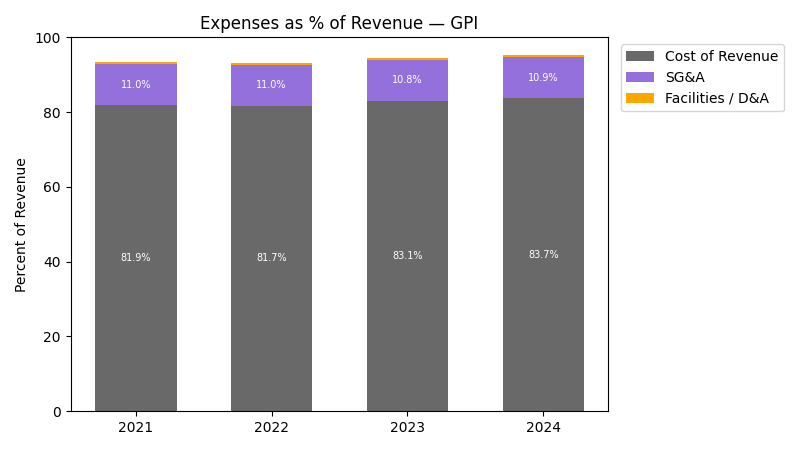
| Year | Revenue Change (%) | Cost of Revenue Change (%) | SG&A Change (%) | Facilities / D&A Change (%) |
|---|---|---|---|---|
| 2023 | 10.18 | 12.11 | 8.05 | 3.02 |
| 2024 | 11.53 | 12.32 | 13.10 | 22.93 |
| 2025 | 13.23 | 13.56 | 16.81 | 7.07 |
| TTM | -0.43 | -0.46 | -0.65 | 1.49 |
No unmapped expenses.
Segment Performance
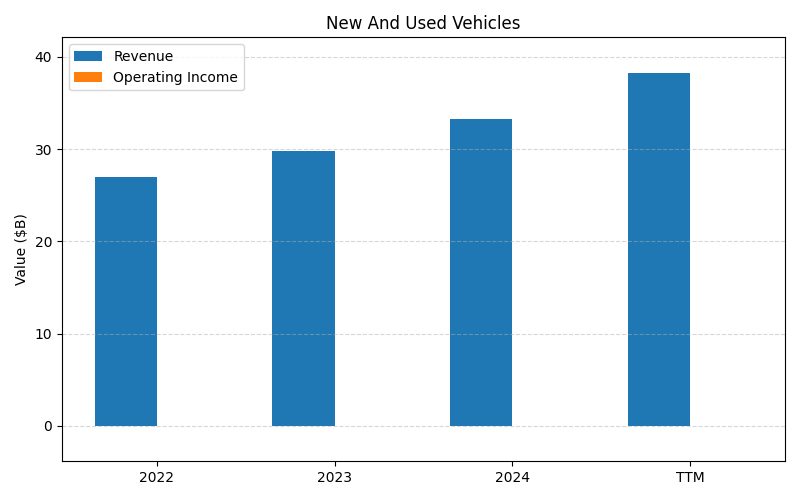
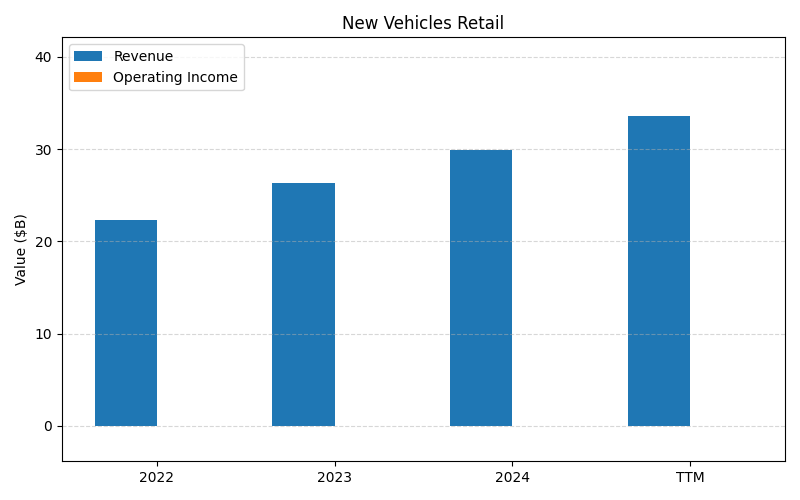
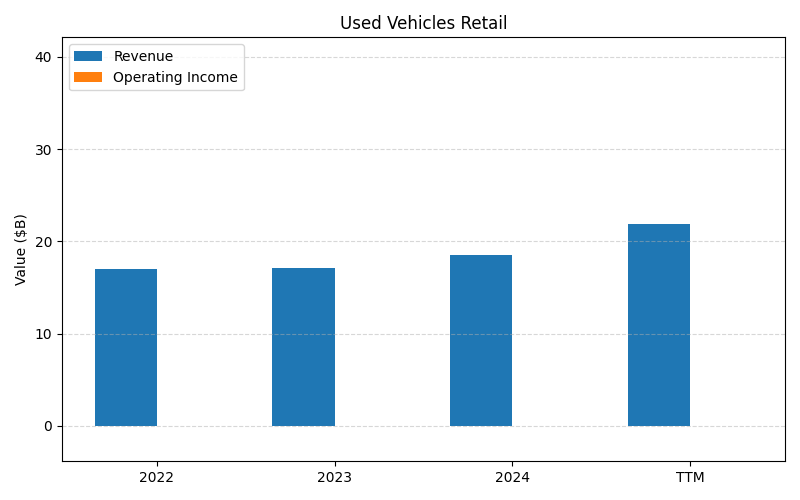
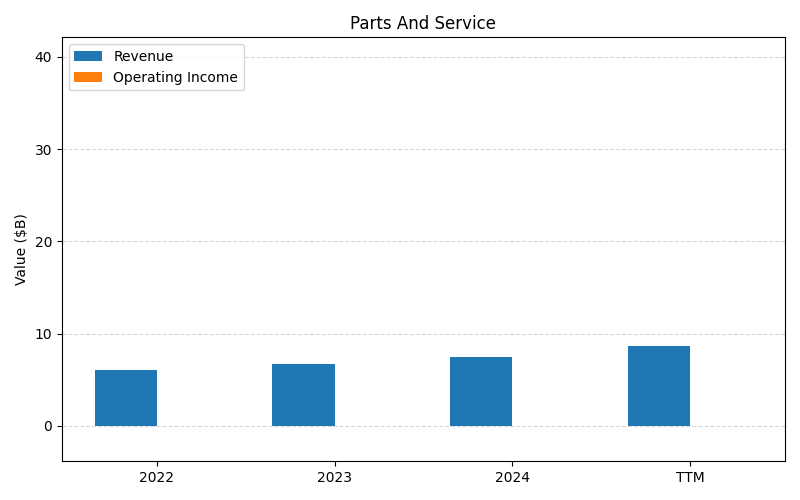
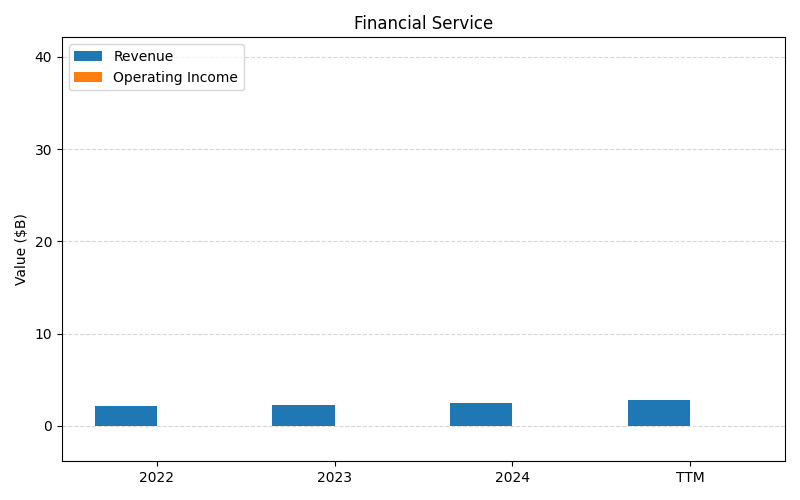
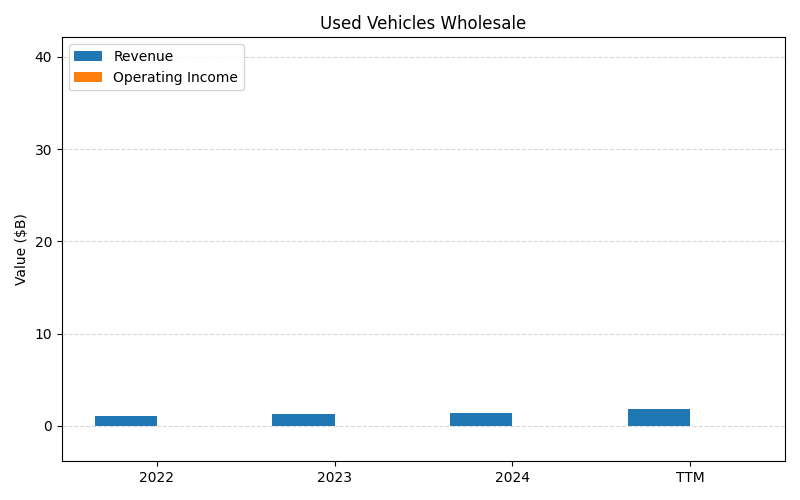
SEGMENTS v2025-09-09 · 2026-05-29 09:08 UTC — Units: $B. Rows list fiscal years (last 3 + TTM) with revenue for each segment; the final row shows the TTM revenue mix (operating income columns display “—” where mix is not applicable).
| Year | New And Used Vehicles Rev | New Vehicles Retail Rev | Used Vehicles Retail Rev | Parts And Service Rev | Financial Service Rev | Used Vehicles Wholesale Rev | Total Rev |
|---|---|---|---|---|---|---|---|
| 2023 | 29.8B | 26.3B | 17.1B | 6.67B | 2.23B | 1.32B | 83.4B |
| 2024 | 33.2B | 29.9B | 18.5B | 7.47B | 2.49B | 1.39B | 93B |
| 2025 | 37.6B | 33B | 21.6B | 8.53B | 2.80B | 1.82B | 105.3B |
| TTM | 89B | 78.6B | 50.7B | 20.2B | 6.62B | 4.11B | 249.2B |
| % of Total (TTM) | 35.7% | 31.5% | 20.4% | 8.1% | 2.7% | 1.7% | 100% |
Segment Performance (Axis 2)
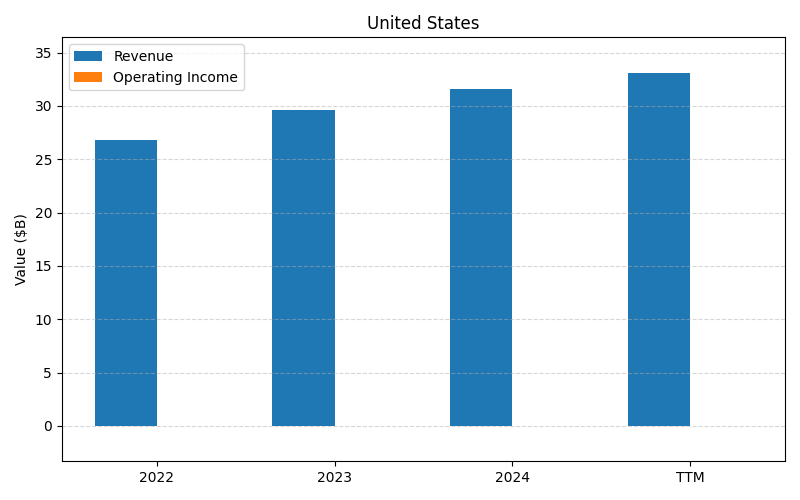
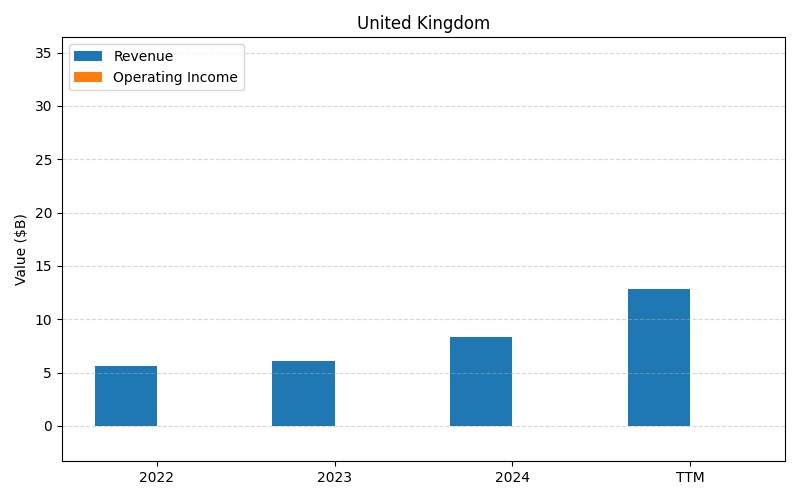
SEGMENTS v2025-09-09 · 2026-05-29 09:08 UTC — Units: $B. Rows list fiscal years (last 3 + TTM) with revenue for each segment; the final row shows the TTM revenue mix (operating income columns display “—” where mix is not applicable).
| Year | United States Rev | United Kingdom Rev | Total Rev |
|---|---|---|---|
| 2023 | 29.6B | 6.12B | 35.7B |
| 2024 | 31.5B | 8.32B | 39.9B |
| 2025 | 33.3B | 11.9B | 45.1B |
| TTM | 80.2B | 26.7B | 106.8B |
| % of Total (TTM) | 75.0% | 25.0% | 100% |
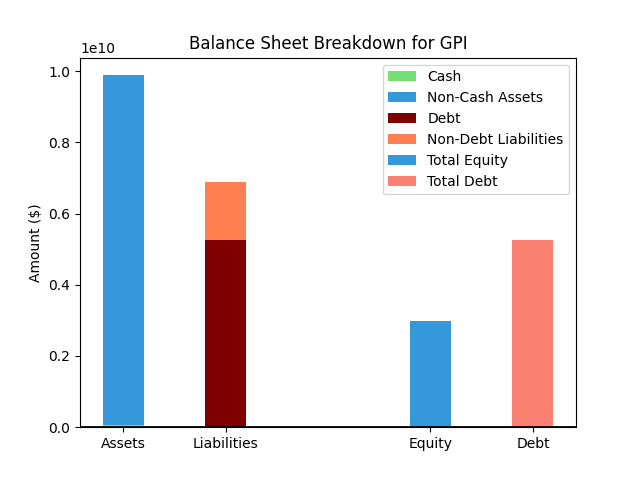
Balance Sheet
| Metric | Value | |
|---|---|---|
| 0 | Total Assets | $10,062M |
| 1 | Cash | $42M |
| 2 | Total Liabilities | $7,223M |
| 3 | Total Debt | $5,612M |
| 4 | Total Equity | $2,840M |
| 5 | Debt to Equity Ratio | 1.98 |
EPS & Dividend
Valuation
| Share Price | Treasury Yield | Estimates | Fair Value (P/E) | Fair Value (P/S) | Current P/S | Current P/E |
|---|---|---|---|---|---|---|
| $316.34 | 4.5% | Nicks Growth: 3% Nick's Expected Margin: 4% FINVIZ Growth: 9% |
Nicks: 9 Finviz: 15 |
Nick's: 0.346 | 0.2 | 12.0 |
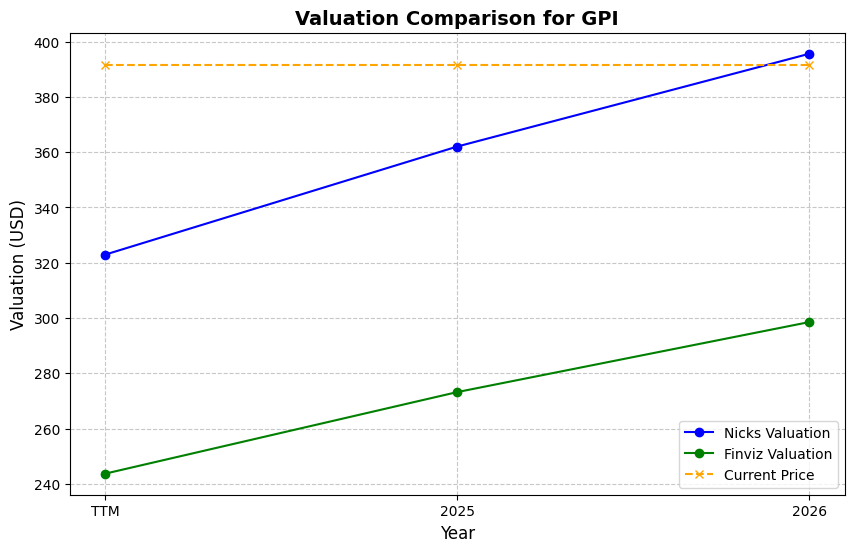
| Basis | Year | Nicks Valuation | Nicks vs Share Price | Finviz Valuation | Finviz vs Share Price |
|---|---|---|---|---|---|
| $26.31 EPS | TTM | $227.28 | -28.2% | $401.10 | 26.8% |
| $42.23 EPS | 2026 | $364.78 | 15.3% | $643.76 | 103.5% |
| $47.58 EPS | 2027 | $411.04 | 29.9% | $725.40 | 129.3% |
Implied Growth
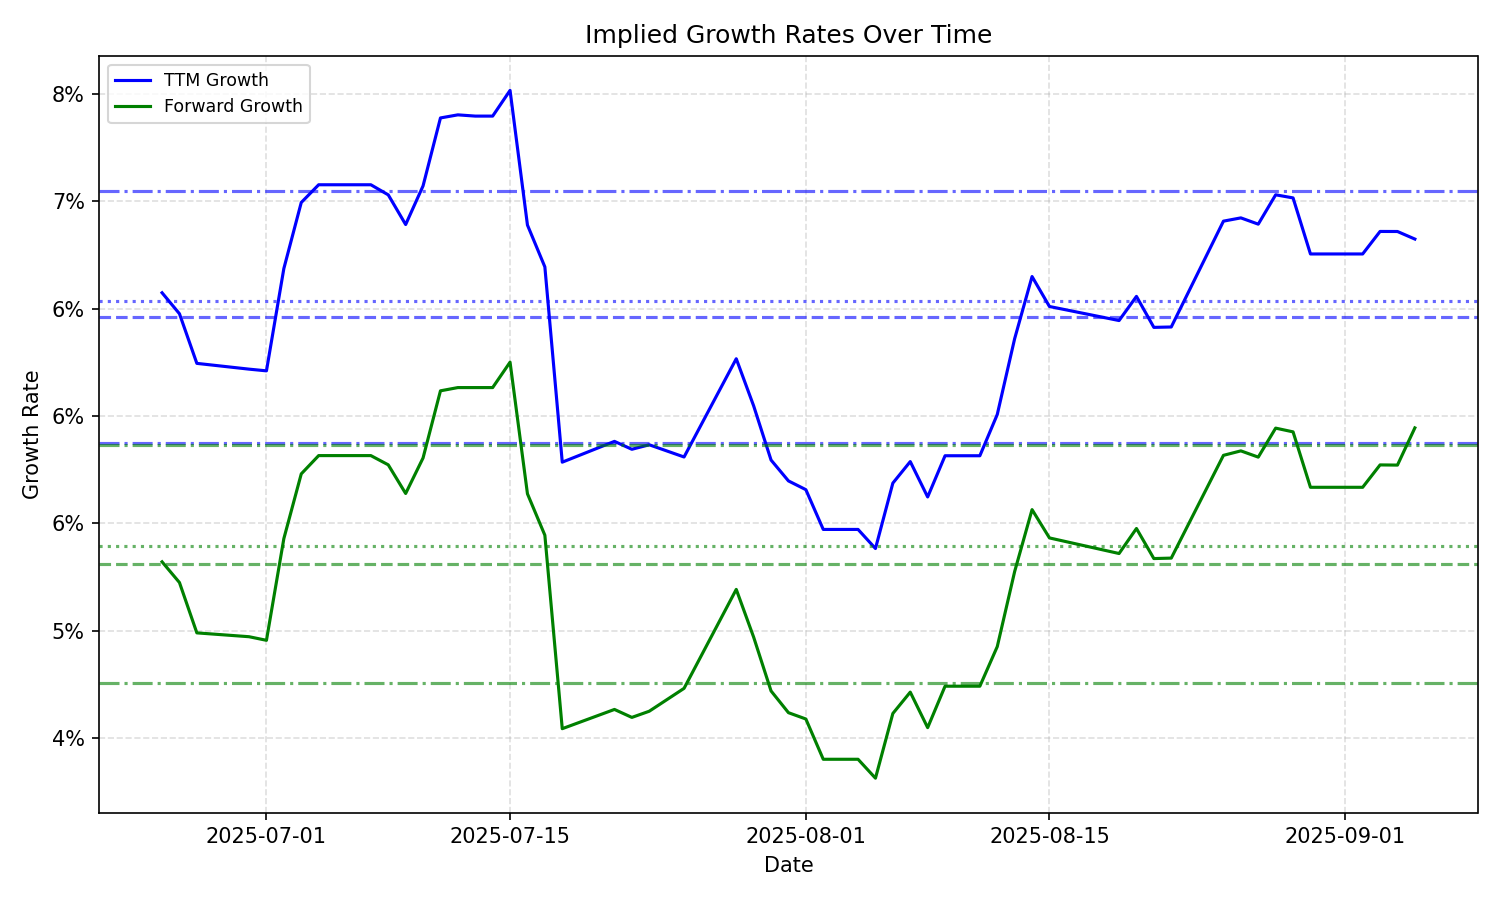
| Average | Median | Std Dev | Current | Percentile | ||||||
|---|---|---|---|---|---|---|---|---|---|---|
| TTM | Forward | TTM | Forward | TTM | Forward | TTM | Forward | TTM | Forward | |
| Timeframe | ||||||||||
| 1 Year | 6.84% | 3.31% | 6.96% | 3.84% | 0.63% | 1.99% | 6.64% | 0.76% | 34.9% | 17.4% |
| 3 Years | 6.84% | 3.31% | 6.96% | 3.84% | 0.63% | 1.99% | 6.64% | 0.76% | 34.9% | 17.4% |
| 5 Years | 6.84% | 3.31% | 6.96% | 3.84% | 0.63% | 1.99% | 6.64% | 0.76% | 34.9% | 17.4% |
| 10 Years | 6.84% | 3.31% | 6.96% | 3.84% | 0.63% | 1.99% | 6.64% | 0.76% | 34.9% | 17.4% |