Alphabet Inc. — GOOGL
| Close Price | Market Cap | P/E Ratio | Forward P/E Ratio | Implied Growth* | Implied Forward Growth* | Dividend | P/B Ratio |
|---|---|---|---|---|---|---|---|
| $380.34 | $4.61T | 29.0 | 26.2 | 15.7% | 14.6% | $0.88 0.2% | 9.6 |
Latest Headlines
- · How Safe Is a Tesla Robo-Taxi?
- · Dow Jones Futures: Market Hits Highs On Iran Hopes; Nvidia, Tesla Lead 5 Trillion-Dollar Stocks Near Buy Points
- · Weekly Wrap: Crypto Prices Breakdown As Bitcoin Falls In May
- · Okta Stock Soars. What’s Stealing the Show From Earnings.
- · Broadcom (AVGO) is Among Claude AI’s Top Stock Picks for 2026
- · Eli Lilly Breaks Out Amid Vaccine Push; Three More Stocks At Highs
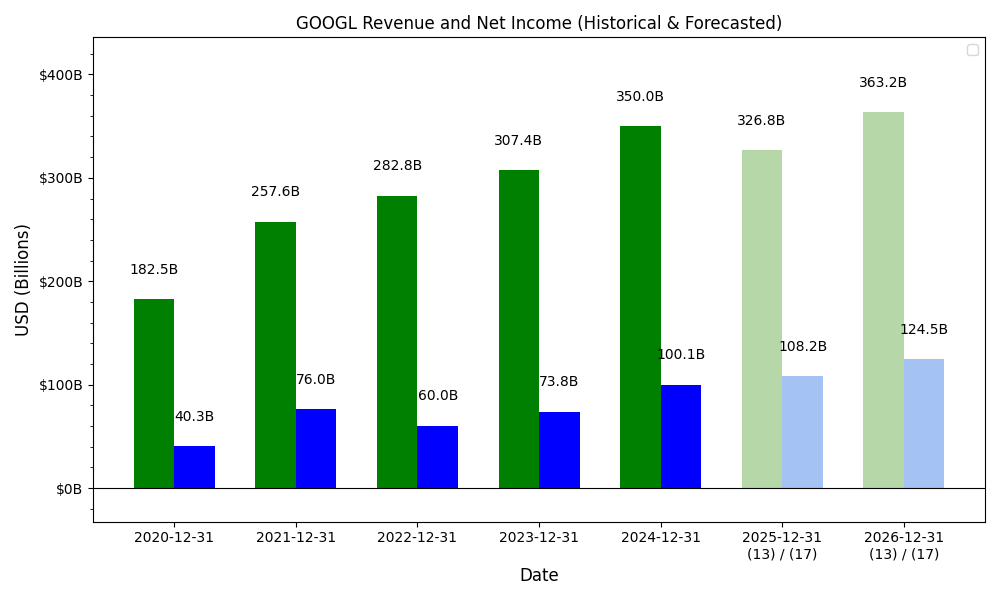
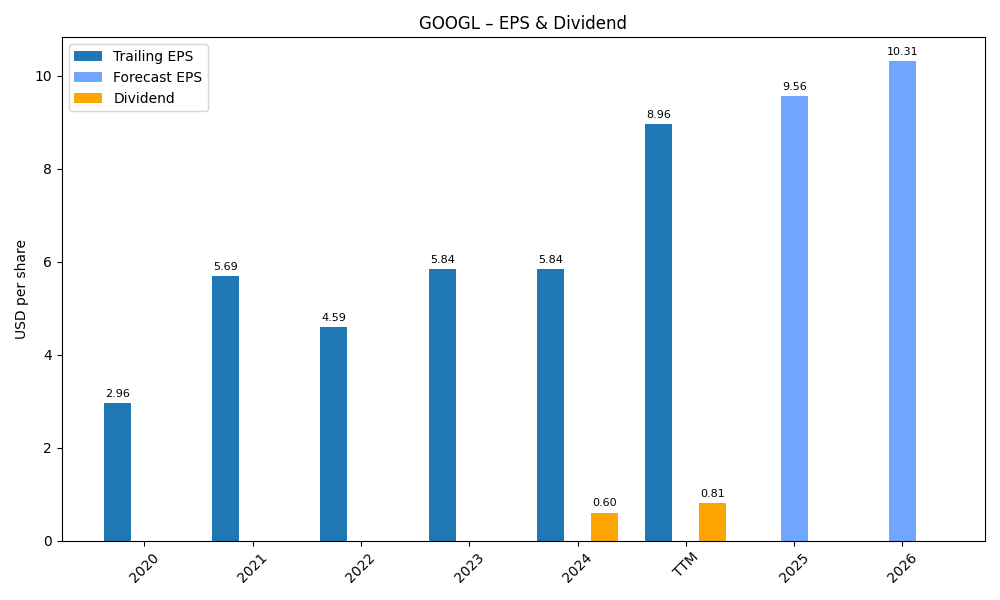
Revenue & Net Income
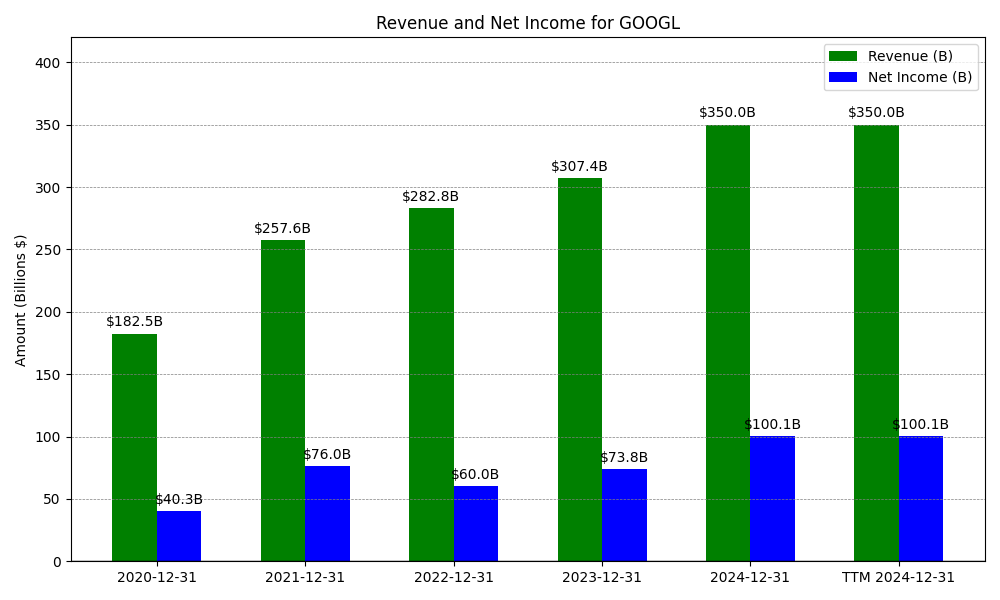
| Date | Revenue | Net_Income | EPS | Last_Updated | Revenue_Change | Net_Income_Change | EPS_Change | |
|---|---|---|---|---|---|---|---|---|
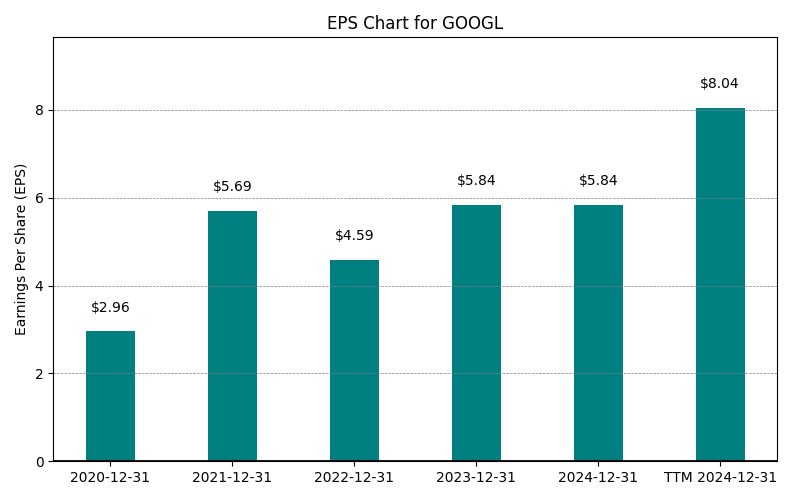
| 0 | 2020-12-31 | $182,527M | $40,269M | $2.96 | 2024-02-03 03:17:10 | N/A | N/A | N/A |
| 1 | 2021-12-31 | $257,637M | $76,033M | $4.59 | 2026-02-06 08:35:26 | 41.2% | 88.8% | 55.2% |
| 2 | 2022-12-31 | $282,836M | $59,972M | $4.59 | 2026-05-29 09:08:46 | 9.8% | -21.1% | 0.0% |
| 3 | 2023-12-31 | $307,394M | $73,795M | $5.84 | 2026-05-29 09:08:46 | 8.7% | 23.0% | 27.2% |
| 4 | 2024-12-31 | $350,018M | $100,118M | $8.13 | 2026-05-29 09:08:46 | 13.9% | 35.7% | 39.2% |
| 5 | 2025-12-31 | $402,836M | $132,170M | $10.91 | 2026-05-29 09:08:46 | 15.1% | 32.0% | 34.2% |
| 6 | TTM 2026-03-31 | $422,499M | $160,208M | $13.11 | 2026-05-01 08:41:52 | 4.9% | 21.2% | 20.2% |
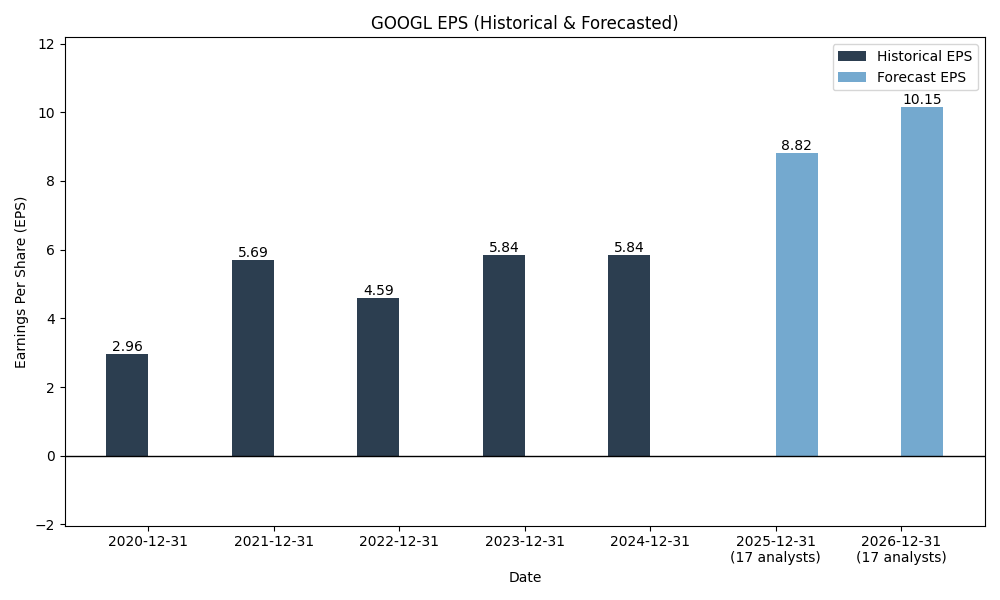
EPS
Forecasts
Y/Y % Change
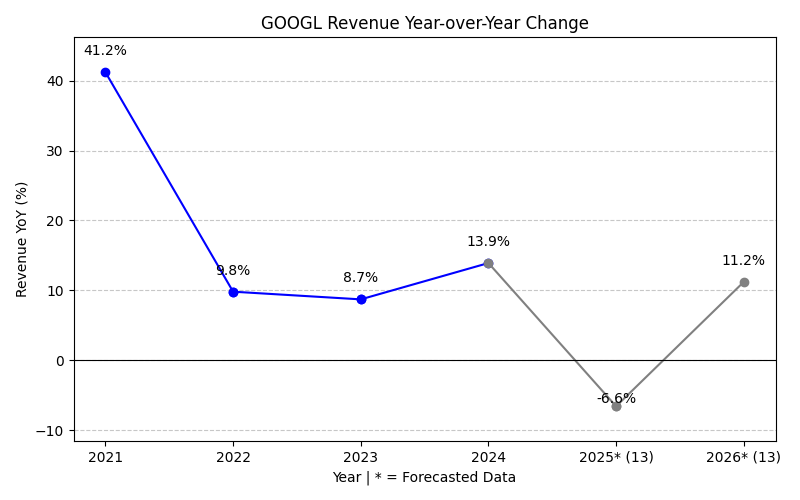
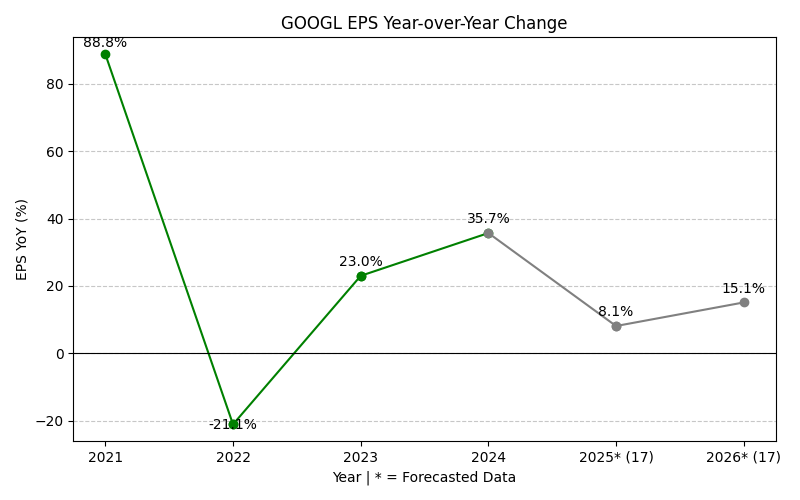
GOOGL Year-over-Year Growth
| 2020 | 2021 | 2022 | 2023 | 2024 | 2025 | 2026 | 2027 | Average | |
|---|---|---|---|---|---|---|---|---|---|
| Revenue Growth (%) | 41.2% | 9.8% | 8.7% | 13.9% | 15.1% | 20.8% | 18.4% | 18.3% | |
| Revenue Analysts (#) | 0 | 0 | 0 | 0 | 0 | 0 | 52 | 53 | |
| EPS Growth (%) | 88.8% | -21.1% | 23.0% | 35.7% | 32.0% | 30.5% | 1.5% | 27.2% | |
| EPS Analysts (#) | 0 | 0 | 0 | 0 | 0 | 0 | 52 | 55 |
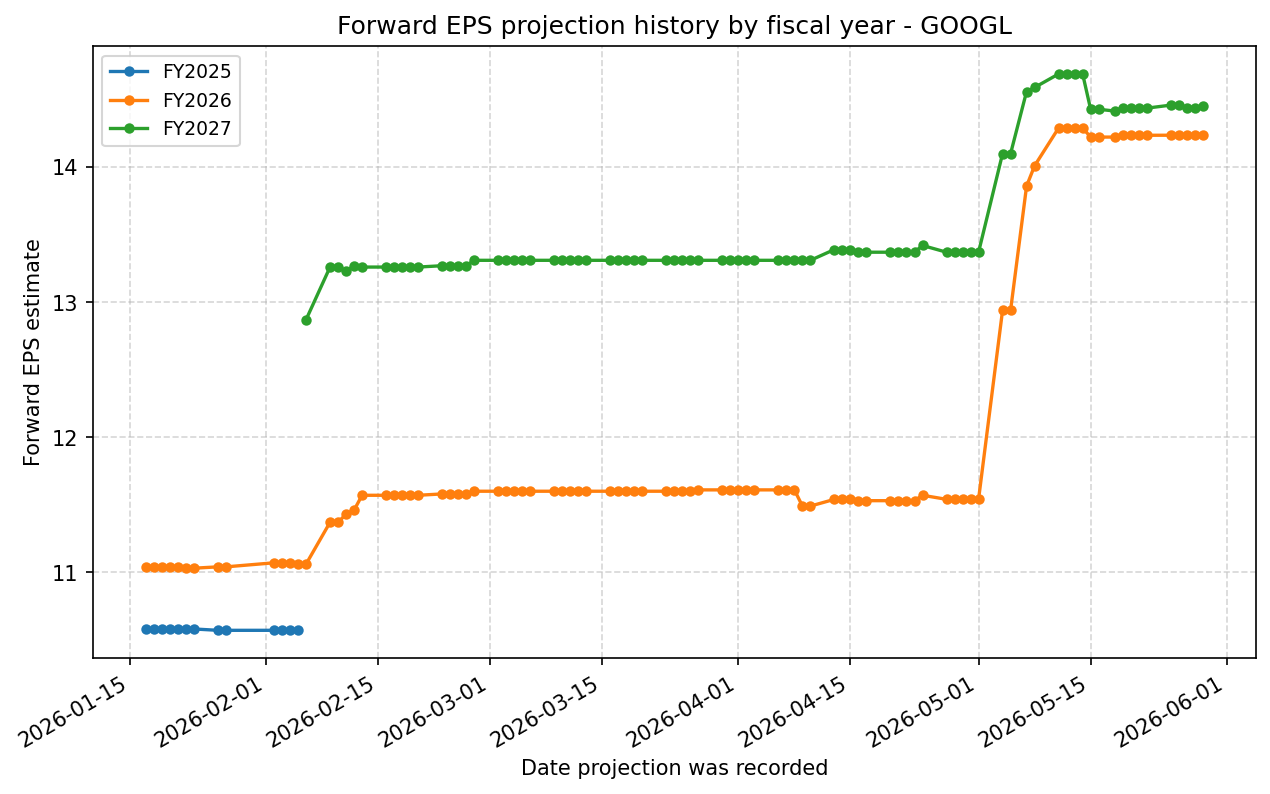
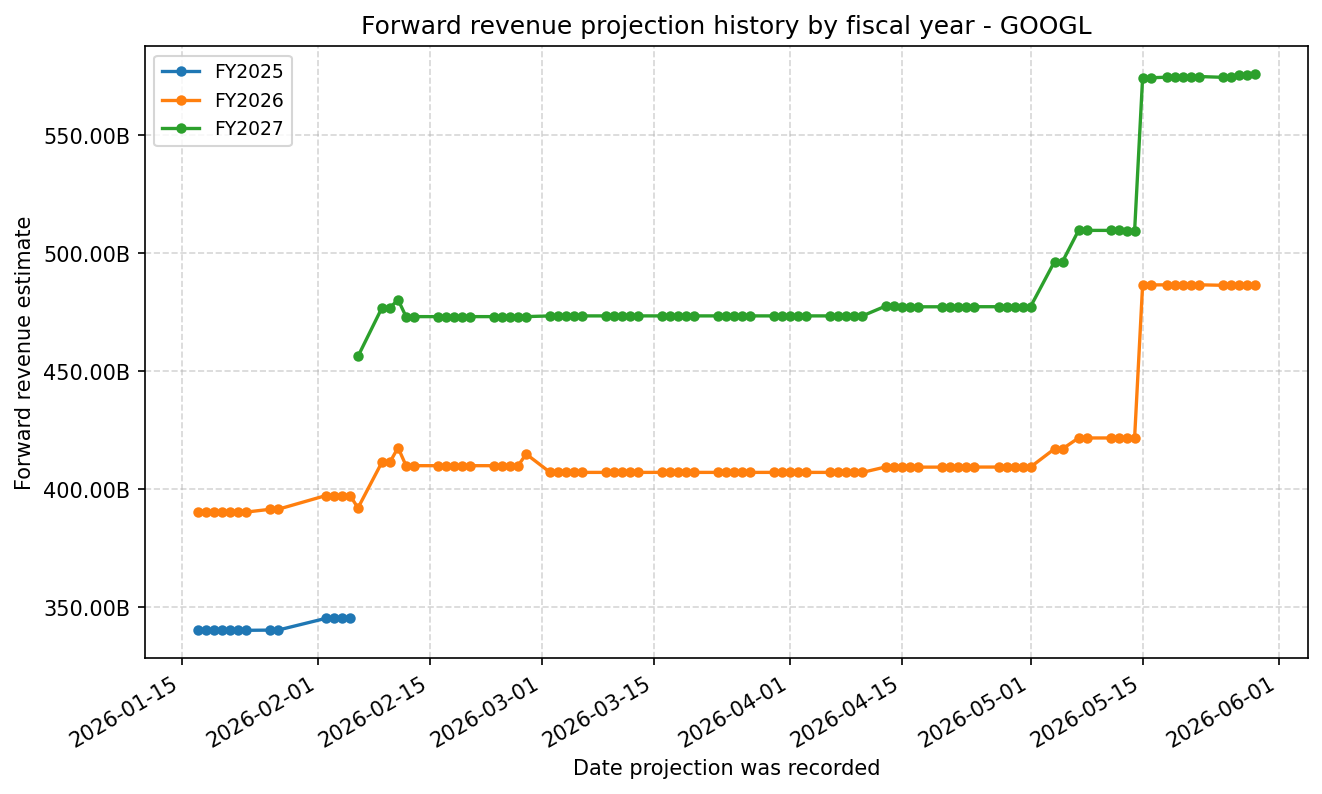
Forward Estimate History
How the next-FY EPS and revenue estimates have drifted over time. One line per fiscal year – past lines end when that FY became current.
Expenses
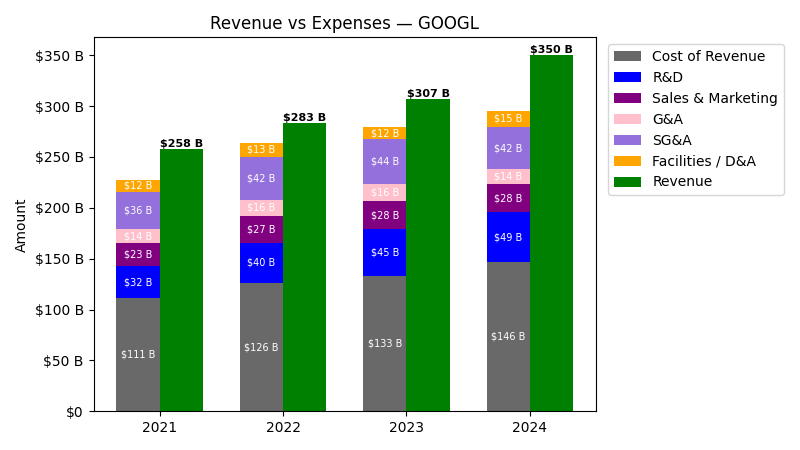
| Year | Revenue ($) | Cost of Revenue ($) | R&D ($) | Sales & Marketing ($) | G&A ($) | SG&A ($) | Facilities / D&A ($) |
|---|---|---|---|---|---|---|---|
| 2022 | $282.8B | $112.7B | $39.5B | $26.6B | $15.7B | $42.3B | $13.5B |
| 2023 | $307.4B | $121.4B | $45.4B | $27.9B | $16.4B | $44.3B | $11.9B |
| 2024 | $350.0B | $131.0B | $49.3B | $27.8B | $14.2B | $42.0B | $15.3B |
| 2025 | $402.8B | $141.4B | $61.1B | $28.7B | $21.5B | $50.2B | $21.1B |
| TTM | $422.5B | $144.3B | $64.6B | $30.1B | $22.2B | $52.4B | $23.1B |
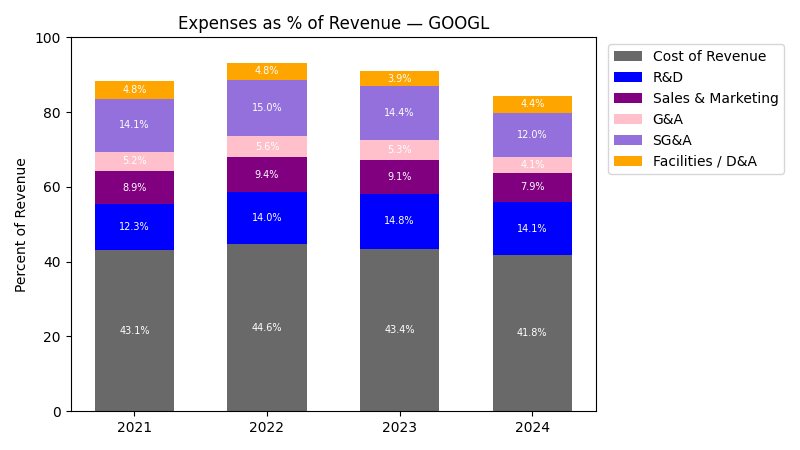
| Year | Revenue Change (%) | Cost of Revenue Change (%) | R&D Change (%) | Sales & Marketing Change (%) | G&A Change (%) | SG&A Change (%) | Facilities / D&A Change (%) |
|---|---|---|---|---|---|---|---|
| 2023 | 8.68 | 7.68 | 15.01 | 5.08 | 4.46 | 4.85 | -11.35 |
| 2024 | 13.87 | 7.92 | 8.58 | -0.39 | -13.62 | -5.29 | 28.17 |
| 2025 | 15.09 | 7.94 | 23.84 | 3.18 | 51.41 | 19.48 | 38.04 |
| TTM | 4.88 | 2.06 | 5.69 | 5.00 | 3.50 | 4.36 | 9.44 |
No unmapped expenses.
Segment Performance
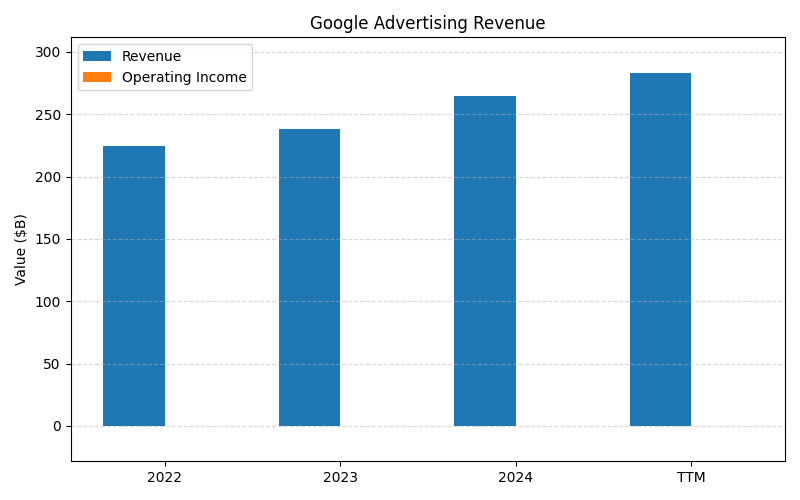
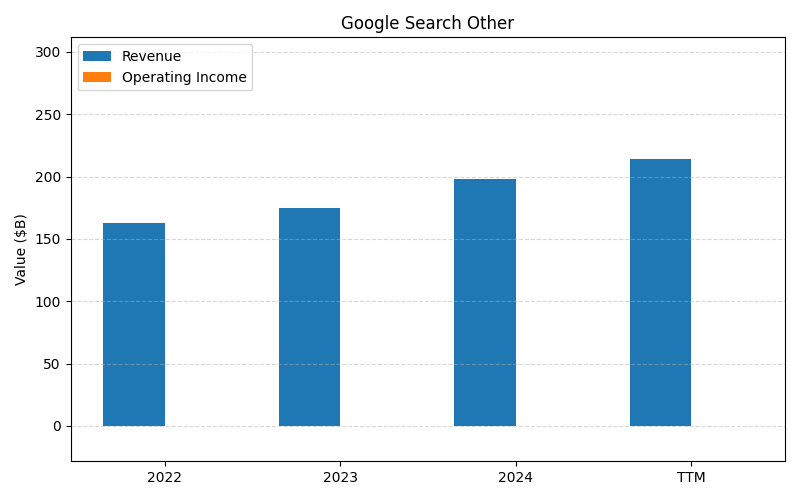
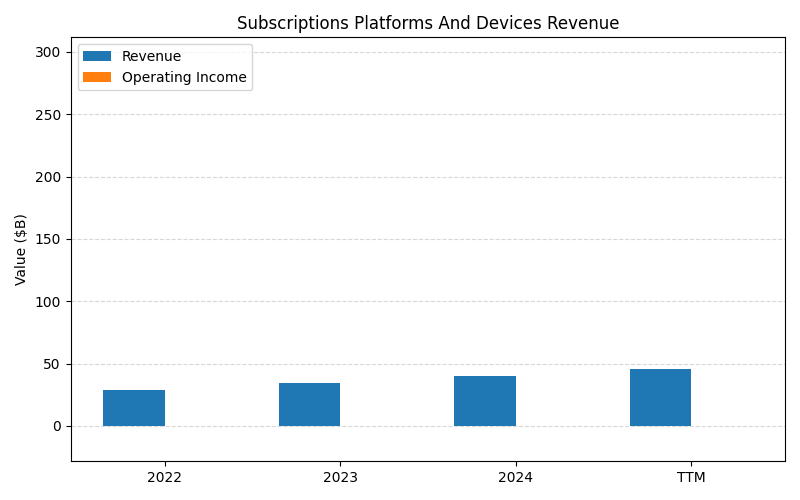
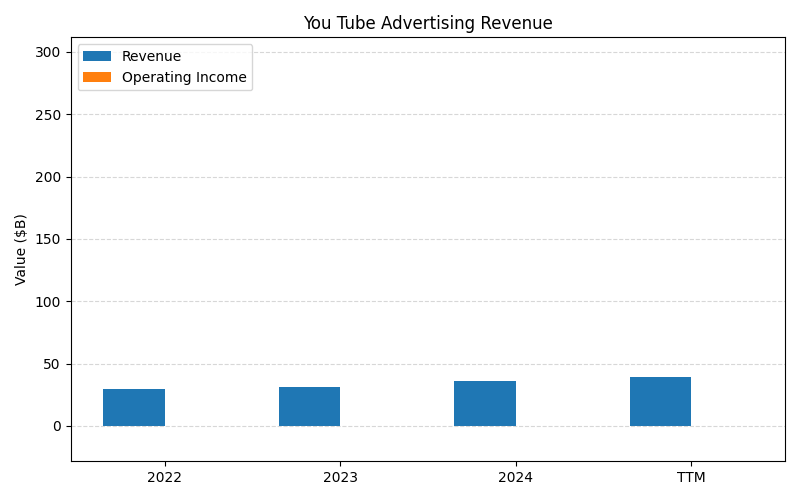
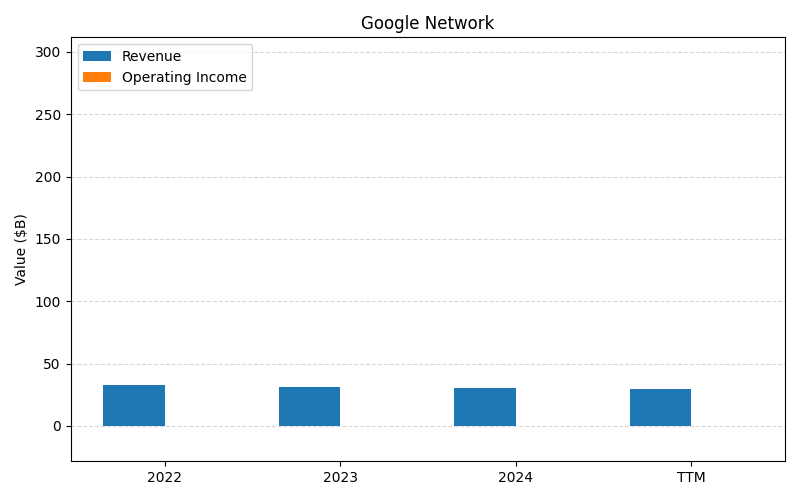
SEGMENTS v2025-09-09 · 2026-05-29 09:08 UTC — Units: $B. Rows list fiscal years (last 3 + TTM) with revenue for each segment; the final row shows the TTM revenue mix (operating income columns display “—” where mix is not applicable).
| Year | Google Advertising Revenue Rev | Google Search Other Rev | Subscriptions Platforms And Devices Revenue Rev | You Tube Advertising Revenue Rev | Google Network Rev | Total Rev |
|---|---|---|---|---|---|---|
| 2023 | 237.9B | 175B | 34.7B | 31.5B | 31.3B | 510.4B |
| 2024 | 264.6B | 198.1B | 40.3B | 36.1B | 30.4B | 569.5B |
| 2025 | 294.7B | 224.5B | 48B | 40.4B | 29.8B | 637.4B |
| TTM | 703.4B | 533.7B | 111.1B | 95.3B | 74.4B | 1518B |
| % of Total (TTM) | 46.3% | 35.2% | 7.3% | 6.3% | 4.9% | 100% |
Segment Performance (Axis 2)
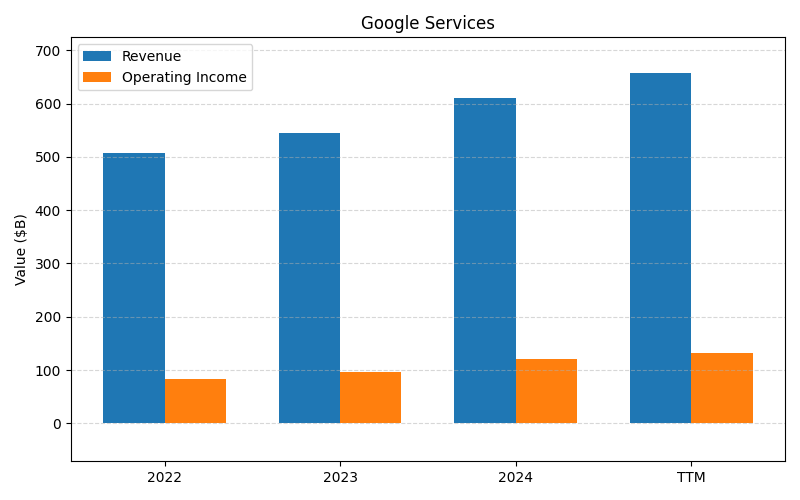
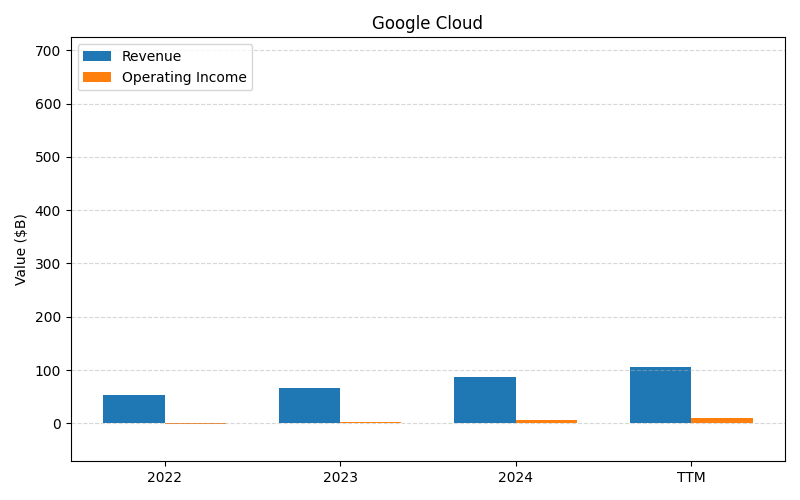
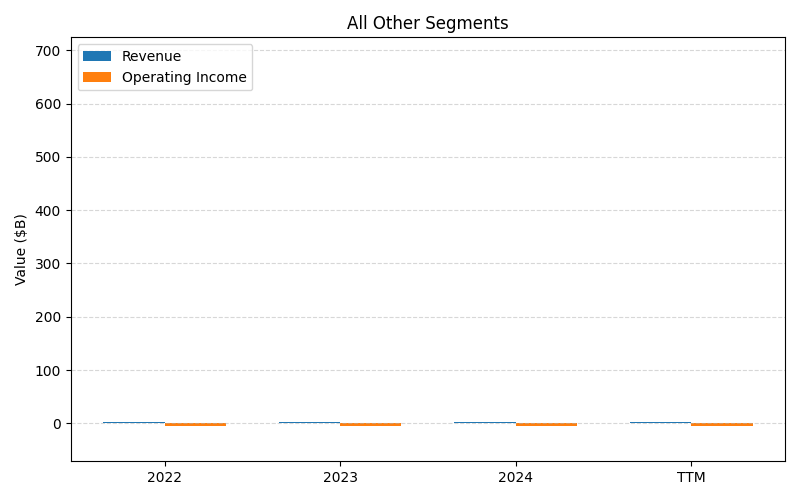
SEGMENTS v2025-09-09 · 2026-05-29 09:08 UTC — Units: $T. Rows list fiscal years (last 3 + TTM) with revenue and operating income for each segment; the final row shows the TTM revenue mix (operating income columns display “—” where mix is not applicable).
| Year | Google Services Rev | Google Services OI | Google Cloud Rev | Google Cloud OI | All Other Segments Rev | All Other Segments OI | Total Rev | Total OI |
|---|---|---|---|---|---|---|---|---|
| 2023 | 0.55T | 0.10T | 0.07T | 0.00T | 0.00T | -0.00T | 0.61T | 0.09T |
| 2024 | 0.61T | 0.12T | 0.09T | 0.01T | 0.00T | -0.00T | 0.70T | 0.12T |
| 2025 | 0.69T | 0.14T | 0.12T | 0.01T | 0.00T | -0.01T | 0.81T | 0.15T |
| TTM | 1.63T | 0.33T | 0.27T | 0.03T | 0.01T | -0.02T | 1.91T | 0.35T |
| % of Total (TTM) | 85.5% | — | 14.1% | — | 0.4% | — | 100% | — |
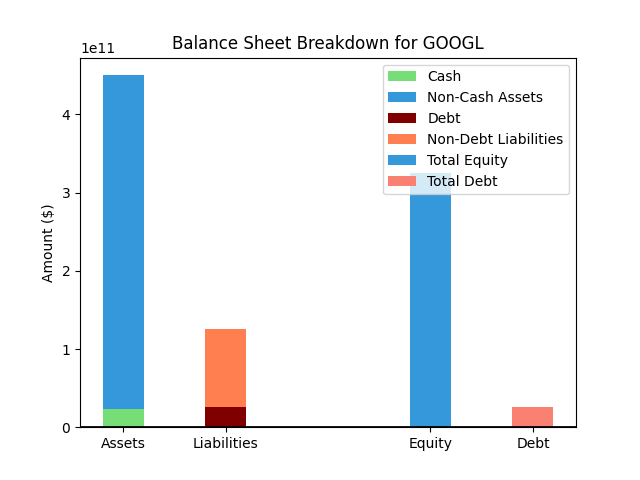
Balance Sheet
| Metric | Value | |
|---|---|---|
| 0 | Total Assets | $703,919M |
| 1 | Cash | $38,063M |
| 2 | Total Liabilities | $225,173M |
| 3 | Total Debt | $90,484M |
| 4 | Total Equity | $478,746M |
| 5 | Debt to Equity Ratio | 0.19 |
EPS & Dividend
Valuation
| Share Price | Treasury Yield | Estimates | Fair Value (P/E) | Fair Value (P/S) | Current P/S | Current P/E |
|---|---|---|---|---|---|---|
| $380.34 | 4.5% | Nicks Growth: 15% Nick's Expected Margin: 25% FINVIZ Growth: 17% |
Nicks: 27 Finviz: 32 |
Nick's: 6.814 | 10.9 | 29.0 |
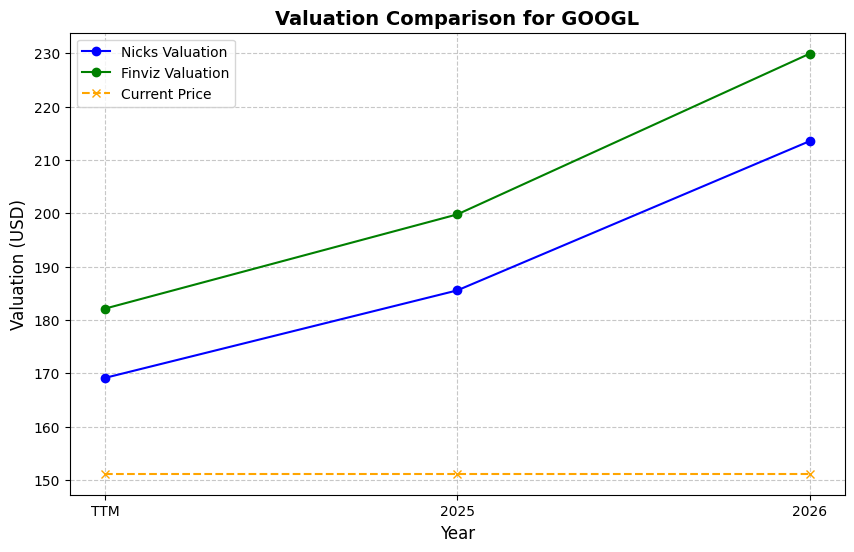
| Basis | Year | Nicks Valuation | Nicks vs Share Price | Finviz Valuation | Finviz vs Share Price |
|---|---|---|---|---|---|
| $13.11 EPS | TTM | $357.33 | -6.0% | $419.60 | 10.3% |
| $14.23 EPS | 2026 | $387.98 | 2.0% | $455.58 | 19.8% |
| $14.45 EPS | 2027 | $393.92 | 3.6% | $462.55 | 21.6% |
Implied Growth
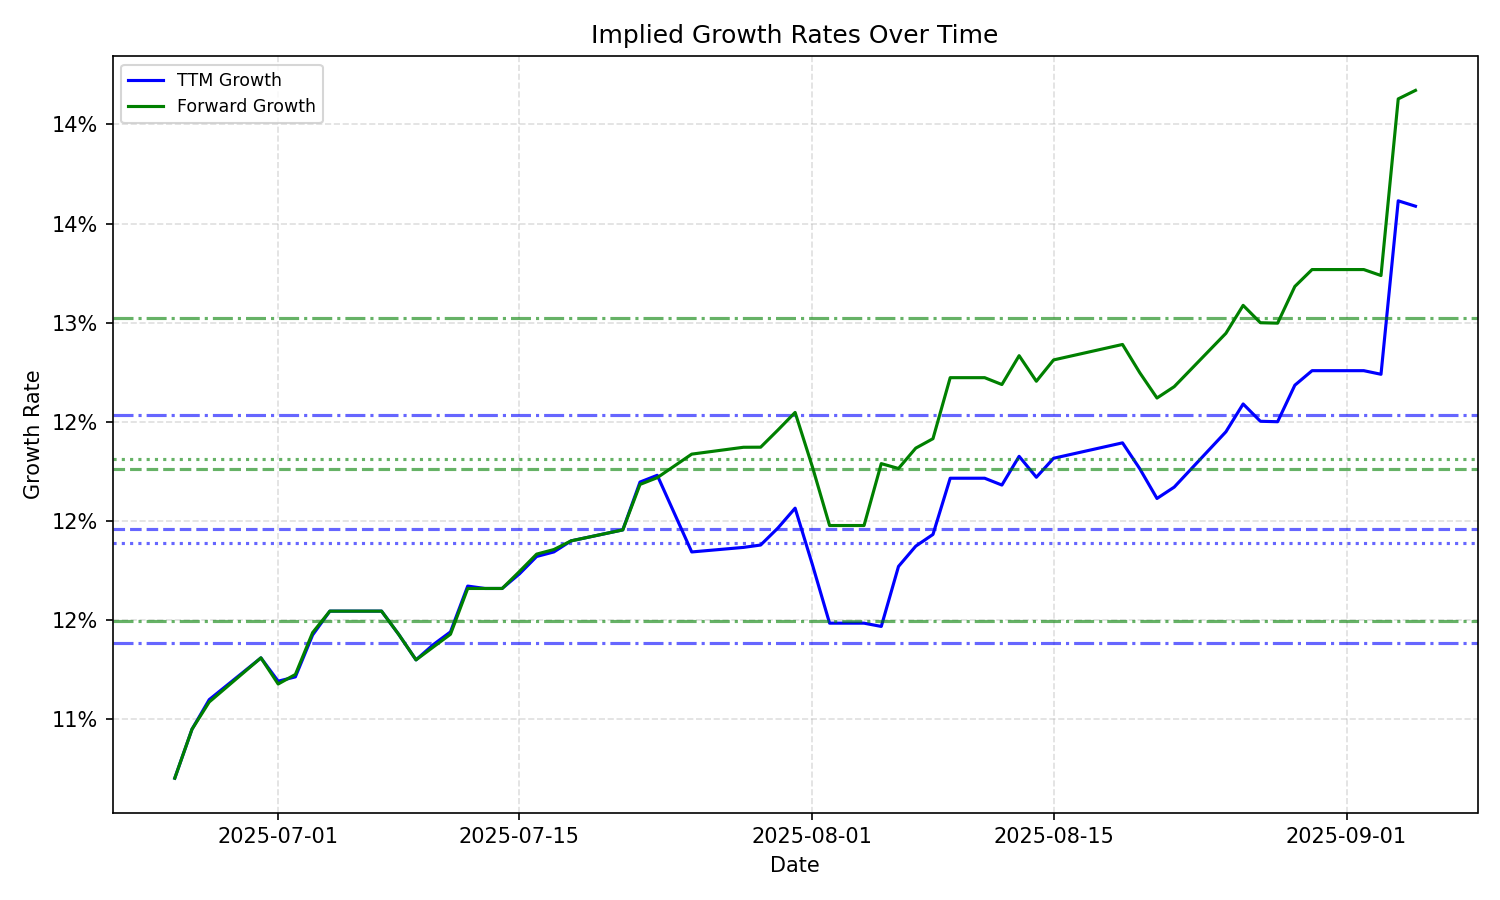
| Average | Median | Std Dev | Current | Percentile | ||||||
|---|---|---|---|---|---|---|---|---|---|---|
| TTM | Forward | TTM | Forward | TTM | Forward | TTM | Forward | TTM | Forward | |
| Timeframe | ||||||||||
| 1 Year | 14.56% | 14.08% | 14.97% | 14.28% | 1.68% | 1.65% | 15.98% | 14.87% | 73.6% | 64.0% |
| 3 Years | 14.56% | 14.08% | 14.97% | 14.28% | 1.68% | 1.65% | 15.98% | 14.87% | 73.6% | 64.0% |
| 5 Years | 14.56% | 14.08% | 14.97% | 14.28% | 1.68% | 1.65% | 15.98% | 14.87% | 73.6% | 64.0% |
| 10 Years | 14.56% | 14.08% | 14.97% | 14.28% | 1.68% | 1.65% | 15.98% | 14.87% | 73.6% | 64.0% |