General Motors Company — GM
| Close Price | Market Cap | P/E Ratio | Forward P/E Ratio | Implied Growth* | Implied Forward Growth* | Dividend | P/B Ratio |
|---|---|---|---|---|---|---|---|
| $83.24 | $75.05B | 30.4 | 5.9 | 16.2% | -0.7% | $0.72 0.9% | 1.2 |
Latest Headlines
- · Why GM Stock Is Rising Even Though The Car Industry Is Shrinking
- · Sector Update: Consumer Stocks Decline Late Afternoon
- · Sector Update: Consumer Stocks Decline Friday Afternoon
- · Why Is Ford Motor (F) Up 37.8% Since Last Earnings Report?
- · 3 Cash-Producing Stocks That Concern Us
- · GM Authorized $6 Billion in Buybacks. Will Ford Match the Move?
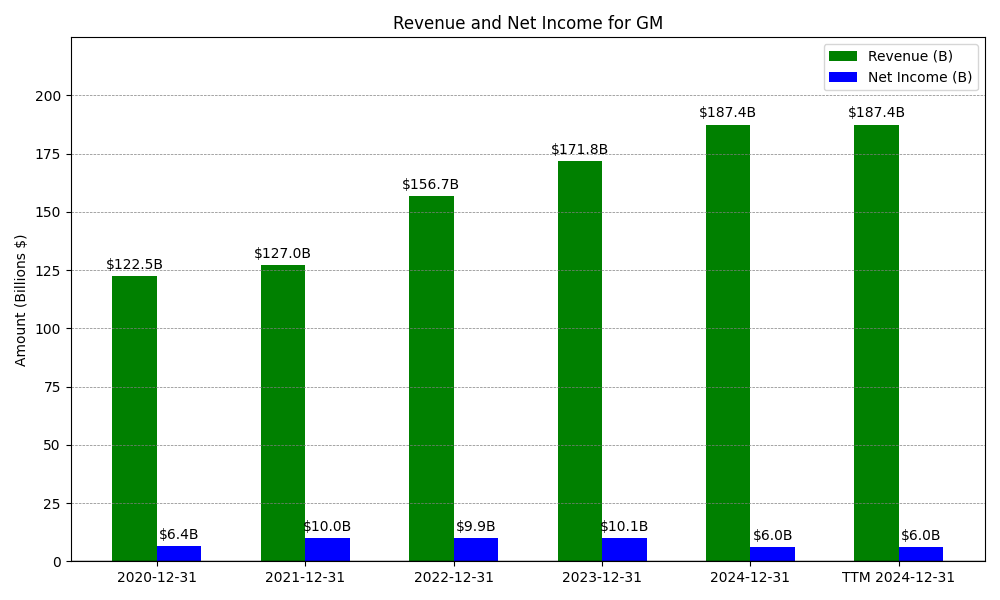
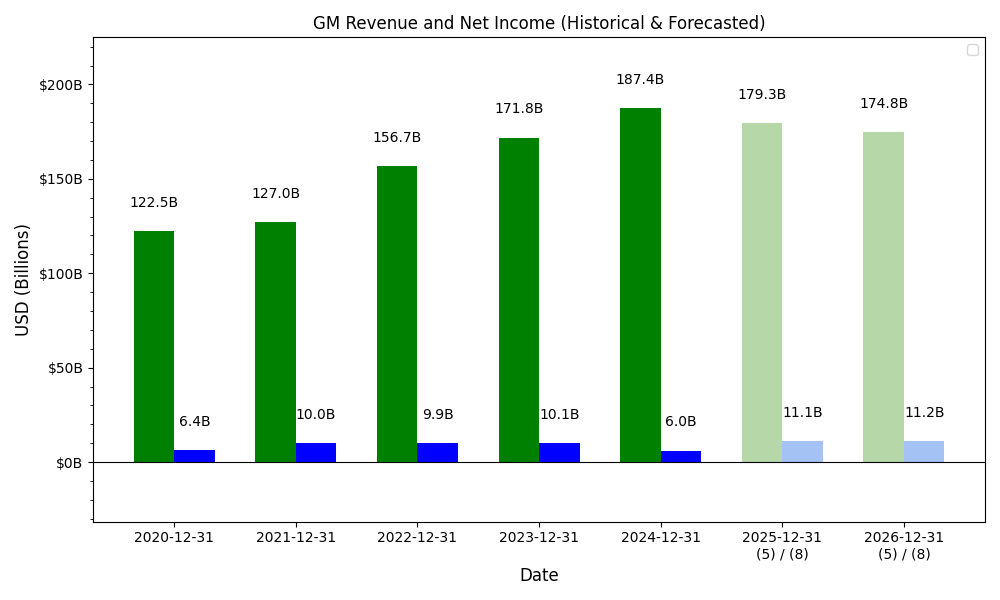
Revenue & Net Income
| Date | Revenue | Net_Income | EPS | Last_Updated | Revenue_Change | Net_Income_Change | EPS_Change | |
|---|---|---|---|---|---|---|---|---|
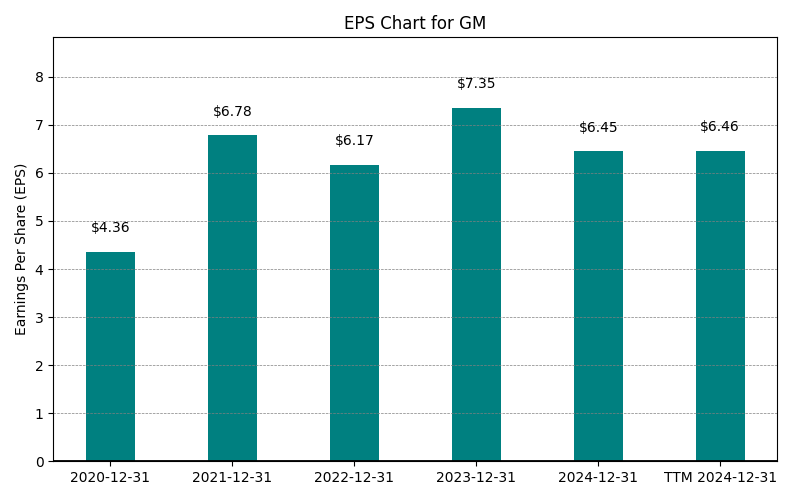
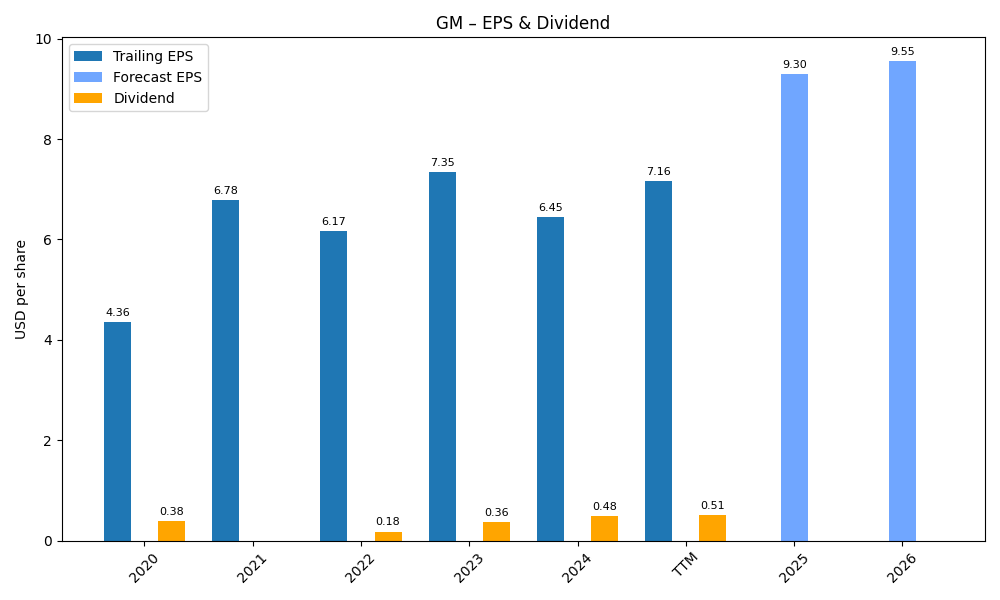
| 0 | 2020-12-31 | $122,485M | $6,427M | $4.36 | 2024-02-03 03:17:10 | N/A | N/A | N/A |
| 1 | 2021-12-31 | $127,004M | $10,019M | $6.78 | 2024-02-03 03:17:10 | 3.7% | 55.9% | 55.5% |
| 2 | 2022-12-31 | $156,735M | $9,934M | $6.17 | 2026-05-29 09:08:32 | 23.4% | -0.8% | -9.0% |
| 3 | 2023-12-31 | $171,842M | $10,127M | $7.35 | 2026-05-29 09:08:32 | 9.6% | 1.9% | 19.1% |
| 4 | 2024-12-31 | $187,442M | $6,008M | $6.45 | 2026-05-29 09:08:32 | 9.1% | -40.7% | -12.2% |
| 5 | 2025-12-31 | $185,019M | $2,697M | $3.33 | 2026-05-29 09:08:32 | -1.3% | -55.1% | -48.4% |
| 6 | TTM 2026-03-31 | $184,623M | $2,539M | $2.74 | 2026-04-30 08:48:35 | -0.2% | -5.9% | -17.7% |
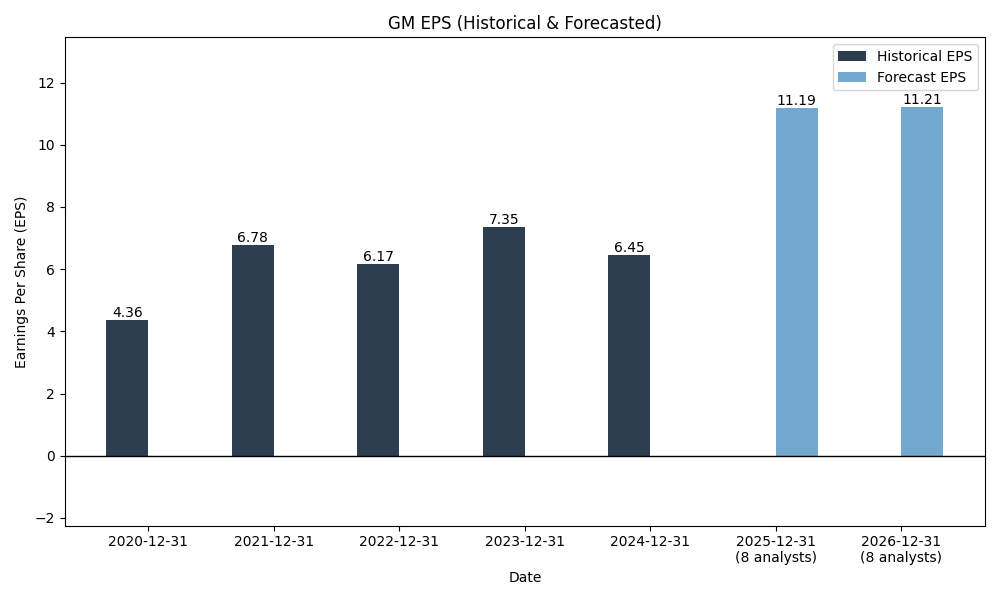
EPS
Forecasts
Y/Y % Change
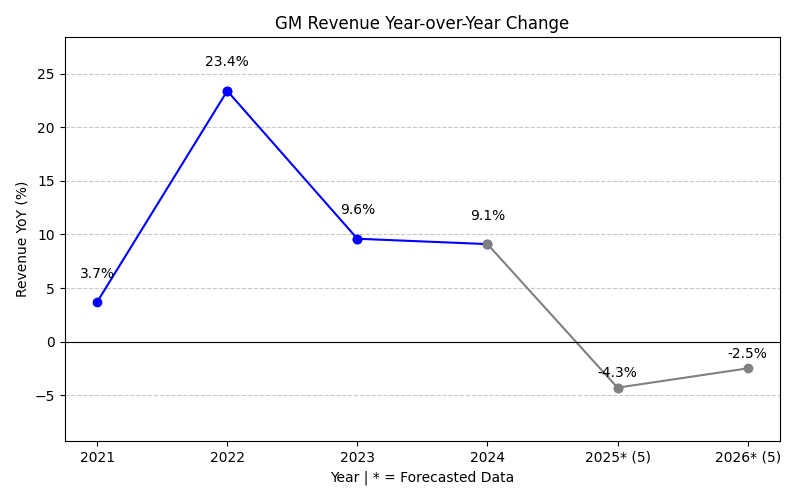
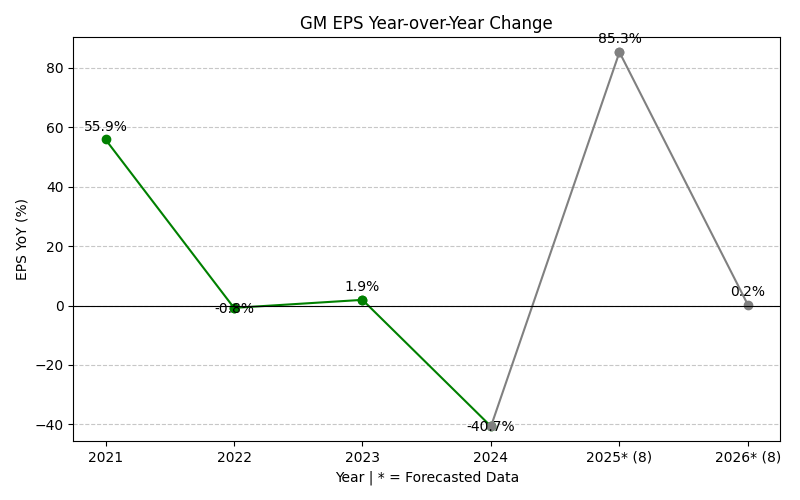
GM Year-over-Year Growth
| 2020 | 2021 | 2022 | 2023 | 2024 | 2025 | 2026 | 2027 | Average | |
|---|---|---|---|---|---|---|---|---|---|
| Revenue Growth (%) | 3.7% | 23.4% | 9.6% | 9.1% | -1.3% | 0.5% | 2.9% | 6.8% | |
| Revenue Analysts (#) | 0 | 0 | 0 | 0 | 0 | 0 | 20 | 20 | |
| EPS Growth (%) | 55.9% | -0.8% | 1.9% | -40.7% | -55.1% | 330.7% | 9.2% | 43.0% | |
| EPS Analysts (#) | 0 | 0 | 0 | 0 | 0 | 0 | 23 | 25 |
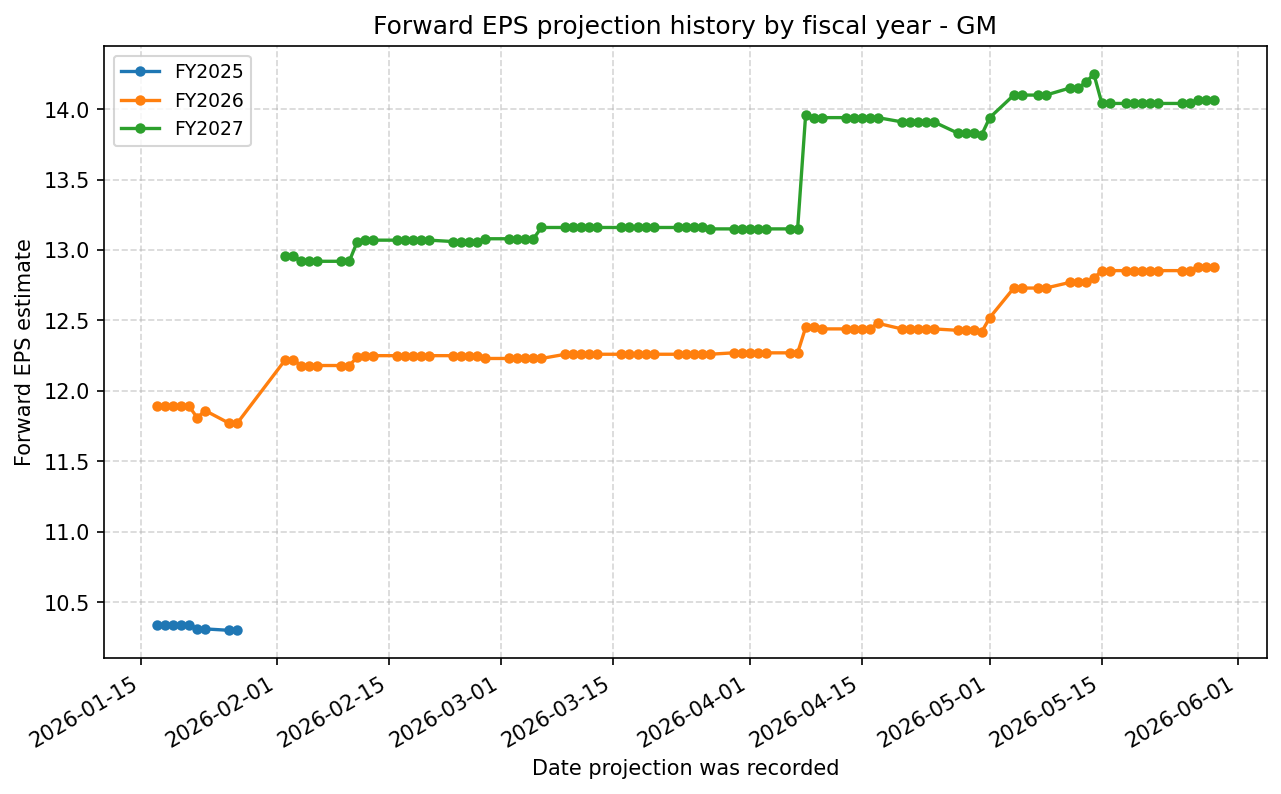
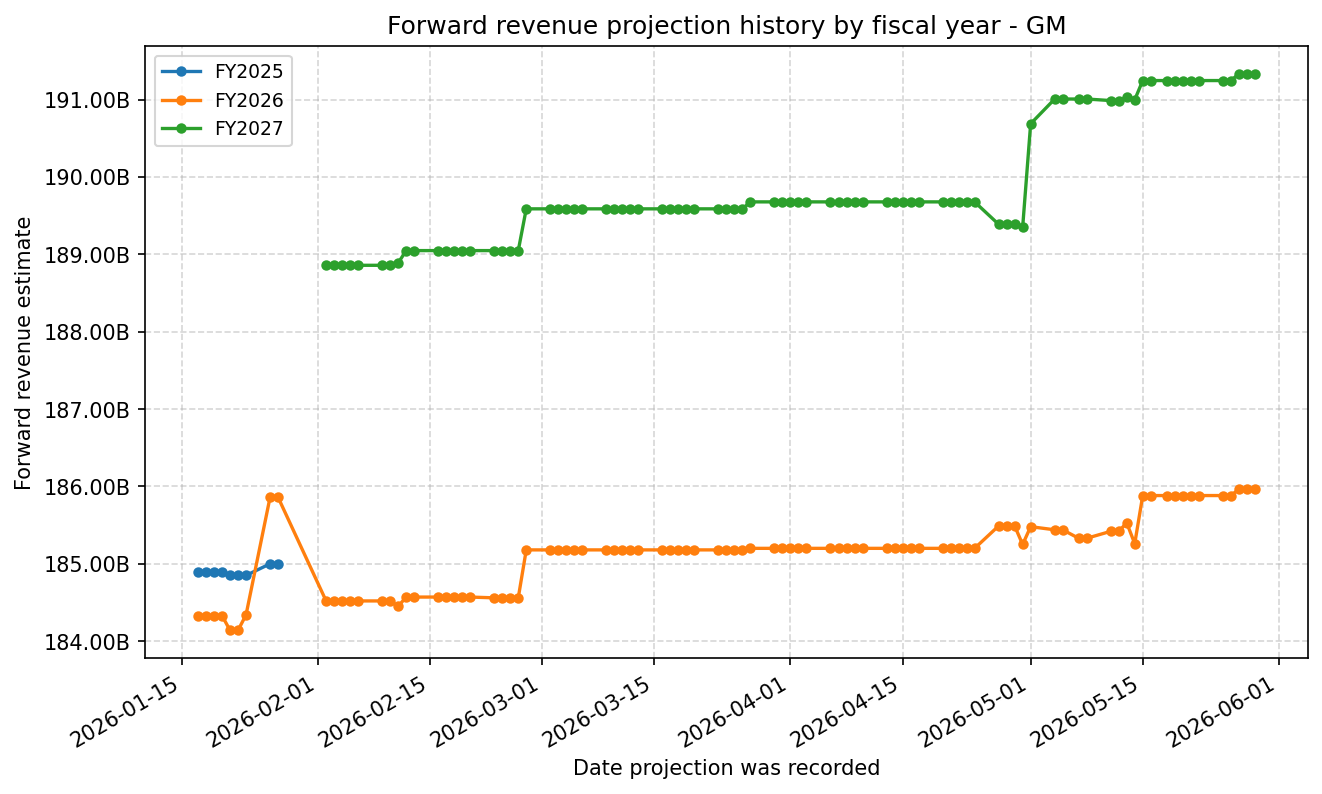
Forward Estimate History
How the next-FY EPS and revenue estimates have drifted over time. One line per fiscal year – past lines end when that FY became current.
Expenses
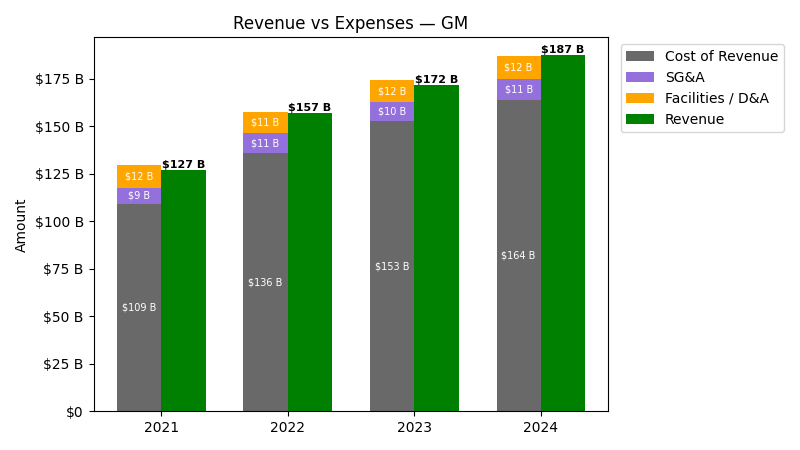
| Year | Revenue ($) | Cost of Revenue ($) | SG&A ($) | Facilities / D&A ($) |
|---|---|---|---|---|
| 2021 | $127.0B | $97.1B | $8.6B | $12.1B |
| 2022 | $156.7B | $124.5B | $10.7B | $11.3B |
| 2023 | $171.8B | $140.8B | $9.8B | $11.9B |
| 2024 | $187.4B | $151.6B | $10.6B | $12.4B |
| 2025 | $185.0B | $158.8B | $8.7B | $14.6B |
| TTM | $184.6B | $158.7B | $8.8B | $14.7B |
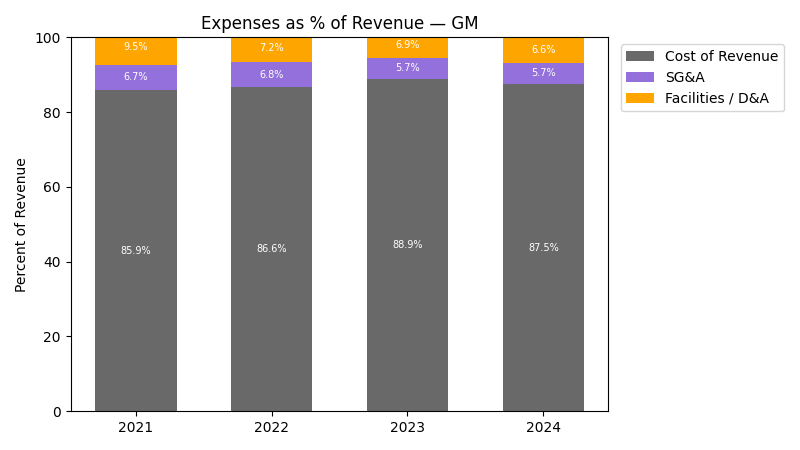
| Year | Revenue Change (%) | Cost of Revenue Change (%) | SG&A Change (%) | Facilities / D&A Change (%) |
|---|---|---|---|---|
| 2022 | 23.41 | 28.21 | 24.70 | -6.31 |
| 2023 | 9.64 | 13.14 | -7.75 | 5.30 |
| 2024 | 9.08 | 7.69 | 7.94 | 4.21 |
| 2025 | -1.29 | 4.74 | -18.21 | 17.75 |
| TTM | -0.21 | -0.09 | 0.97 | 0.66 |
No unmapped expenses.
Segment Performance
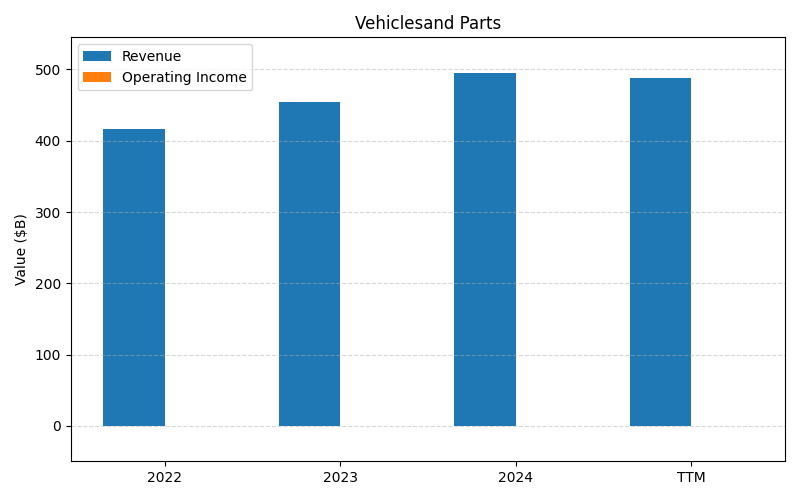
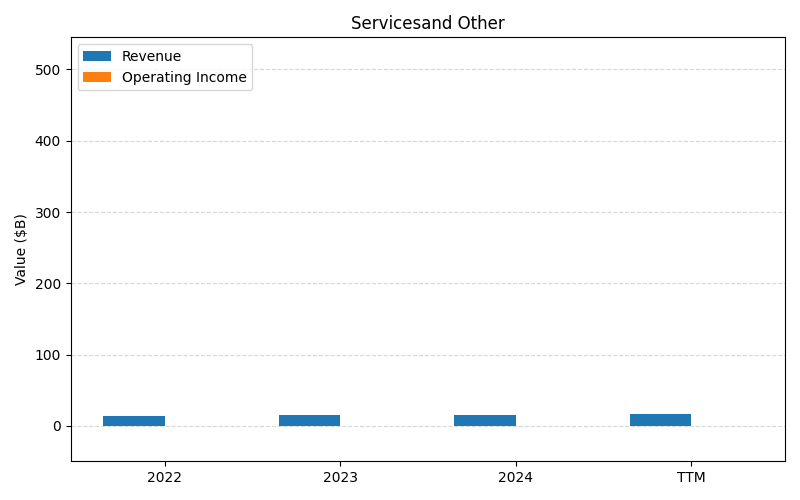
SEGMENTS v2025-09-09 · 2026-05-29 09:08 UTC — Units: $T. Rows list fiscal years (last 3 + TTM) with revenue for each segment; the final row shows the TTM revenue mix (operating income columns display “—” where mix is not applicable).
| Year | Vehiclesand Parts Rev | Servicesand Other Rev | Used Vehicles Rev | Total Rev |
|---|---|---|---|---|
| 2023 | 0.45T | 0.02T | 0.00T | 0.47T |
| 2024 | 0.50T | 0.02T | 0.00T | 0.51T |
| 2025 | 0.48T | 0.02T | 0.01T | 0.50T |
| TTM | 1.20T | 0.04T | 0.01T | 1.26T |
| % of Total (TTM) | 95.8% | 3.3% | 0.9% | 100% |
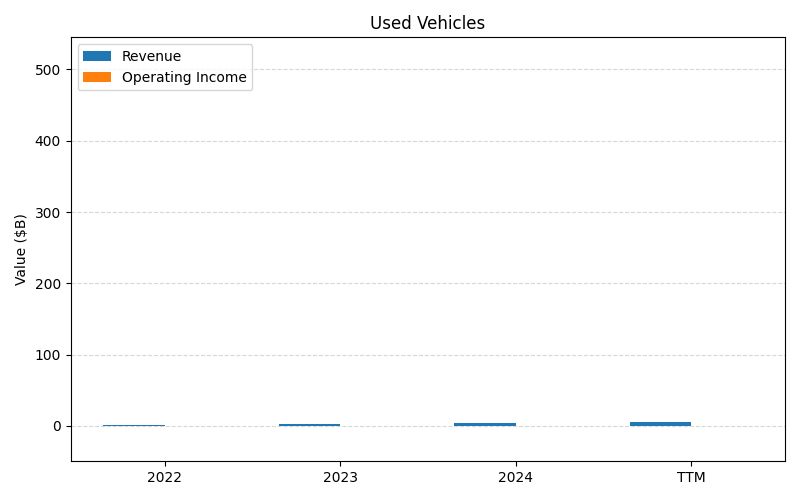
Segment Performance (Axis 2)
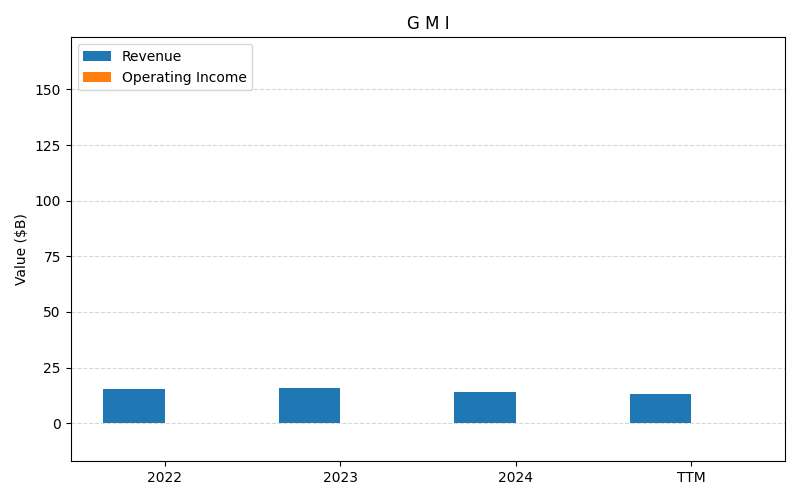
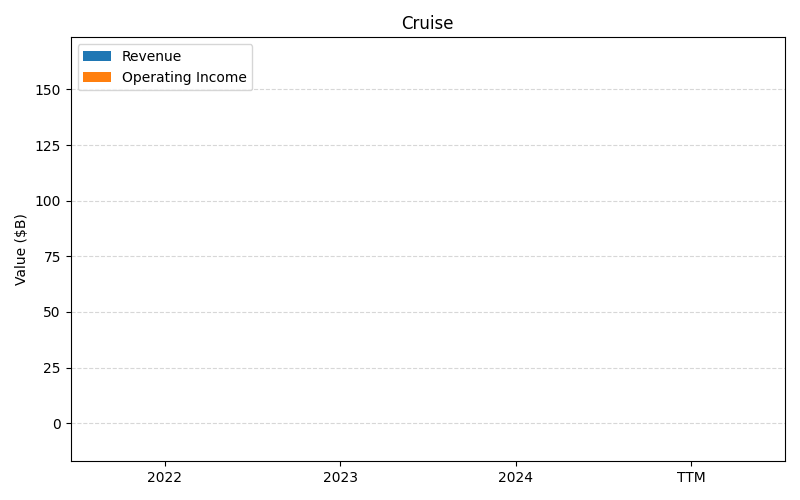
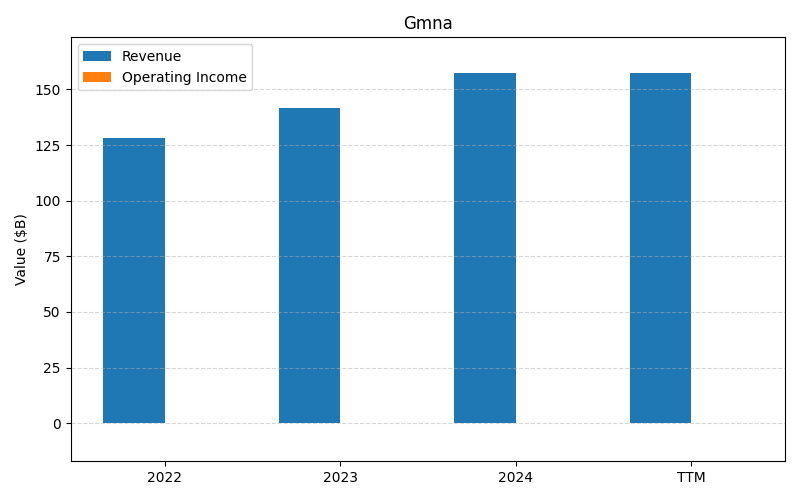
SEGMENTS v2025-09-09 · 2026-05-29 09:08 UTC — Units: $B. Rows list fiscal years (last 3 + TTM) with revenue for each segment; the final row shows the TTM revenue mix (operating income columns display “—” where mix is not applicable).
| Year | G M I Rev | Cruise Rev | Gmna Rev | Total Rev |
|---|---|---|---|---|
| 2023 | 15.9B | 0.10B | 141.4B | 157.5B |
| 2024 | 13.9B | 0.26B | 157.5B | 171.7B |
| 2025 | 13.4B | 0.00B | 154.3B | 167.7B |
| TTM | 32.6B | 0.36B | – | 33B |
| % of Total (TTM) | 98.9% | 1.1% | – | 100% |
Balance Sheet
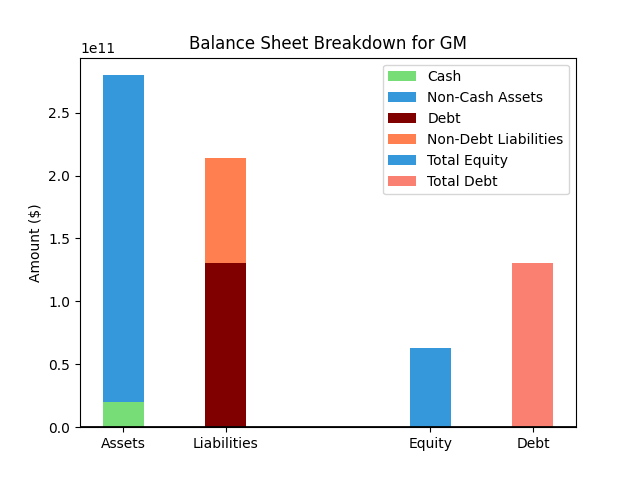
| Metric | Value | |
|---|---|---|
| 0 | Total Assets | $280,974M |
| 1 | Cash | $19,800M |
| 2 | Total Liabilities | $216,279M |
| 3 | Total Debt | $127,756M |
| 4 | Total Equity | $62,659M |
| 5 | Debt to Equity Ratio | 2.04 |
EPS & Dividend
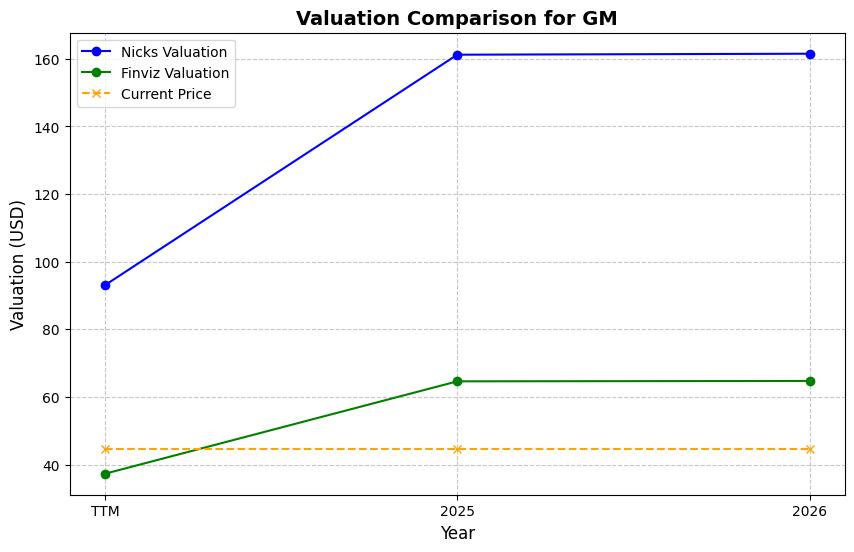
Valuation
| Share Price | Treasury Yield | Estimates | Fair Value (P/E) | Fair Value (P/S) | Current P/S | Current P/E |
|---|---|---|---|---|---|---|
| $83.24 | 4.5% | Nicks Growth: 5% Nick's Expected Margin: 6% FINVIZ Growth: 13% |
Nicks: 11 Finviz: 22 |
Nick's: 0.634 | 0.4 | 30.4 |
| Basis | Year | Nicks Valuation | Nicks vs Share Price | Finviz Valuation | Finviz vs Share Price |
|---|---|---|---|---|---|
| $2.74 EPS | TTM | $28.94 | -65.2% | $61.42 | -26.2% |
| $12.88 EPS | 2026 | $136.04 | 63.4% | $288.77 | 246.9% |
| $14.07 EPS | 2027 | $148.56 | 78.5% | $315.34 | 278.8% |
Implied Growth
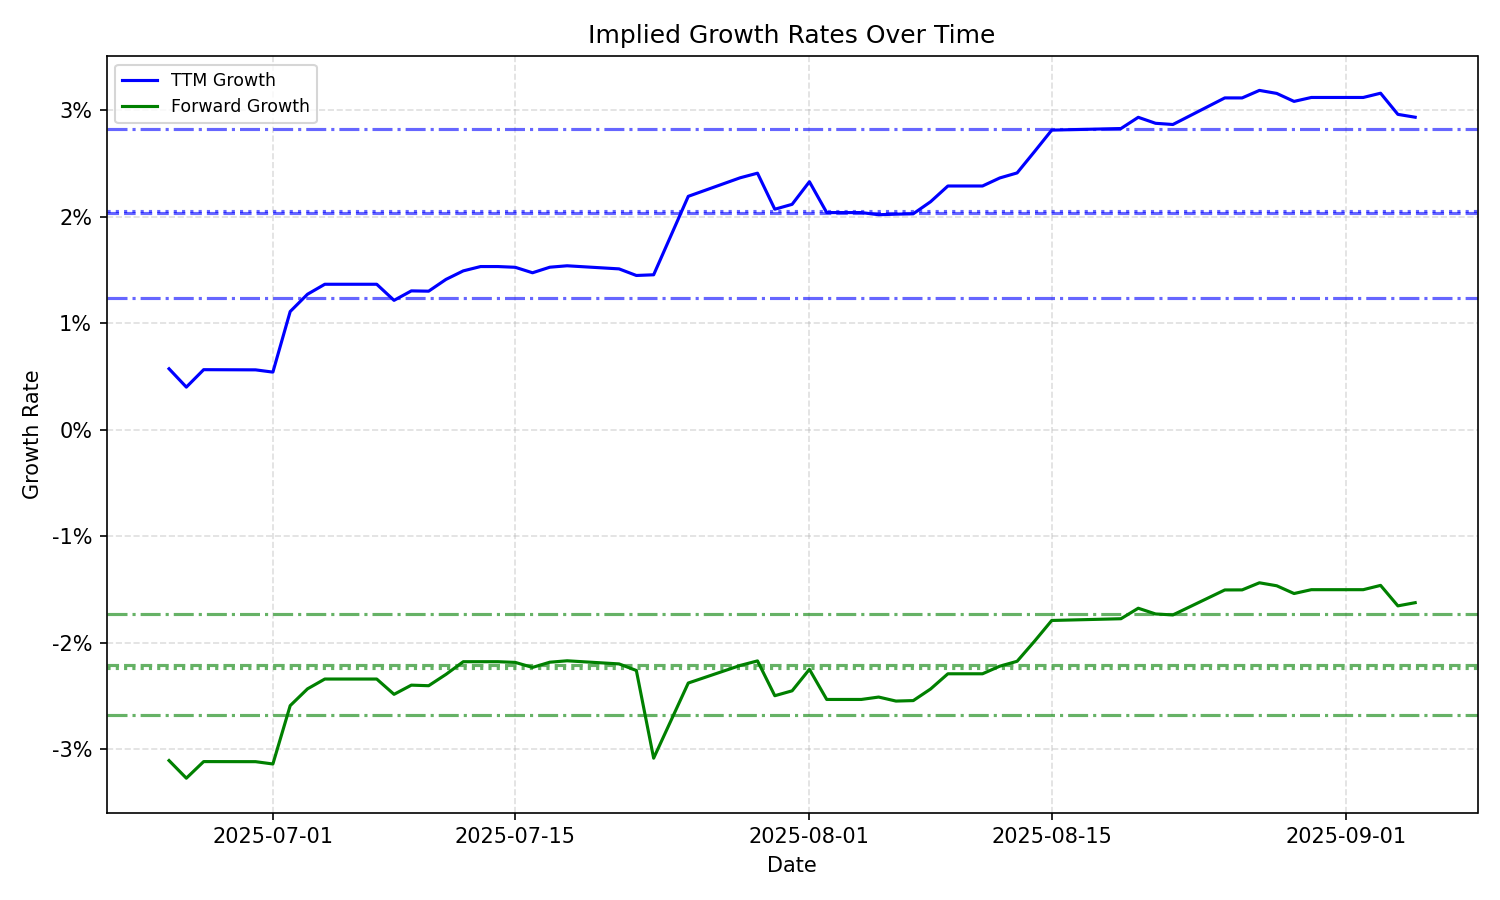
| Average | Median | Std Dev | Current | Percentile | ||||||
|---|---|---|---|---|---|---|---|---|---|---|
| TTM | Forward | TTM | Forward | TTM | Forward | TTM | Forward | TTM | Forward | |
| Timeframe | ||||||||||
| 1 Year | 7.72% | -1.15% | 7.34% | -1.46% | 4.95% | 1.05% | 16.36% | -0.53% | 100.0% | 72.3% |
| 3 Years | 7.72% | -1.15% | 7.34% | -1.46% | 4.95% | 1.05% | 16.36% | -0.53% | 100.0% | 72.3% |
| 5 Years | 7.72% | -1.15% | 7.34% | -1.46% | 4.95% | 1.05% | 16.36% | -0.53% | 100.0% | 72.3% |
| 10 Years | 7.72% | -1.15% | 7.34% | -1.46% | 4.95% | 1.05% | 16.36% | -0.53% | 100.0% | 72.3% |