GameStop Corporation — GME
| Close Price | Market Cap | P/E Ratio | Forward P/E Ratio | Implied Growth* | Implied Forward Growth* | Dividend | P/B Ratio |
|---|---|---|---|---|---|---|---|
| $21.18 | $9.50B | 27.5 | 17.5 | 15.1% | 10.2% | - | 1.7 |
Latest Headlines
- · GameStop Raises eBay Stake in Takeover Fight
- · Nasdaq, S&P 500 Futures Rise Amid Iran Ceasefire Talks, Dell AI Rally: Why HPE, NOW, SMCI, ASTS, GME Are In Focus
- · GameStop Hits 'Add To Cart' On EBAY Stock Again — Raises Exposure To Over 7% As Ryan Cohen Keeps Pressure On
- · GameStop's eBay Pursuit Faces Doubts
- · Analysis-Wall Street awaits GameStop CEO Cohen's next move after eBay rejected takeover bid
- · GameStop & eBay – Activism: Governance from Investor & Board Perspectives: 2nd Princeton CorpGov Forum
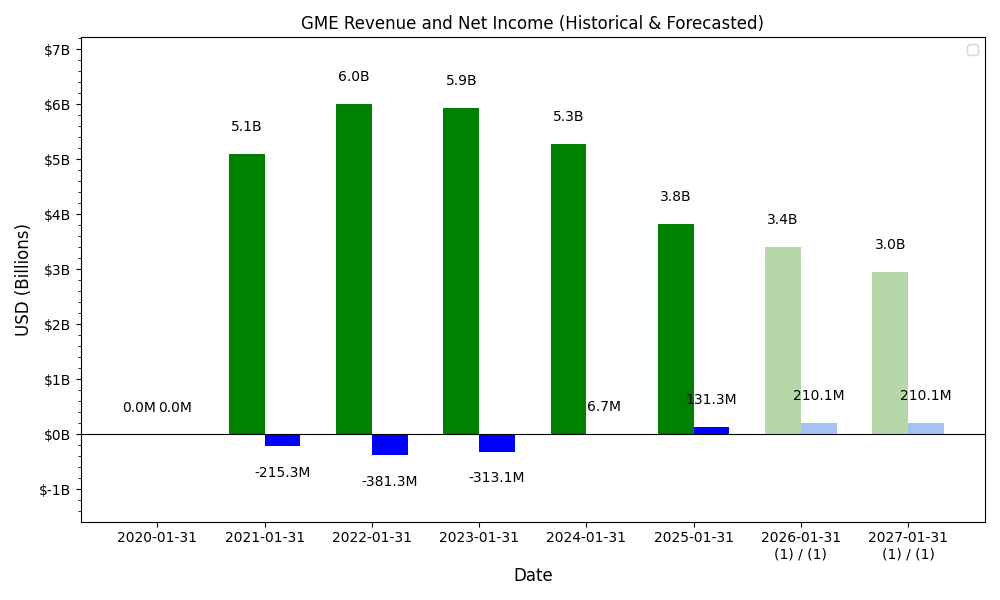
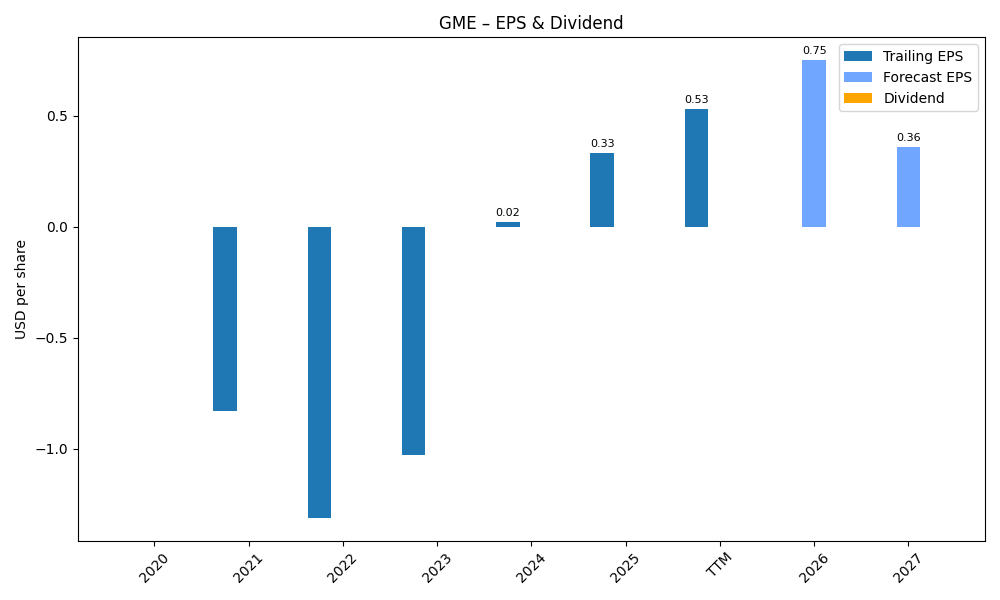
Revenue & Net Income
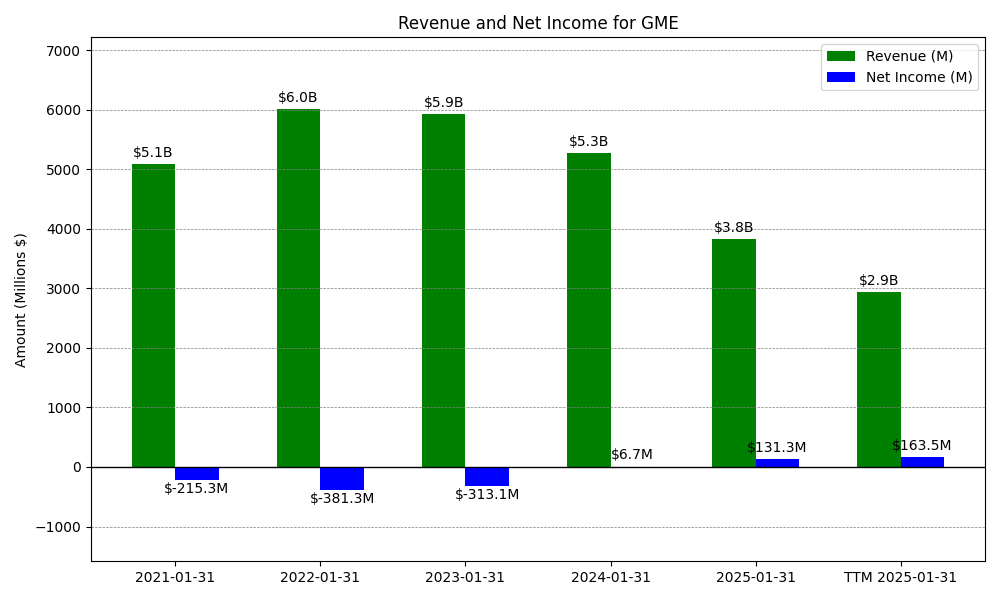
| Date | Revenue | Net_Income | EPS | Last_Updated | Revenue_Change | Net_Income_Change | EPS_Change | |
|---|---|---|---|---|---|---|---|---|
| 0 | 2020-01-31 | $nanM | $nanM | $nan | 2024-05-25 08:20:08 | N/A | N/A | N/A |
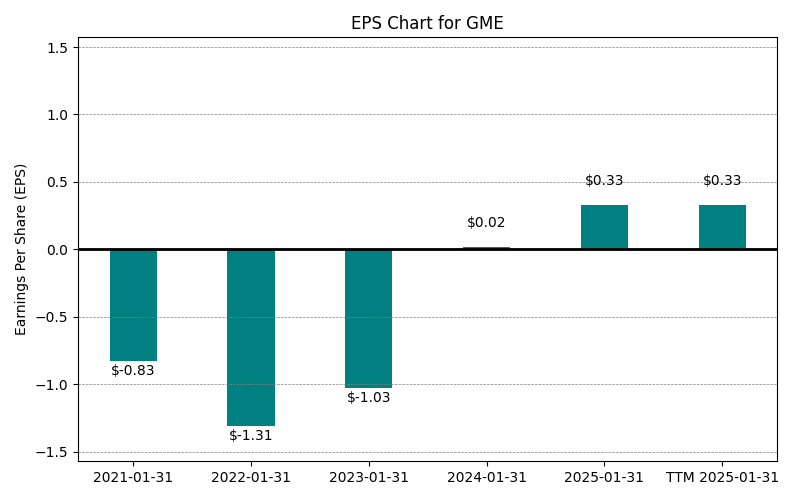
| 1 | 2021-01-31 | $5,090M | $-215M | $-0.83 | 2024-03-30 17:34:25 | N/A | N/A | N/A |
| 2 | 2022-01-31 | $6,011M | $-381M | $-1.31 | 2026-03-30 13:18:09 | 18.1% | 77.1% | 58.6% |
| 3 | 2023-01-31 | $5,927M | $-313M | $-1.03 | 2026-05-29 09:08:40 | -1.4% | -17.9% | -21.5% |
| 4 | 2024-01-31 | $5,273M | $7M | $0.02 | 2026-05-29 09:08:40 | -11.0% | -102.1% | -101.9% |
| 5 | 2025-01-31 | $3,823M | $131M | $0.33 | 2026-05-29 09:08:40 | -27.5% | 1859.7% | 1550.0% |
| 6 | 2026-01-31 | $3,630M | $418M | $0.93 | 2026-05-29 09:08:40 | -5.1% | 218.7% | 181.8% |
| 7 | TTM 2026-01-31 | $3,630M | $418M | $0.77 | 2026-03-31 08:51:28 | 0.0% | 0.0% | -17.2% |
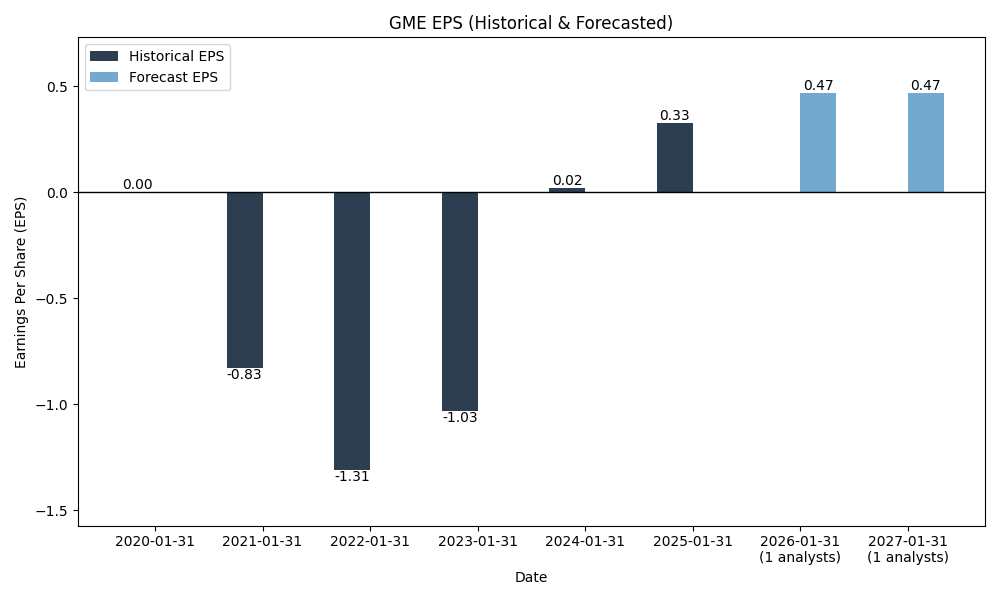
EPS
Forecasts
Y/Y % Change
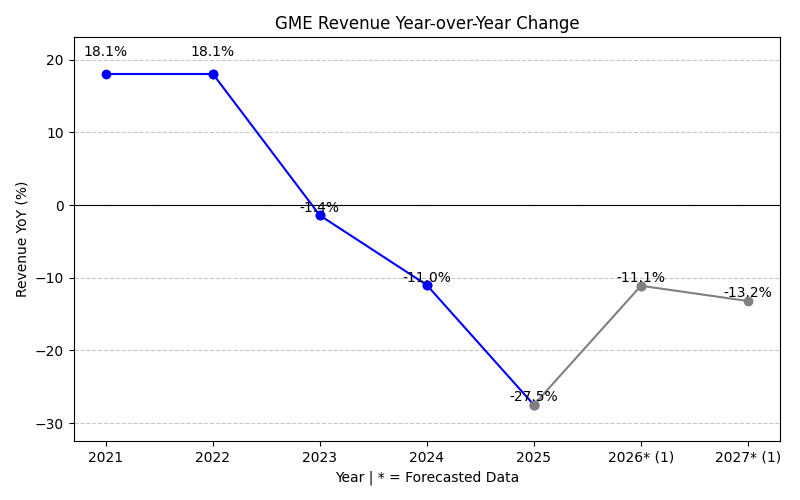
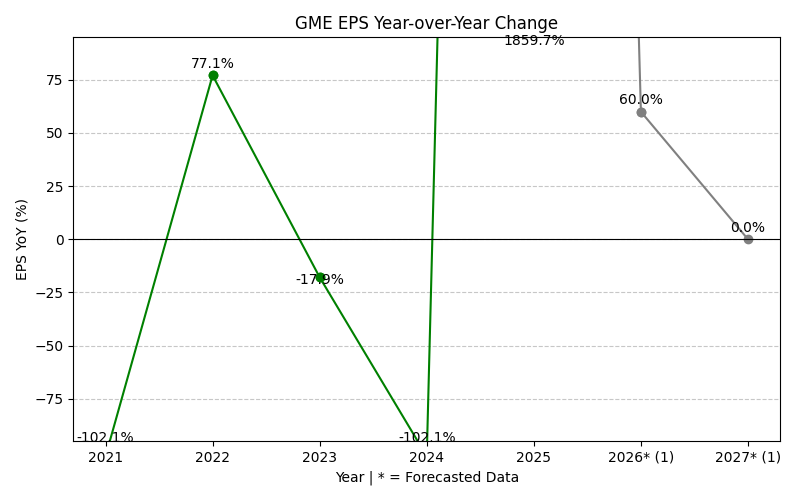
GME Year-over-Year Growth
| 2020 | 2021 | 2022 | 2023 | 2024 | 2025 | 2026 | 2027 | 2028 | Average | |
|---|---|---|---|---|---|---|---|---|---|---|
| Revenue Growth (%) | inf% | 18.1% | -1.4% | -11.0% | -27.5% | -5.1% | -100.0% | inf% | ||
| Revenue Analysts (#) | 0 | 0 | 0 | 0 | 0 | 0 | 0 | 0 | 0 | |
| EPS Growth (%) | -inf% | 77.1% | -17.9% | -102.1% | 1859.7% | 218.7% | 16.9% | 11.0% | -inf% | |
| EPS Analysts (#) | 0 | 0 | 0 | 0 | 0 | 0 | 0 | 1 | 1 |
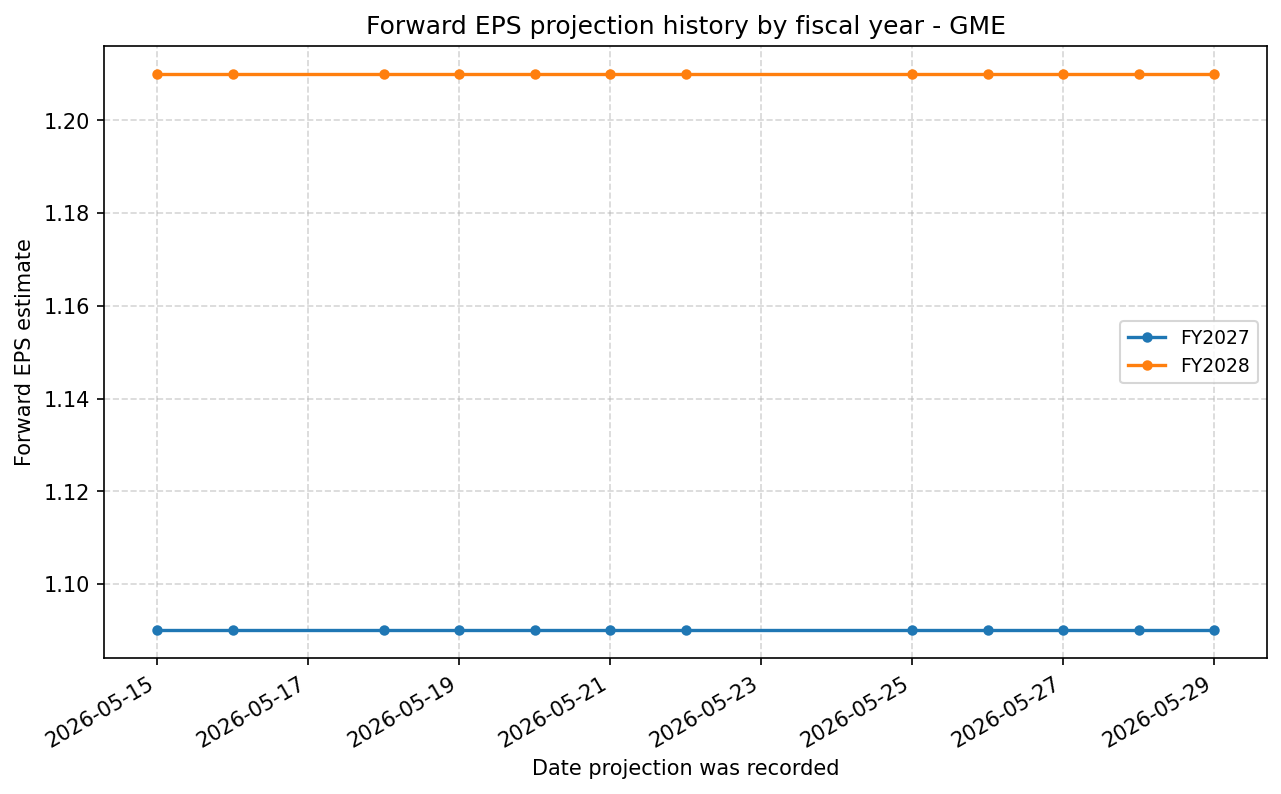
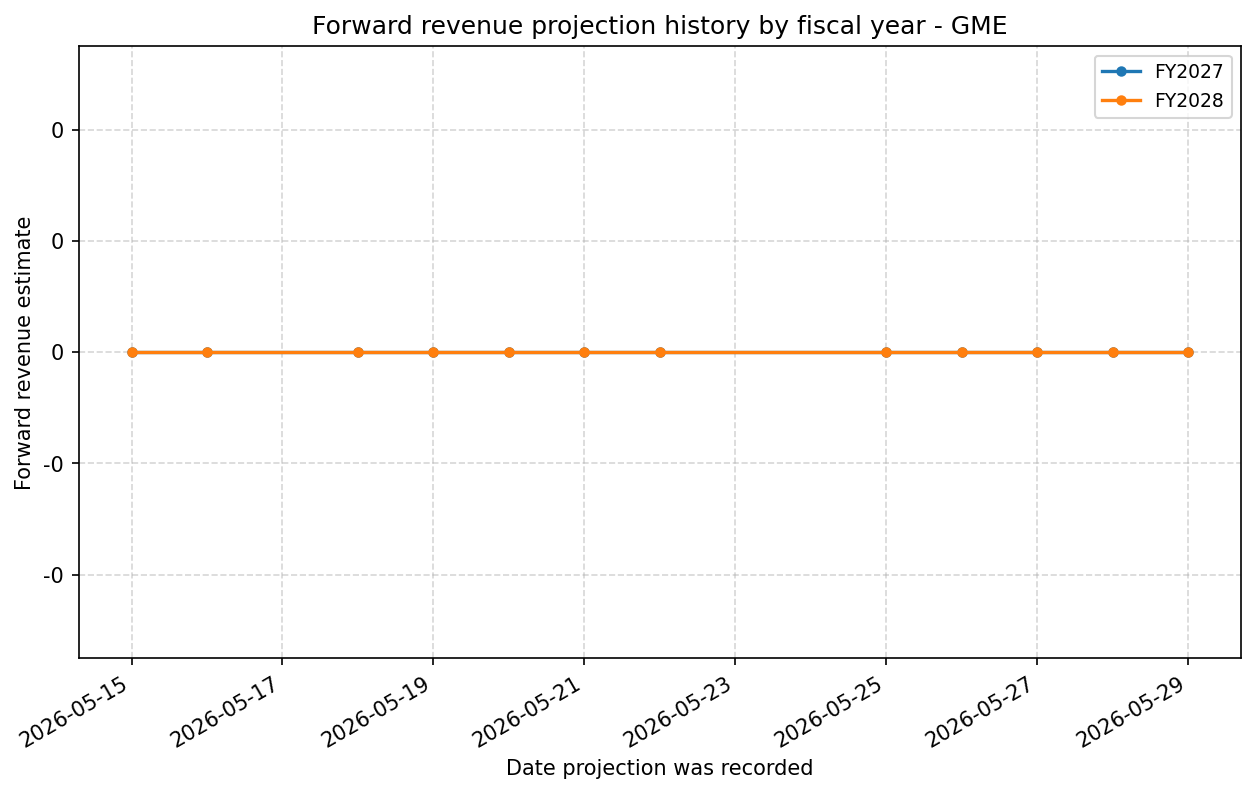
Forward Estimate History
How the next-FY EPS and revenue estimates have drifted over time. One line per fiscal year – past lines end when that FY became current.
Expenses
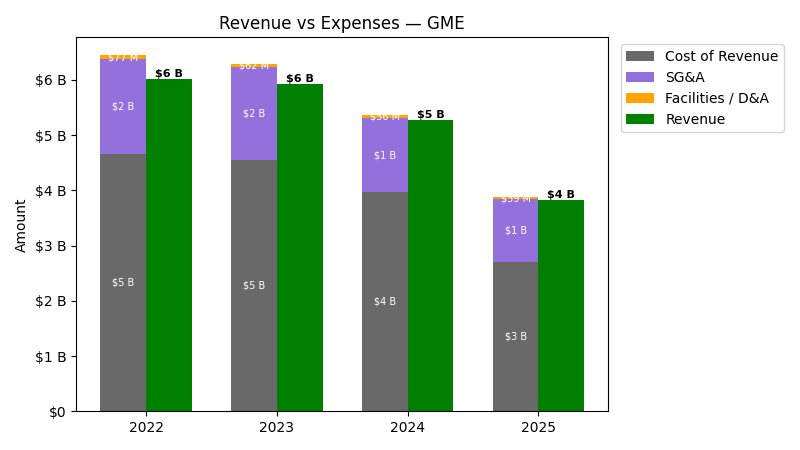
| Year | Revenue ($) | Cost of Revenue ($) | SG&A ($) | Facilities / D&A ($) |
|---|---|---|---|---|
| 2023 | $5.9B | $4.5B | $1.7B | $61.7M |
| 2024 | $5.3B | $3.9B | $1.3B | $56.2M |
| 2025 | $3.8B | $2.7B | $1.1B | $38.9M |
| 2026 | $3.6B | $2.4B | $910.2M | $14.6M |
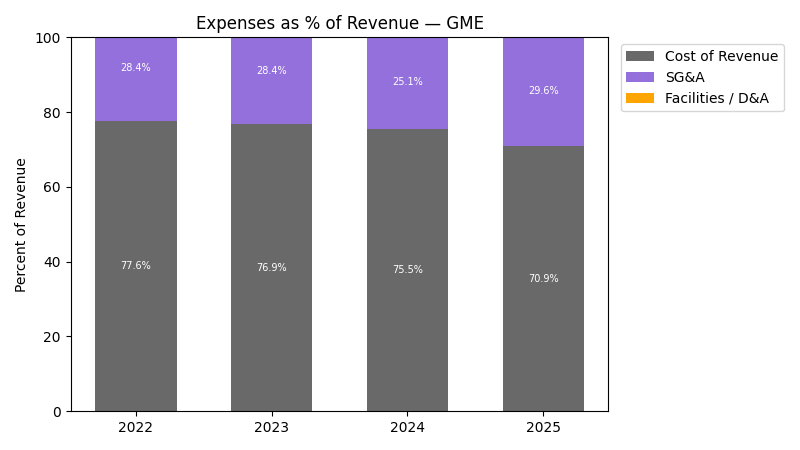
| Year | Revenue Change (%) | Cost of Revenue Change (%) | SG&A Change (%) | Facilities / D&A Change (%) |
|---|---|---|---|---|
| 2024 | -11.04 | -12.71 | -21.24 | -8.91 |
| 2025 | -27.50 | -31.92 | -14.62 | -30.78 |
| 2026 | -5.05 | -9.40 | -19.48 | -62.47 |
No unmapped expenses.
Segment Performance
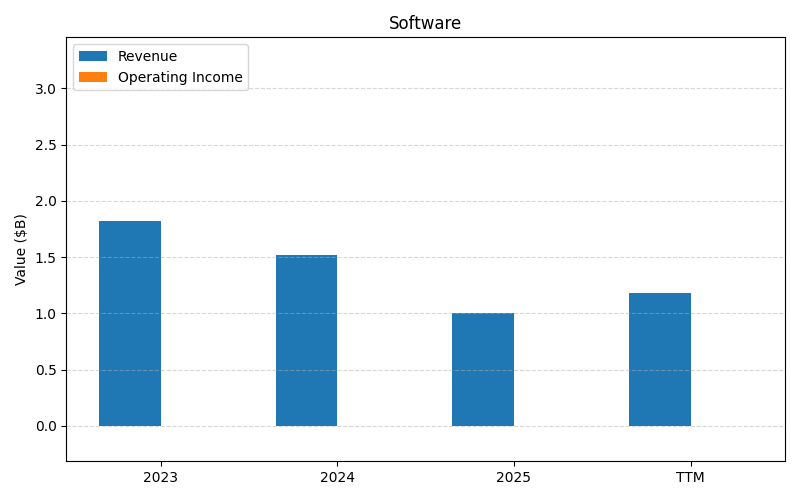
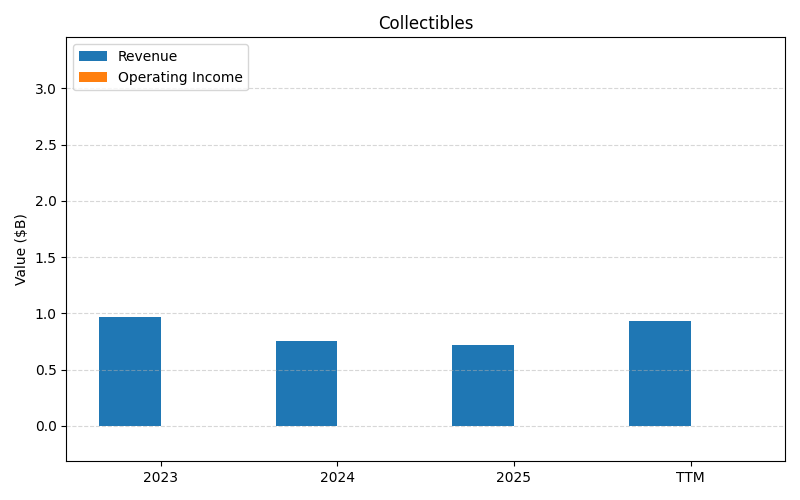
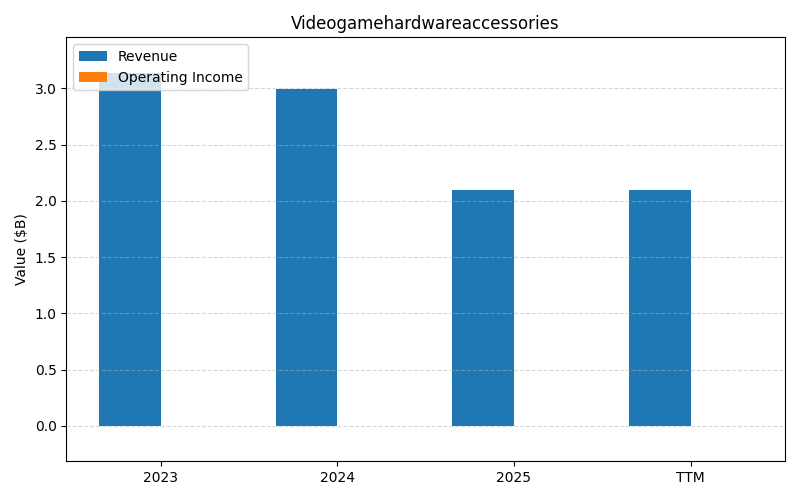
SEGMENTS v2025-09-09 · 2026-05-29 09:08 UTC — Units: $B. Rows list fiscal years (last 3 + TTM) with revenue for each segment; the final row shows the TTM revenue mix (operating income columns display “—” where mix is not applicable).
| Year | Software Rev | Collectibles Rev | Videogamehardwareaccessories Rev | Total Rev |
|---|---|---|---|---|
| 2024 | 1.52B | 0.75B | 3.00B | 5.27B |
| 2025 | 1.01B | 0.72B | 2.10B | 3.82B |
| 2026 | 0.73B | 1.06B | 1.84B | 3.63B |
| TTM | 3.45B | 3.35B | – | 6.80B |
| % of Total (TTM) | 50.7% | 49.3% | – | 100% |
Segment Performance (Axis 2)
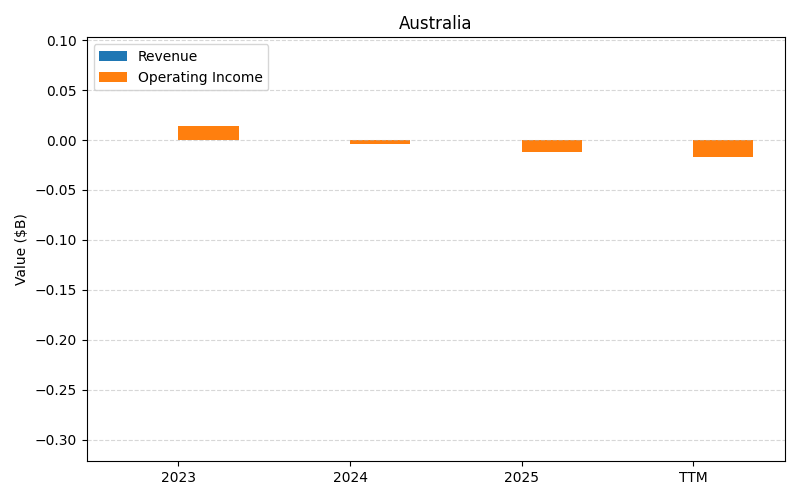
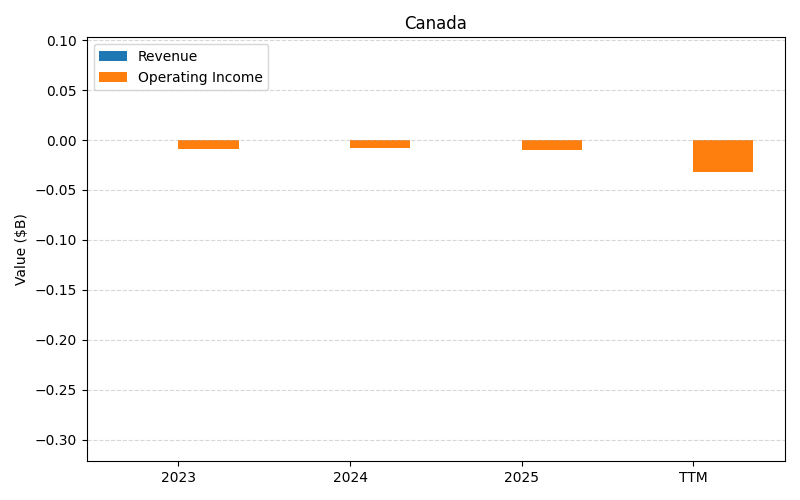
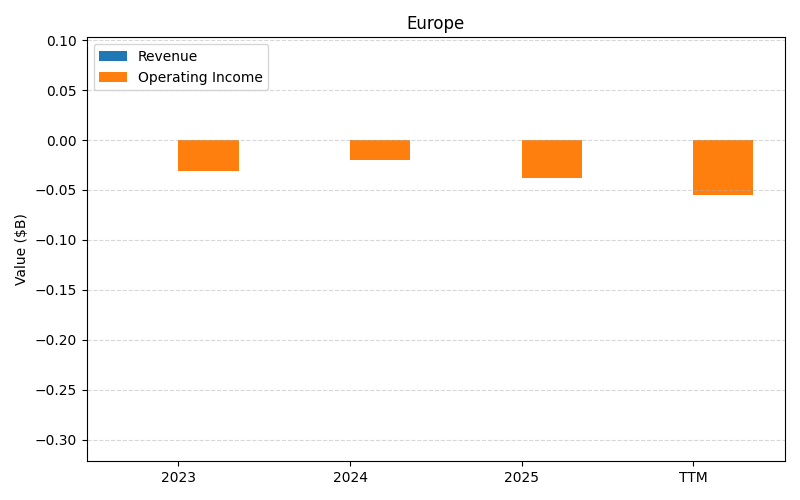
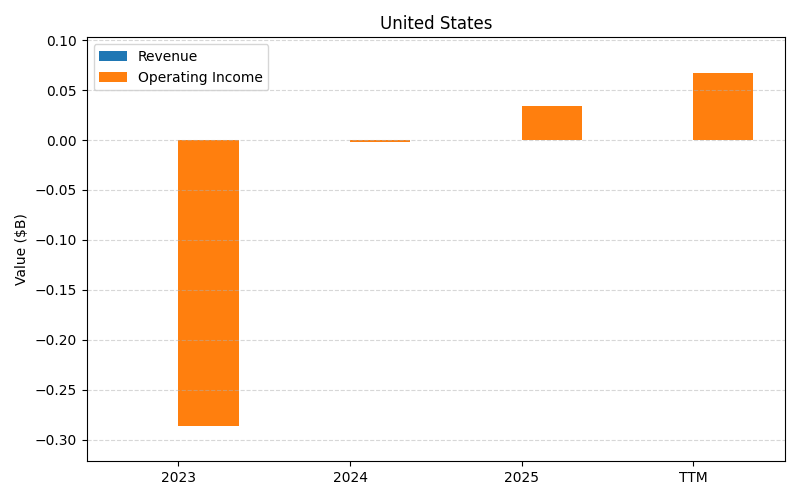
SEGMENTS v2025-09-09 · 2026-05-29 09:08 UTC — Units: $M. Rows list fiscal years (last 3 + TTM) with revenue and operating income for each segment; the final row shows the TTM revenue mix (operating income columns display “—” where mix is not applicable).
| Year | Australia Rev | Australia OI | Canada Rev | Canada OI | Europe Rev | Europe OI | United States Rev | United States OI | Total Rev | Total OI |
|---|---|---|---|---|---|---|---|---|---|---|
| 2024 | – | -3.50M | – | -8.40M | – | -20.3M | – | -2.30M | – | -34.5M |
| 2025 | – | -11.9M | – | -10M | – | -38.2M | – | 33.9M | – | -26.2M |
| 2026 | – | 4.60M | – | -22.2M | – | -33.5M | – | 283.2M | – | 232.1M |
| TTM | 0.00M | -38.7M | 0.00M | -69.2M | 0.00M | -156.2M | 0.00M | 468.8M | 0.00M | 204.7M |
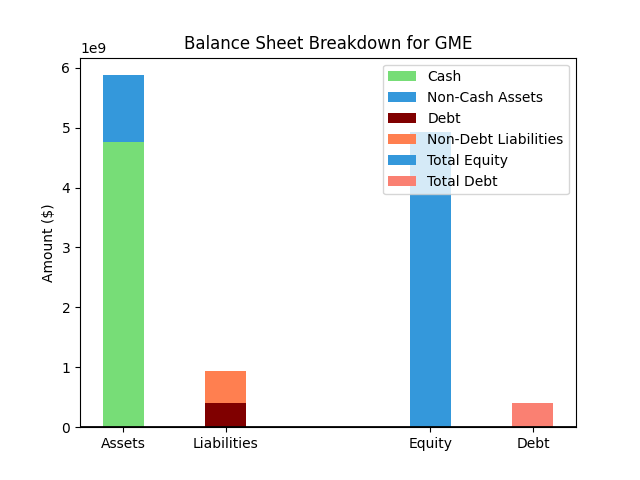
Balance Sheet
| Metric | Value | |
|---|---|---|
| 0 | Total Assets | $10,388M |
| 1 | Cash | $6,305M |
| 2 | Total Liabilities | $4,944M |
| 3 | Total Debt | $4,362M |
| 4 | Total Equity | $5,444M |
| 5 | Debt to Equity Ratio | 0.80 |
EPS & Dividend
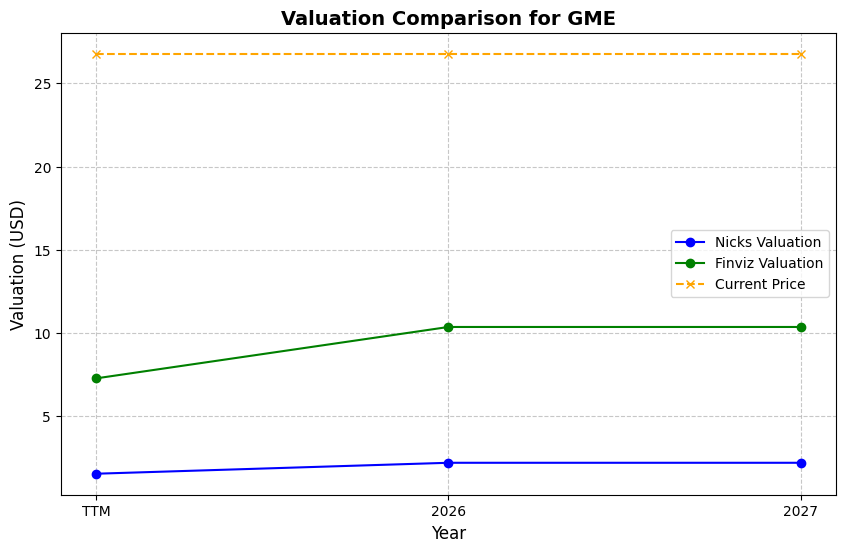
Valuation
| Share Price | Treasury Yield | Estimates | Fair Value (P/E) | Fair Value (P/S) | Current P/S | Current P/E |
|---|---|---|---|---|---|---|
| $21.18 | 4.5% | Nicks Growth: -3% Nick's Expected Margin: 5% FINVIZ Growth: -4% |
Nicks: 5 Finviz: 4 |
Nick's: 0.230 | 2.6 | 27.5 |
| Basis | Year | Nicks Valuation | Nicks vs Share Price | Finviz Valuation | Finviz vs Share Price |
|---|---|---|---|---|---|
| $0.77 EPS | TTM | $3.55 | -83.2% | $3.11 | -85.3% |
| $1.09 EPS | 2027 | $5.02 | -76.3% | $4.40 | -79.2% |
| $1.21 EPS | 2028 | $5.58 | -73.7% | $4.88 | -76.9% |
Implied Growth
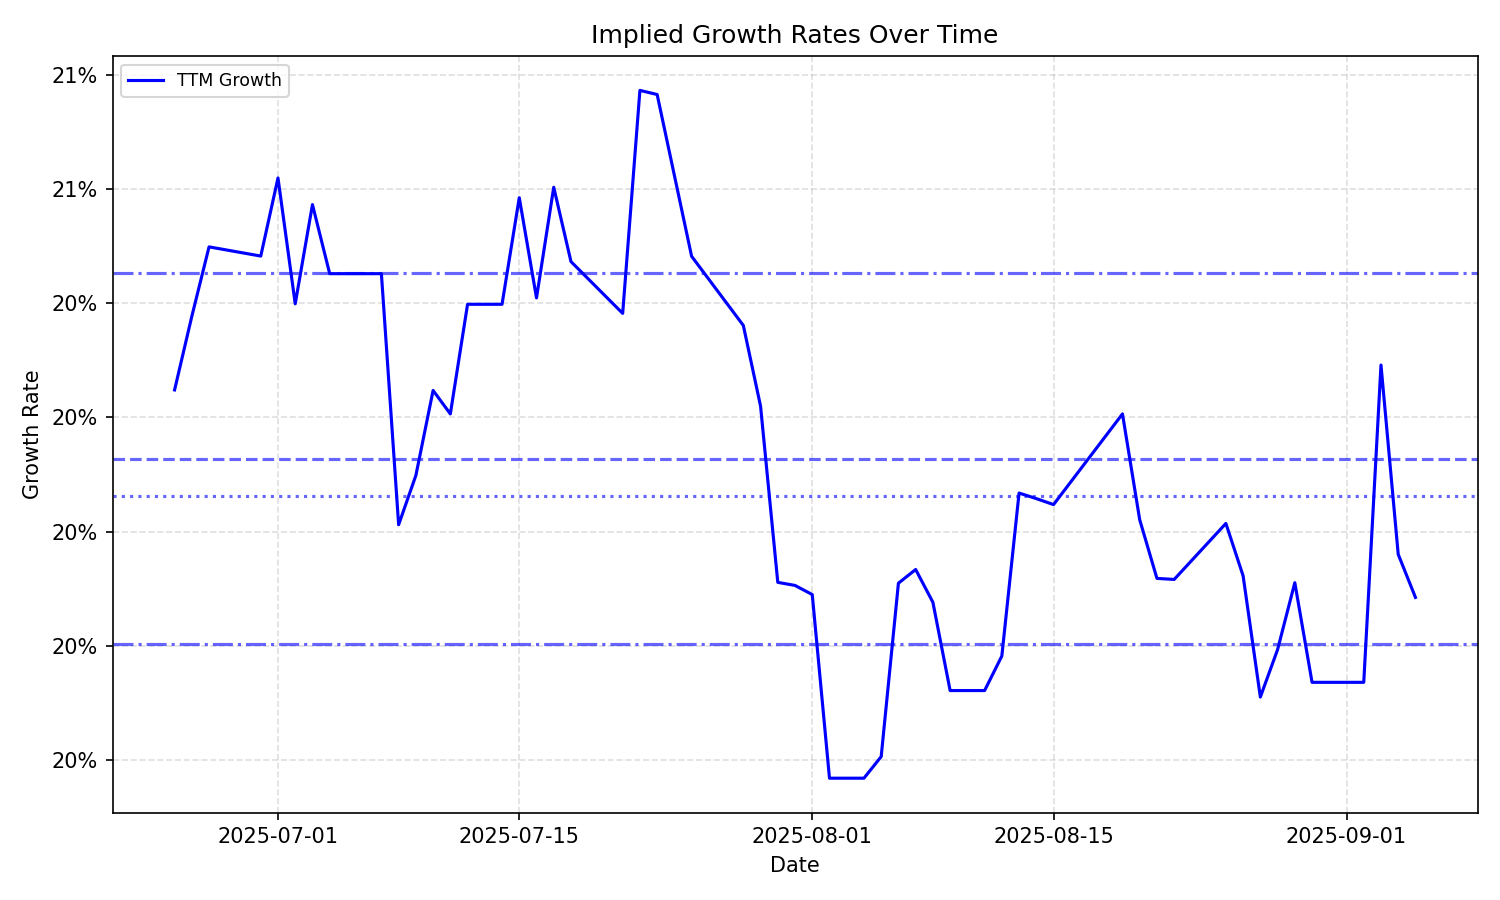
| Average | Median | Std Dev | Current | Percentile | ||||||
|---|---|---|---|---|---|---|---|---|---|---|
| TTM | Forward | TTM | Forward | TTM | Forward | TTM | Forward | TTM | Forward | |
| Timeframe | ||||||||||
| 1 Year | 17.15% | 12.33% | 16.34% | 11.00% | 2.59% | 1.80% | 15.36% | 10.46% | 32.7% | 8.7% |
| 3 Years | 17.15% | 12.33% | 16.34% | 11.00% | 2.59% | 1.80% | 15.36% | 10.46% | 32.7% | 8.7% |
| 5 Years | 17.15% | 12.33% | 16.34% | 11.00% | 2.59% | 1.80% | 15.36% | 10.46% | 32.7% | 8.7% |
| 10 Years | 17.15% | 12.33% | 16.34% | 11.00% | 2.59% | 1.80% | 15.36% | 10.46% | 32.7% | 8.7% |