Gilead Sciences, Inc. — GILD
| Close Price | Market Cap | P/E Ratio | Forward P/E Ratio | Implied Growth* | Implied Forward Growth* | Dividend | P/B Ratio |
|---|---|---|---|---|---|---|---|
| $134.43 | $166.90B | 18.3 | 14.0 | 10.7% | 7.9% | $3.28 2.4% | 7.1 |
Latest Headlines
- · Three Stocks That May Be Trading Below Estimated Value In May 2026
- · Discover May 2026's Stocks That Could Be Trading Below Estimated Value
- · Allogene CEO to step down; Agios drug fails key test
- · Gilead (GILD) Wins FDA Approval for First HDV Treatment Hepcludex
- · S&P 500, Nasdaq Rise to Another Record. Software Strikes Back.
- · Novel Spanish, Culturally Adapted Metastatic Breast Cancer Symptom Management Guide Debuts at ASCO 2026
Revenue & Net Income
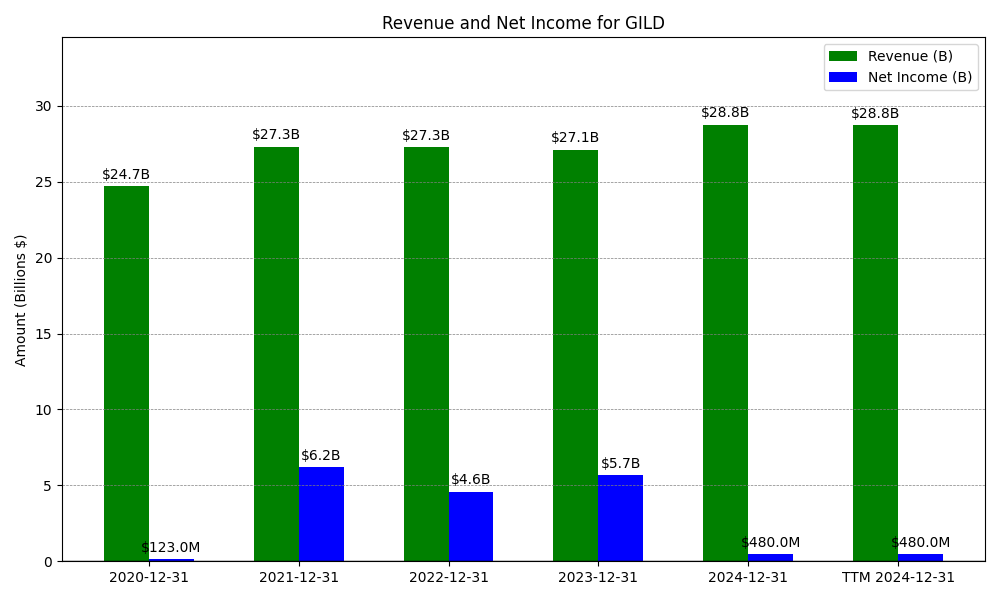
| Date | Revenue | Net_Income | EPS | Last_Updated | Revenue_Change | Net_Income_Change | EPS_Change | |
|---|---|---|---|---|---|---|---|---|
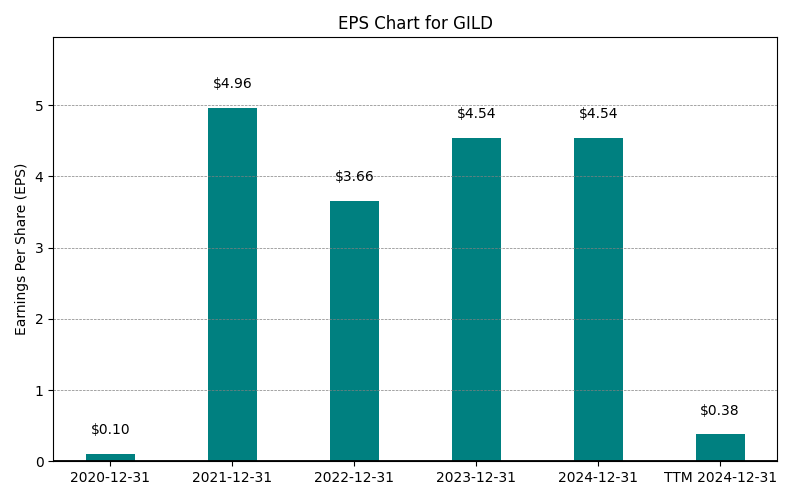
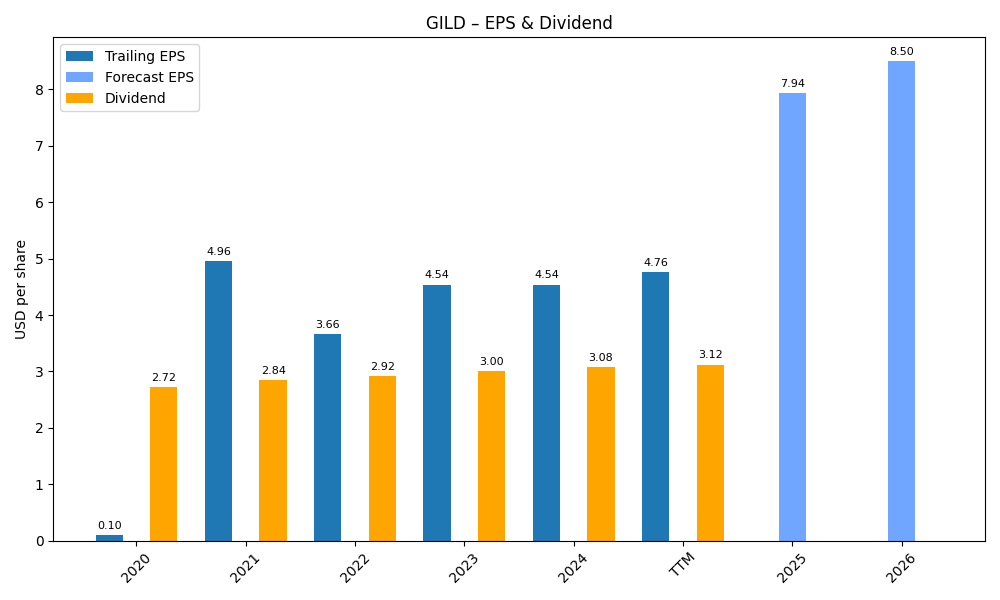
| 0 | 2020-12-31 | $24,689M | $123M | $0.10 | 2024-02-09 04:07:05 | N/A | N/A | N/A |
| 1 | 2021-12-31 | $27,281M | $4,592M | $4.96 | 2026-03-10 08:36:05 | 10.5% | 3633.3% | 4860.0% |
| 2 | 2022-12-31 | $27,281M | $4,592M | $3.66 | 2026-05-29 09:08:23 | 0.0% | 0.0% | -26.2% |
| 3 | 2023-12-31 | $27,116M | $5,665M | $4.54 | 2026-05-29 09:08:23 | -0.6% | 23.4% | 24.0% |
| 4 | 2024-12-31 | $28,754M | $480M | $0.38 | 2026-05-29 09:08:23 | 6.0% | -91.5% | -91.6% |
| 5 | 2025-12-31 | $29,442M | $8,510M | $6.84 | 2026-05-29 09:08:23 | 2.4% | 1672.9% | 1700.0% |
| 6 | TTM 2026-03-31 | $29,734M | $9,216M | $7.36 | 2026-05-19 09:07:39 | 1.0% | 8.3% | 7.6% |
EPS
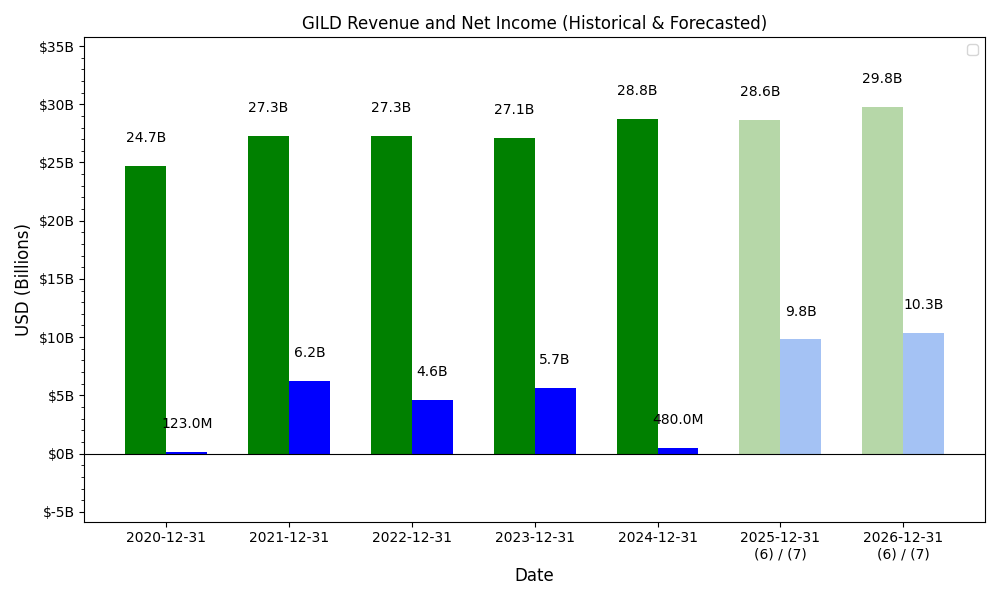
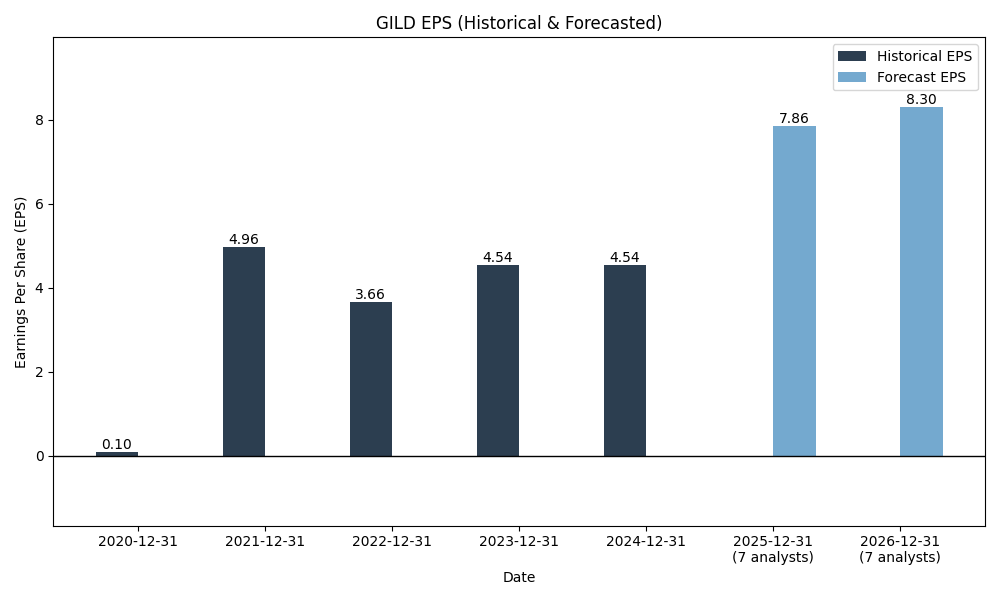
Forecasts
Y/Y % Change
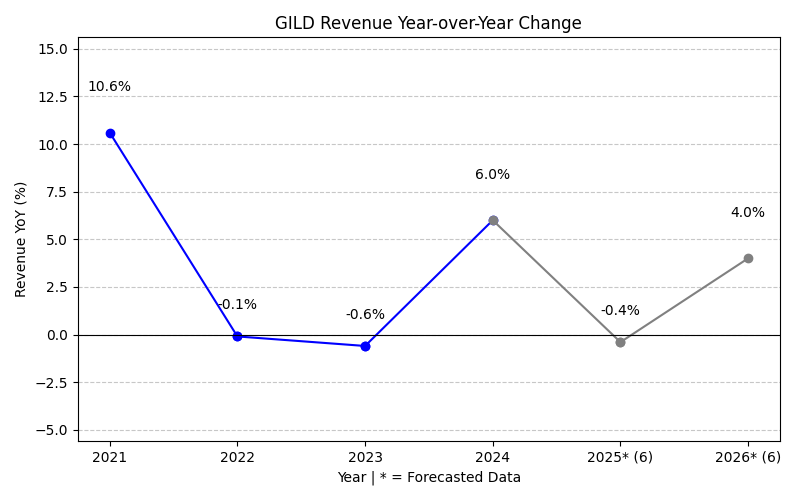
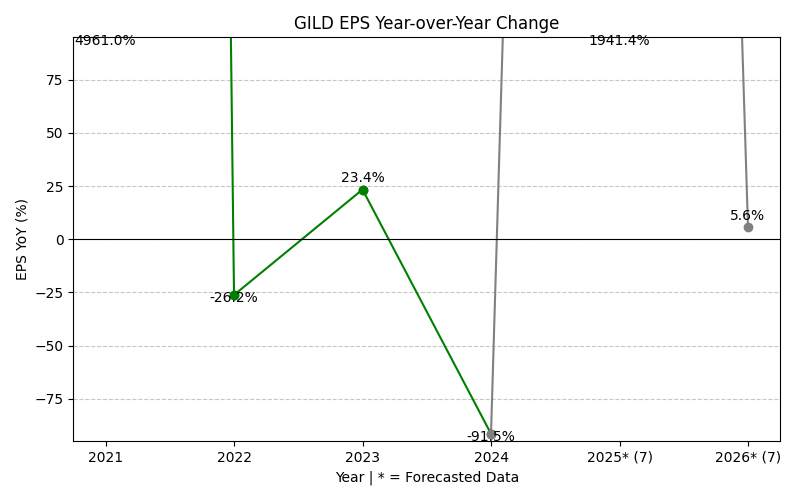
GILD Year-over-Year Growth
| 2020 | 2021 | 2022 | 2023 | 2024 | 2025 | 2026 | 2027 | Average | |
|---|---|---|---|---|---|---|---|---|---|
| Revenue Growth (%) | 10.5% | 0.0% | -0.6% | 6.0% | 2.4% | 3.4% | 6.2% | 4.0% | |
| Revenue Analysts (#) | 0 | 0 | 0 | 0 | 0 | 0 | 24 | 24 | |
| EPS Growth (%) | 3633.3% | 0.0% | 23.4% | -91.5% | 1672.9% | -111.6% | -1305.8% | 545.8% | |
| EPS Analysts (#) | 0 | 0 | 0 | 0 | 0 | 0 | 25 | 25 |
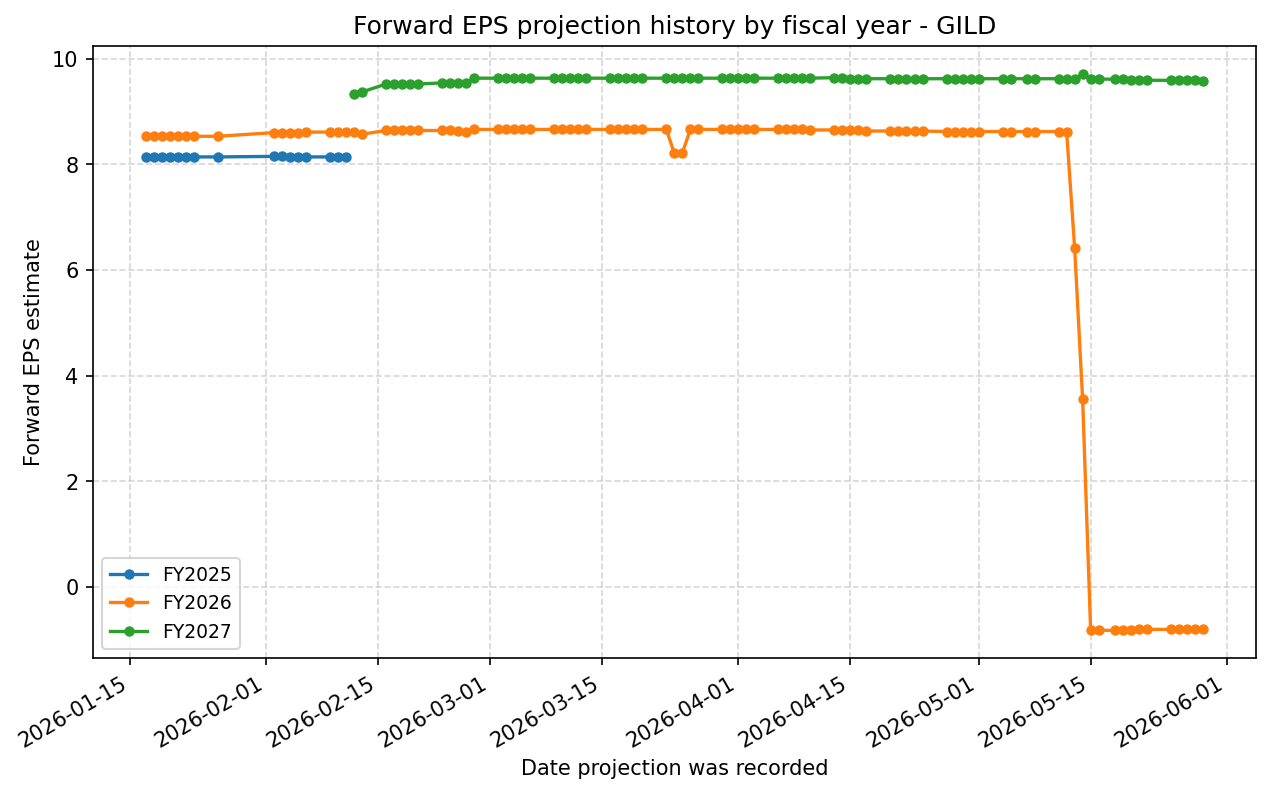
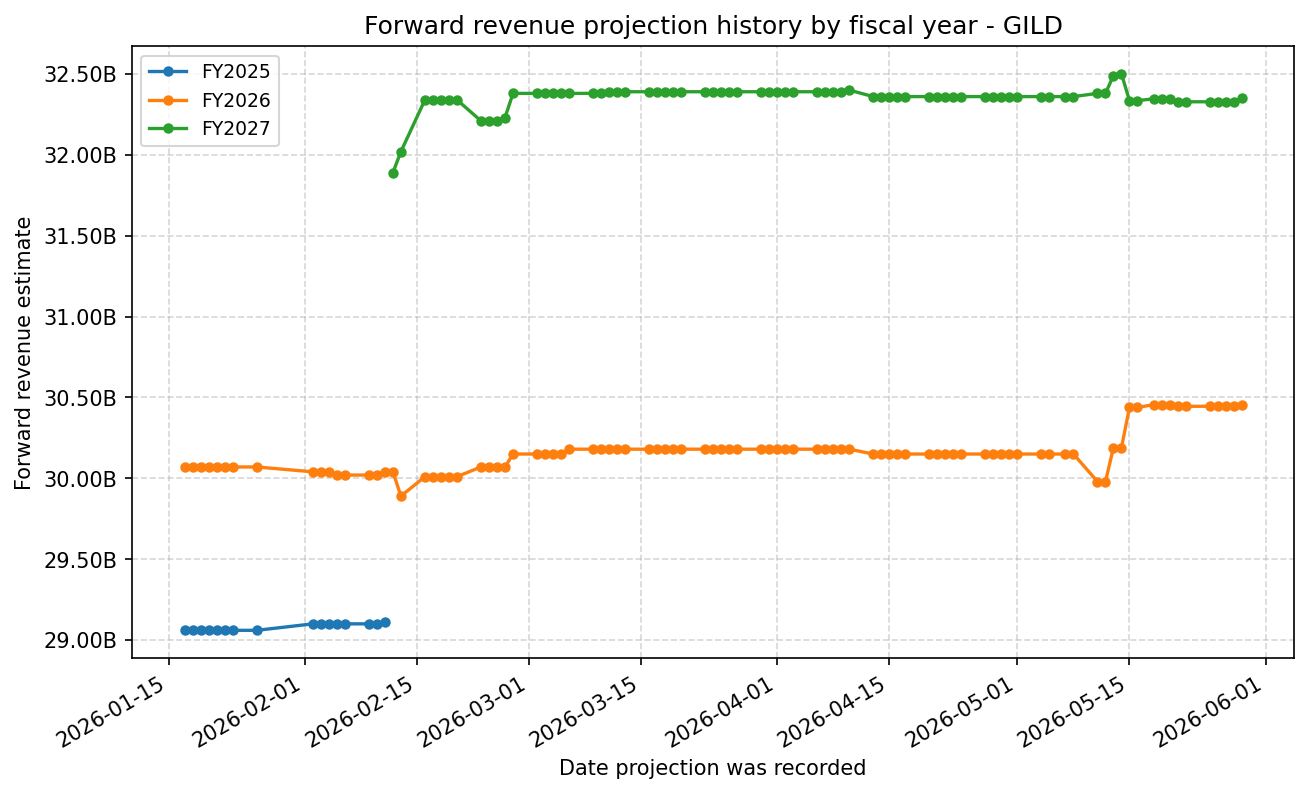
Forward Estimate History
How the next-FY EPS and revenue estimates have drifted over time. One line per fiscal year – past lines end when that FY became current.
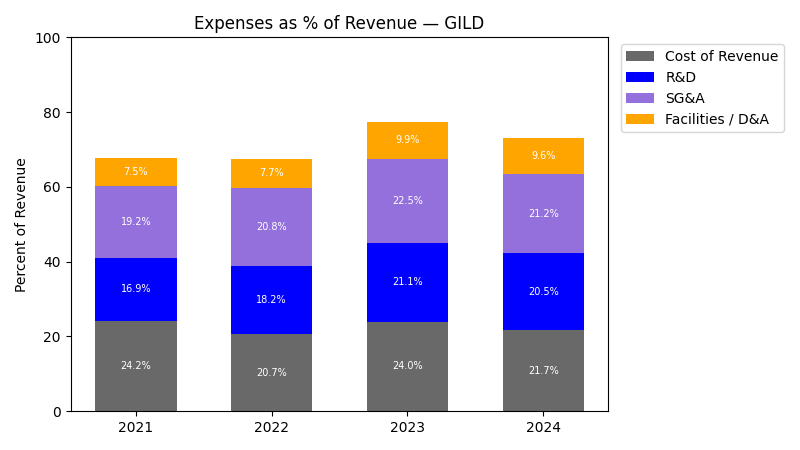
Expenses
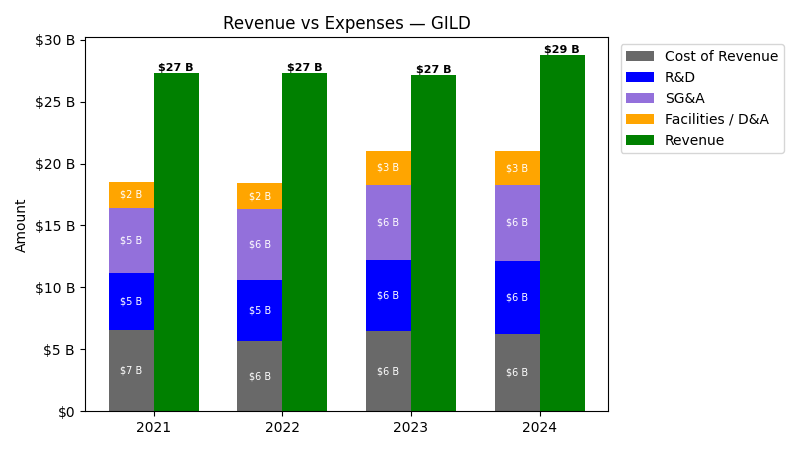
| Year | Revenue ($) | Cost of Revenue ($) | R&D ($) | Sales & Marketing ($) | G&A ($) | SG&A ($) | Facilities / D&A ($) |
|---|---|---|---|---|---|---|---|
| 2022 | $27.3B | $3.6B | $5.0B | $0.0 | $0.0 | $5.7B | $2.1B |
| 2023 | $27.1B | $3.8B | $5.7B | $3.3B | $2.8B | $6.1B | $2.7B |
| 2024 | $28.8B | $3.5B | $5.9B | $3.5B | $2.5B | $6.0B | $2.8B |
| 2025 | $29.4B | $3.5B | $5.8B | $3.5B | $2.2B | $5.7B | $2.8B |
| TTM | $29.7B | $3.4B | $5.8B | $3.7B | $2.2B | $5.9B | $2.8B |
| Year | Revenue Change (%) | Cost of Revenue Change (%) | R&D Change (%) | Sales & Marketing Change (%) | G&A Change (%) | SG&A Change (%) | Facilities / D&A Change (%) |
|---|---|---|---|---|---|---|---|
| 2023 | -0.60 | 7.06 | 14.89 | inf | inf | 6.86 | 28.06 |
| 2024 | 6.04 | -8.44 | 3.31 | 5.53 | -8.71 | -1.02 | 2.75 |
| 2025 | 2.39 | -0.29 | -1.83 | 2.00 | -14.17 | -4.87 | -0.25 |
| TTM | 0.99 | -2.53 | -0.10 | 4.12 | 2.20 | 3.38 | -0.25 |
No unmapped expenses.
Segment Performance
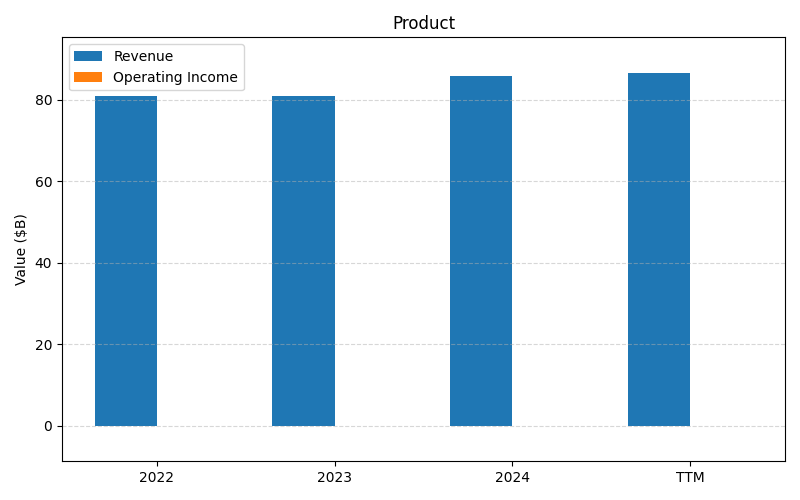
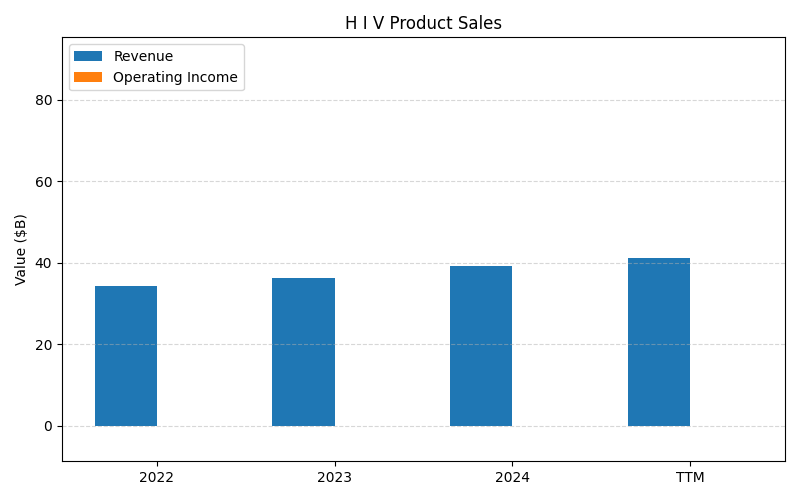
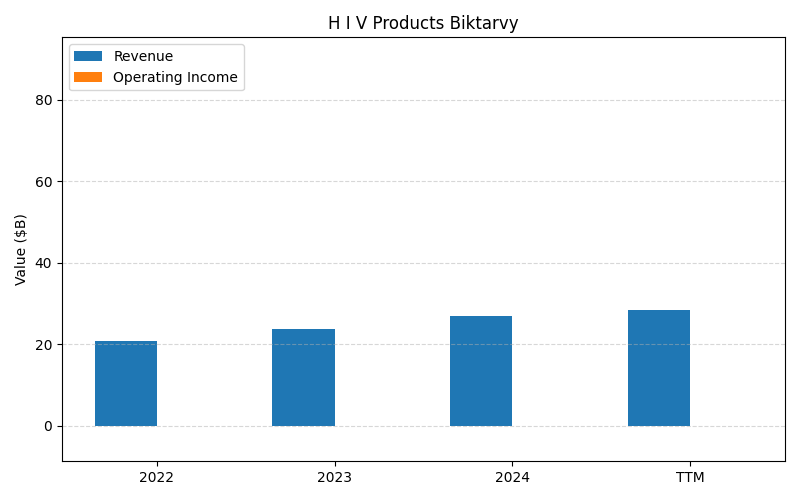
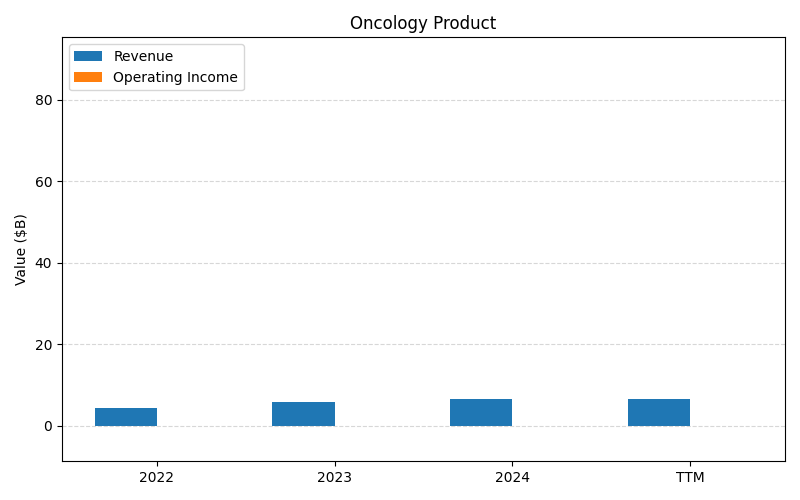
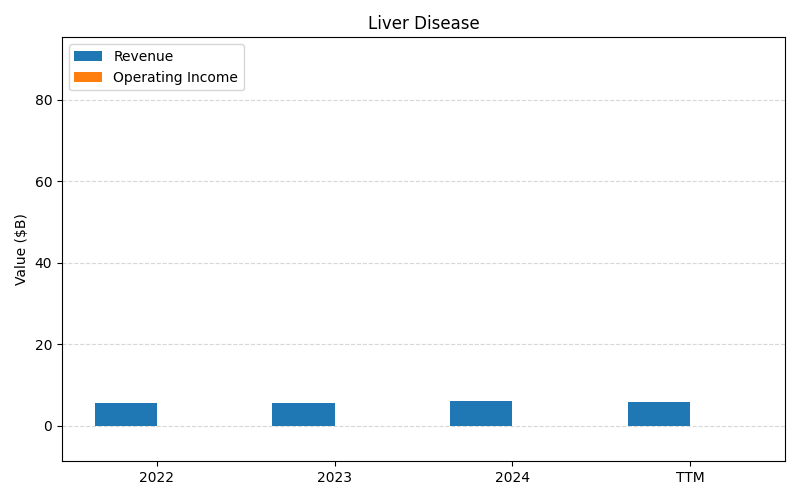
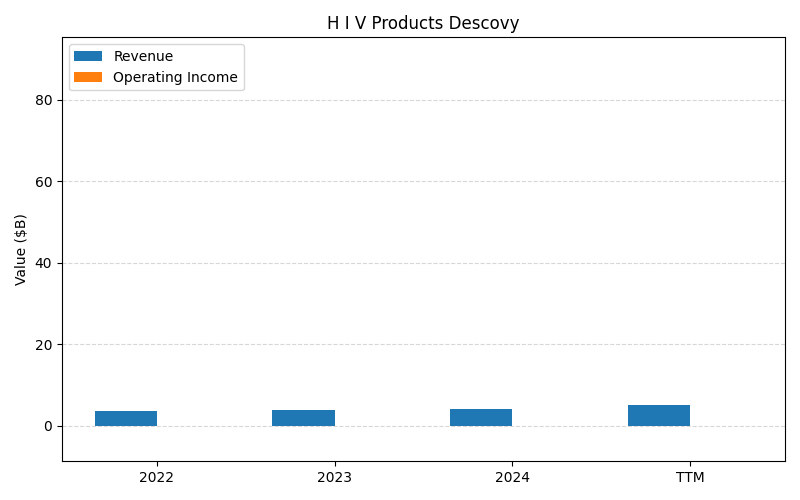
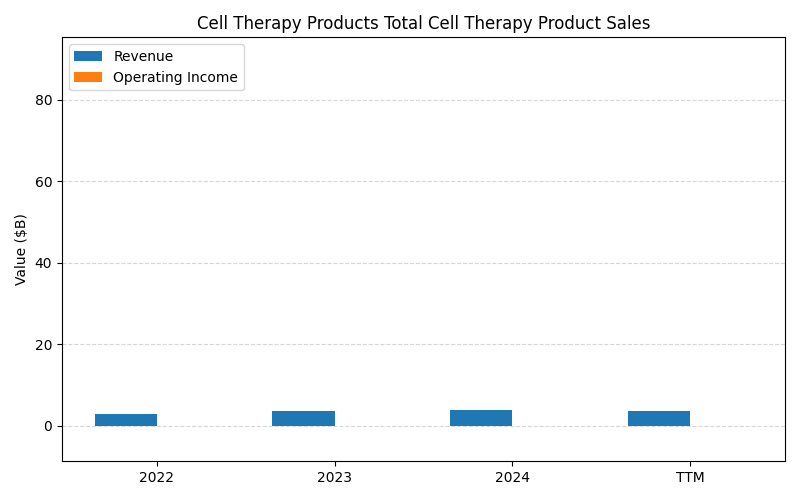
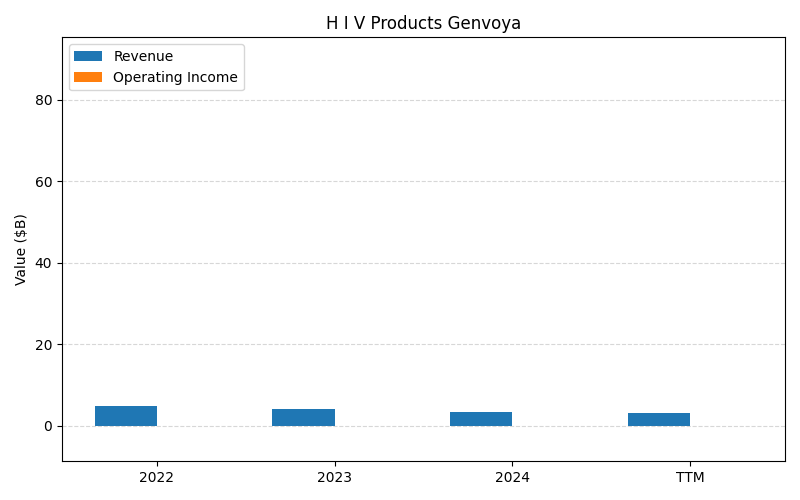
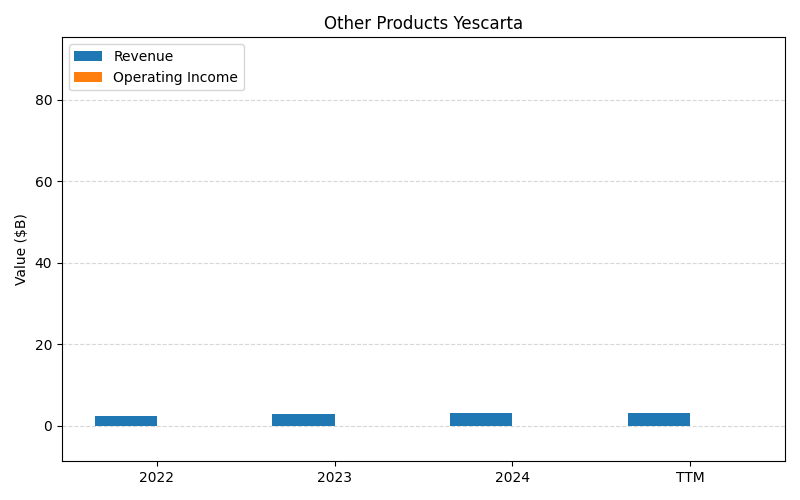
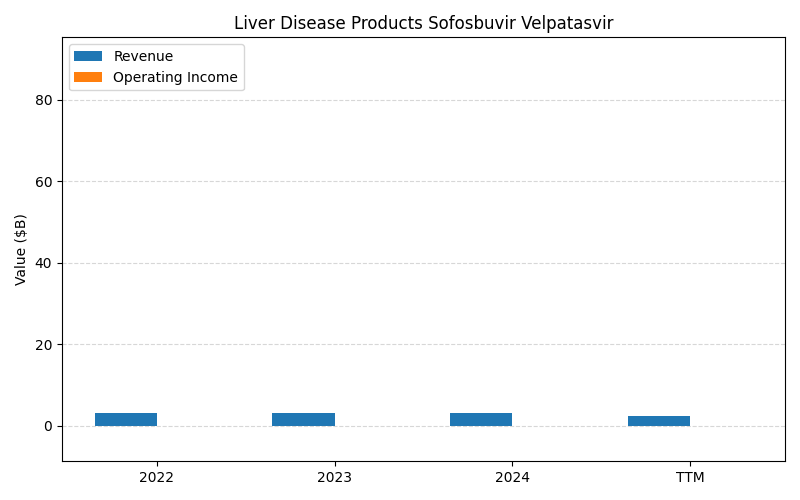
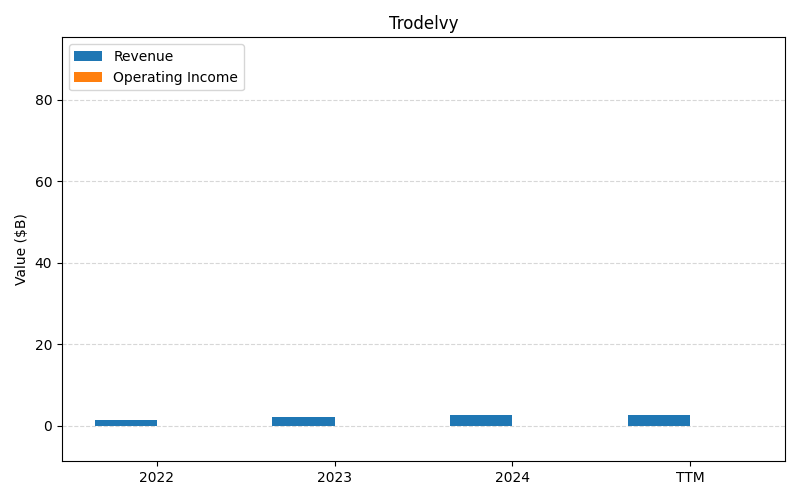
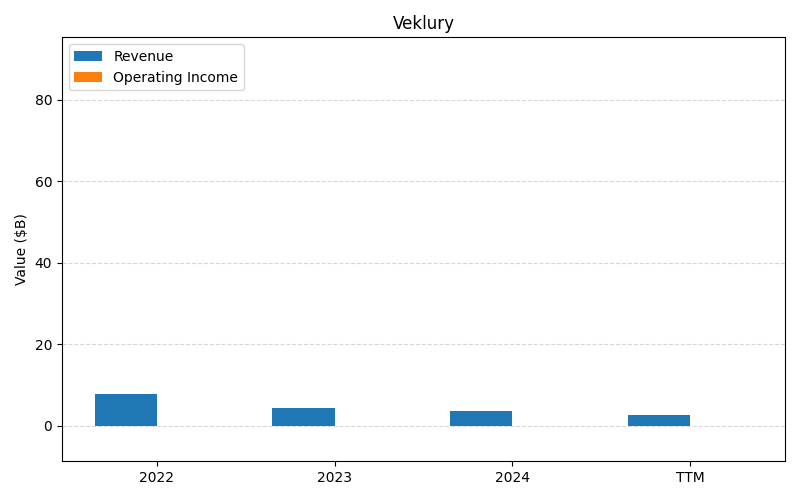
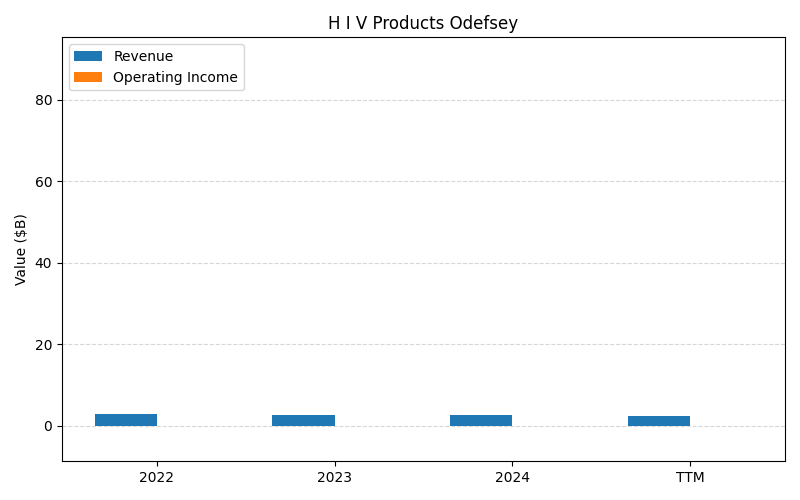
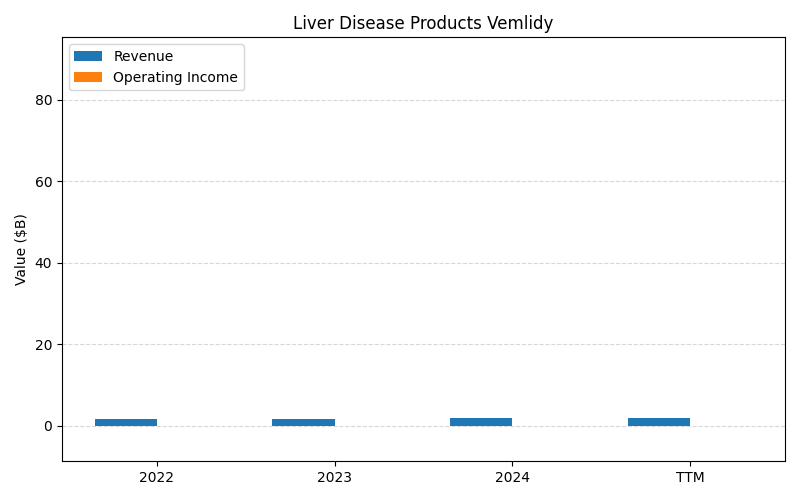
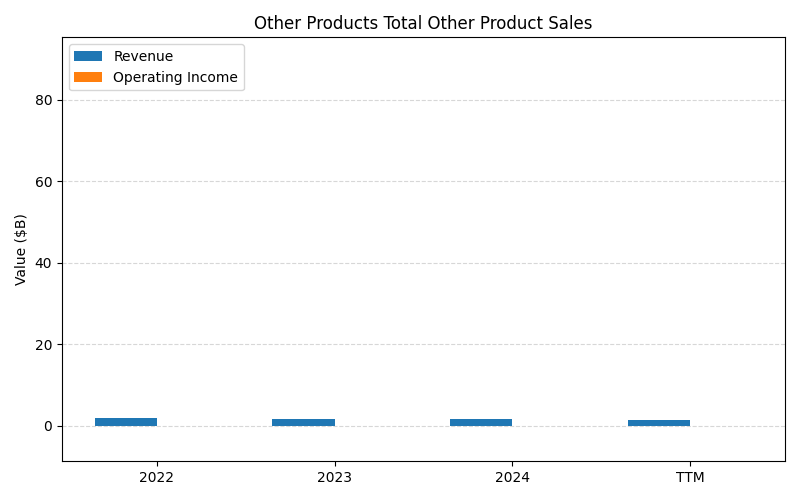
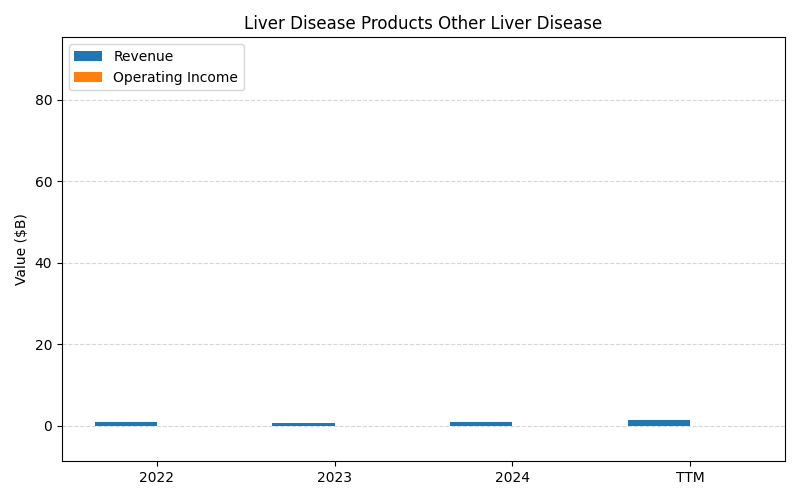
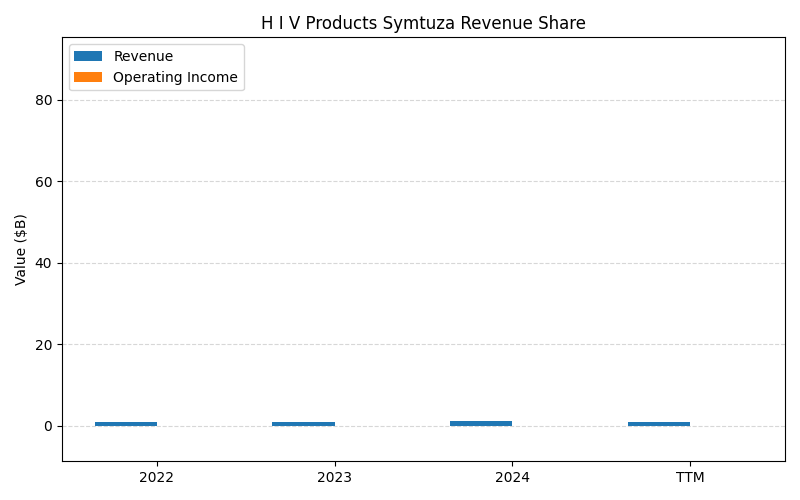
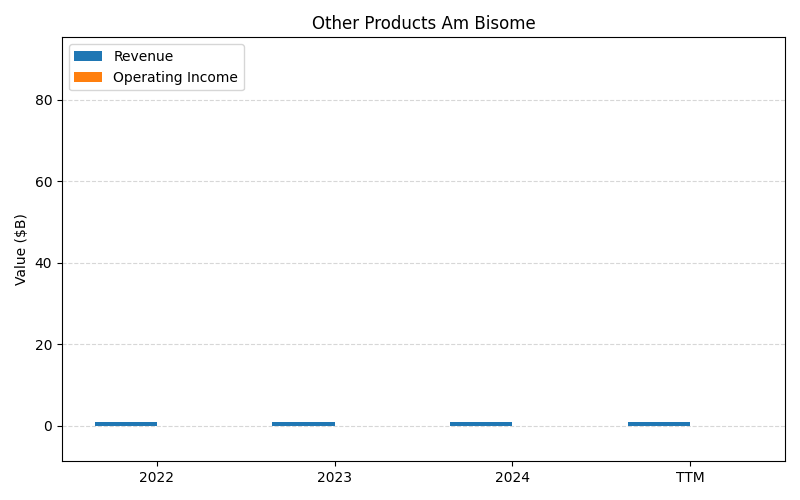
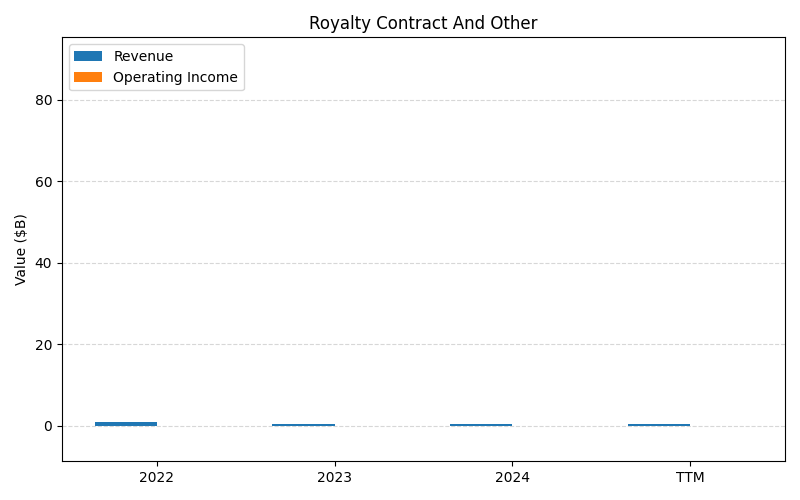
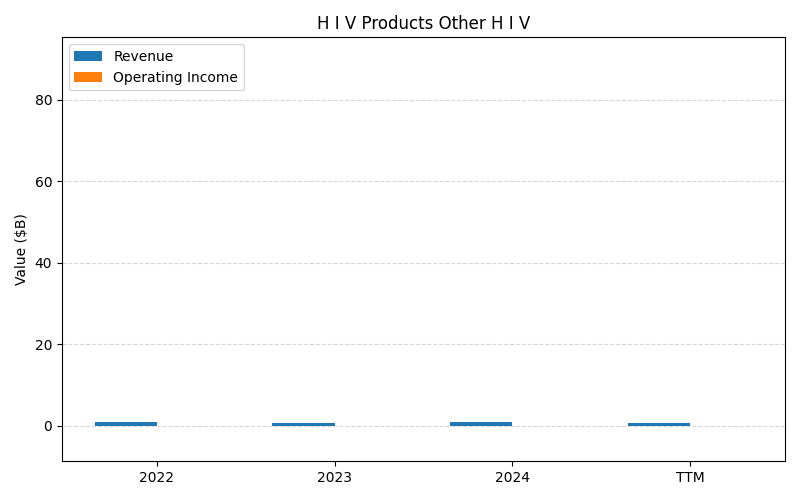
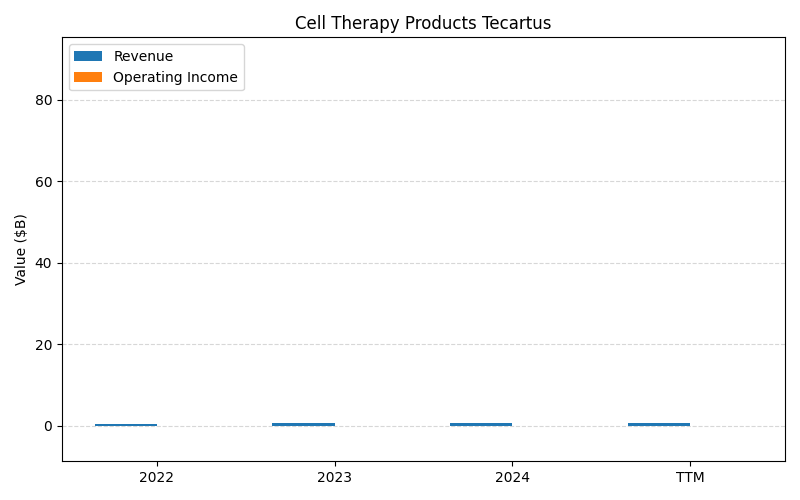
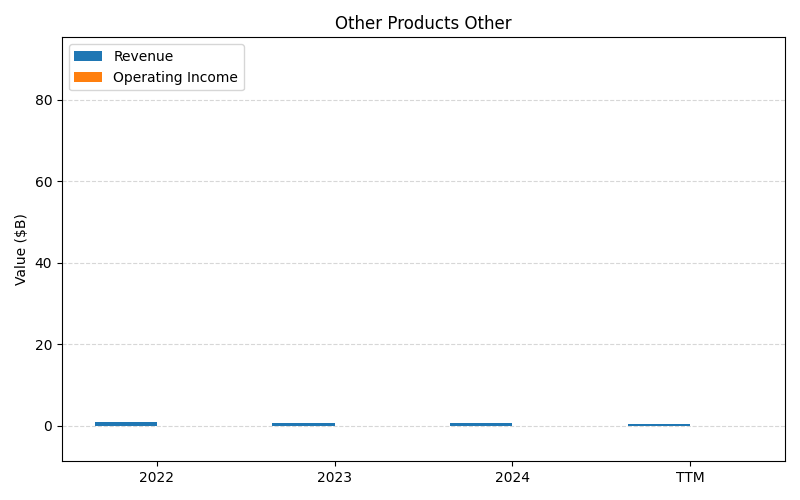
SEGMENTS v2025-09-09 · 2026-05-29 09:08 UTC — Units: $B. Rows list fiscal years (last 3 + TTM) with revenue for each segment; the final row shows the TTM revenue mix (operating income columns display “—” where mix is not applicable).
| Year | Prod Rev | H I V Product Sales Rev | H I V Products Biktarvy Rev | Oncology Product Rev | Liver Disease Rev | H I V Products Descovy Rev | Cell Therapy Products Total Cell Therapy Product Sales Rev | H I V Products Genvoya Rev | Other Products Yescarta Rev | Liver Disease Products Sofosbuvir Velpatasvir Rev | Trodelvy Rev | Veklury Rev | H I V Products Odefsey Rev | Liver Disease Products Vemlidy Rev | Other Products Total Other Product Sales Rev | Liver Disease Products Other Liver Disease Rev | H I V Products Symtuza Revenue Share Rev | Other Products Am Bisome Rev | Royalty Contract And Other Rev | H I V Products Other H I V Rev | Cell Therapy Products Tecartus Rev | Other Products Other Rev | Total Rev |
|---|---|---|---|---|---|---|---|---|---|---|---|---|---|---|---|---|---|---|---|---|---|---|---|
| 2023 | 80.8B | 36.4B | 23.7B | 5.86B | 5.57B | 3.97B | 3.74B | 4.12B | 3.00B | 3.07B | 2.12B | 4.37B | 2.70B | 1.72B | 1.72B | 0.77B | 1.06B | 0.98B | 0.55B | 0.80B | 0.74B | 0.73B | 188.5B |
| 2024 | 85.8B | 39.2B | 26.8B | 6.58B | 6.04B | 4.22B | 3.95B | 3.52B | 3.14B | 3.19B | 2.63B | 3.60B | 2.58B | 1.92B | 1.78B | 0.93B | 1.18B | 1.06B | 0.43B | 0.87B | 0.81B | 0.71B | 201.1B |
| 2025 | 86.7B | 41.5B | 28.7B | 6.47B | 6.43B | 5.51B | 3.68B | 3.00B | 2.99B | 2.54B | 2.79B | 1.82B | 2.33B | 2.14B | 1.60B | 1.75B | 0.99B | 1.02B | 1.58B | 1.00B | 0.69B | 0.58B | 205.8B |
| TTM | 213.3B | 100B | 68.5B | 16.2B | 15.5B | 12.5B | 9.37B | 7.78B | 7.57B | 6.99B | 6.81B | 6.31B | 5.92B | 5.03B | 4.19B | 3.15B | 2.68B | 2.63B | 2.22B | 2.20B | 1.80B | 1.55B | 502.2B |
| % of Total (TTM) | 42.5% | 19.9% | 13.6% | 3.2% | 3.1% | 2.5% | 1.9% | 1.5% | 1.5% | 1.4% | 1.4% | 1.3% | 1.2% | 1.0% | 0.8% | 0.6% | 0.5% | 0.5% | 0.4% | 0.4% | 0.4% | 0.3% | 100% |
Balance Sheet
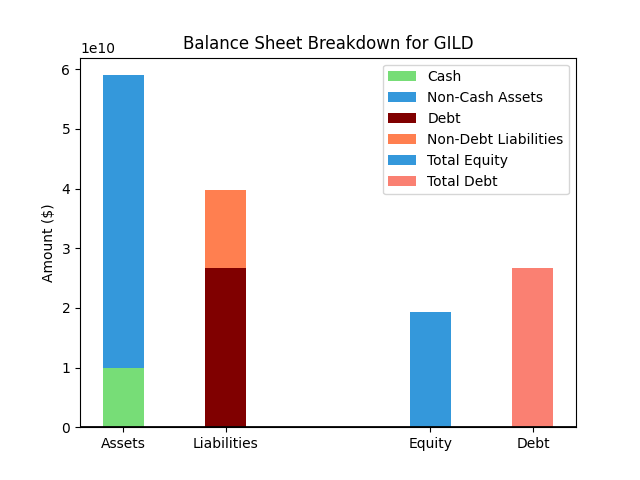
| Metric | Value | |
|---|---|---|
| 0 | Total Assets | $56,278M |
| 1 | Cash | $7,628M |
| 2 | Total Liabilities | $32,847M |
| 3 | Total Debt | $22,174M |
| 4 | Total Equity | $23,515M |
| 5 | Debt to Equity Ratio | 0.94 |
EPS & Dividend
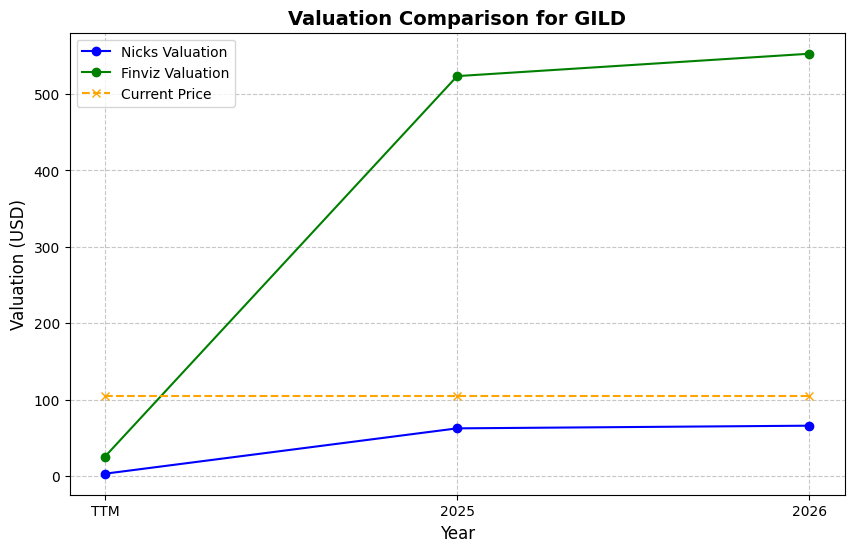
Valuation
| Share Price | Treasury Yield | Estimates | Fair Value (P/E) | Fair Value (P/S) | Current P/S | Current P/E |
|---|---|---|---|---|---|---|
| $134.43 | 4.5% | Nicks Growth: 2% Nick's Expected Margin: 15% FINVIZ Growth: 9% |
Nicks: 8 Finviz: 16 |
Nick's: 1.170 | 5.6 | 18.3 |
| Basis | Year | Nicks Valuation | Nicks vs Share Price | Finviz Valuation | Finviz vs Share Price |
|---|---|---|---|---|---|
| $7.36 EPS | TTM | $57.41 | -57.3% | $114.59 | -14.8% |
| $24.53 Revenue | 2026 | $28.70 | -78.6% | $57.29 | -57.4% |
| $9.59 EPS | 2027 | $74.77 | -44.4% | $149.24 | 11.0% |
Implied Growth
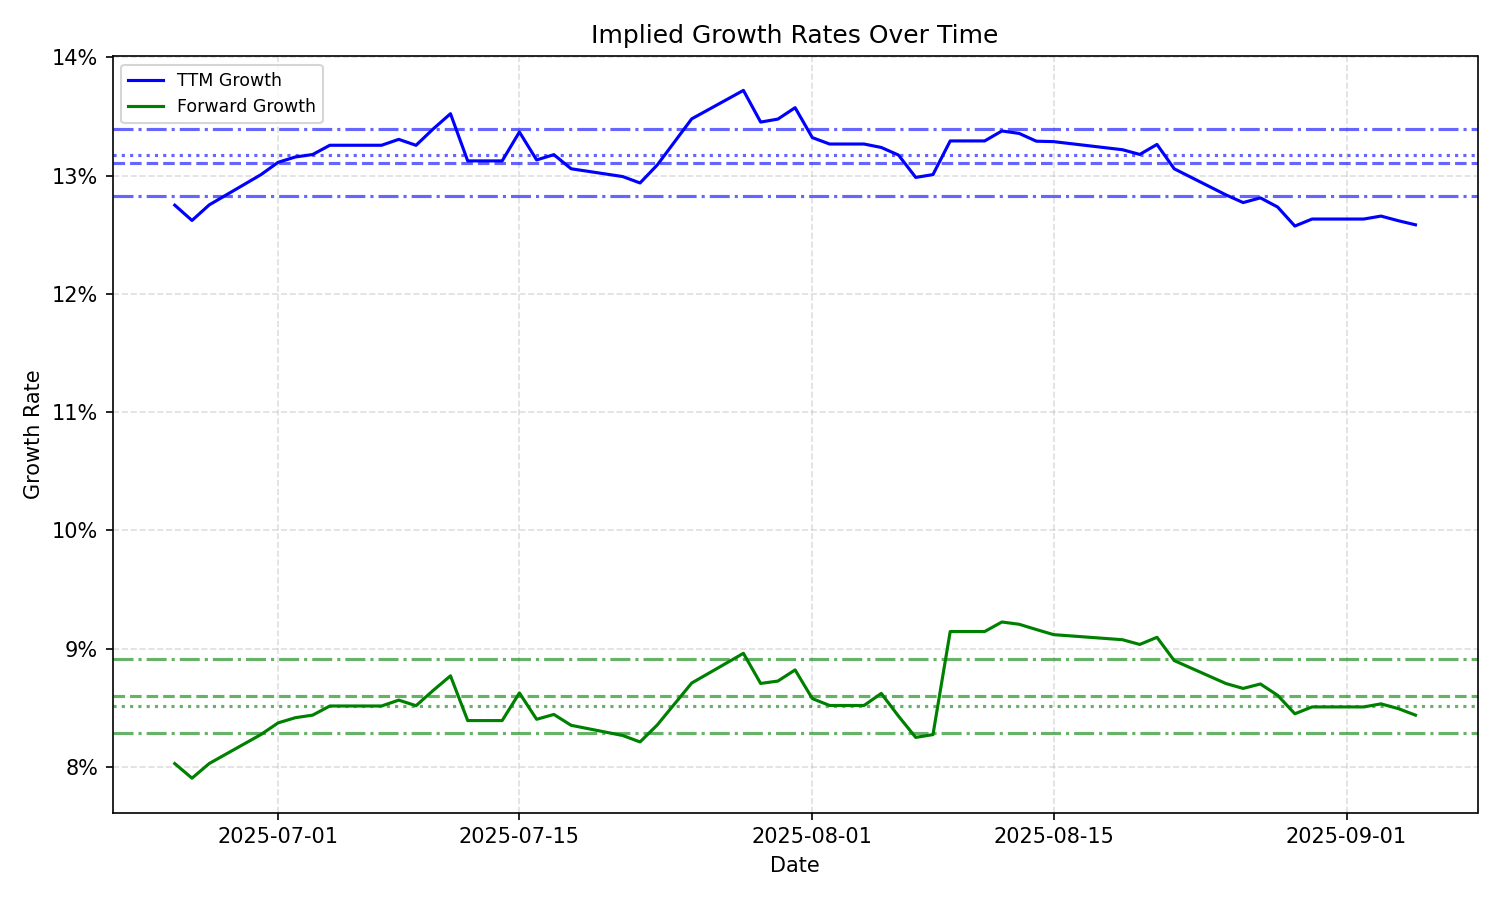
| Average | Median | Std Dev | Current | Percentile | ||||||
|---|---|---|---|---|---|---|---|---|---|---|
| TTM | Forward | TTM | Forward | TTM | Forward | TTM | Forward | TTM | Forward | |
| Timeframe | ||||||||||
| 1 Year | 12.02% | 8.44% | 12.18% | 8.44% | 0.99% | 0.59% | 10.80% | 8.03% | 18.3% | 25.8% |
| 3 Years | 12.02% | 8.44% | 12.18% | 8.44% | 0.99% | 0.59% | 10.80% | 8.03% | 18.3% | 25.8% |
| 5 Years | 12.02% | 8.44% | 12.18% | 8.44% | 0.99% | 0.59% | 10.80% | 8.03% | 18.3% | 25.8% |
| 10 Years | 12.02% | 8.44% | 12.18% | 8.44% | 0.99% | 0.59% | 10.80% | 8.03% | 18.3% | 25.8% |