GE Aerospace — GE
| Close Price | Market Cap | P/E Ratio | Forward P/E Ratio | Implied Growth* | Implied Forward Growth* | Dividend | P/B Ratio |
|---|---|---|---|---|---|---|---|
| $323.76 | $338.27B | 40.2 | 37.3 | 19.4% | 18.5% | $1.88 0.6% | 18.2 |
Latest Headlines
- · Does GE’s (GE) New GE426 Air Force Contract Quietly Redefine Its Defense Engine Strategy?
- · Top Stock Reports for JPMorgan, GE Aerospace & Western Digital
- · Can GE's Growth Investments Create Long-Term Value for Investors?
- · Larry Kudlow: The ‘Trumpian Economy’ Is Booming Despite the Gas Price Noise
- · Is GE Aerospace Stock Outperforming the S&P 500?
- · GE Vernova (GEV) Stock Sinks As Market Gains: What You Should Know
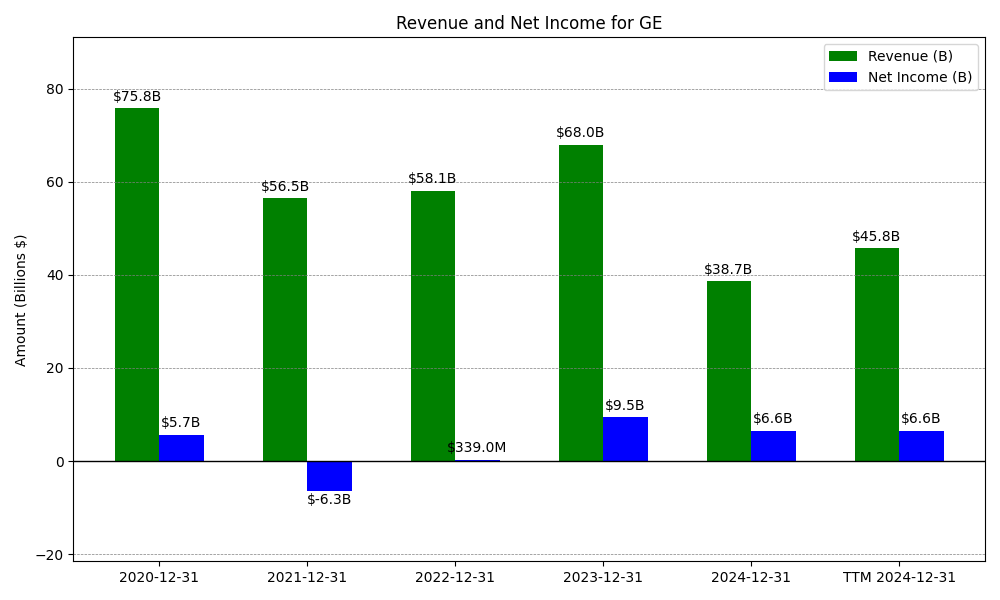
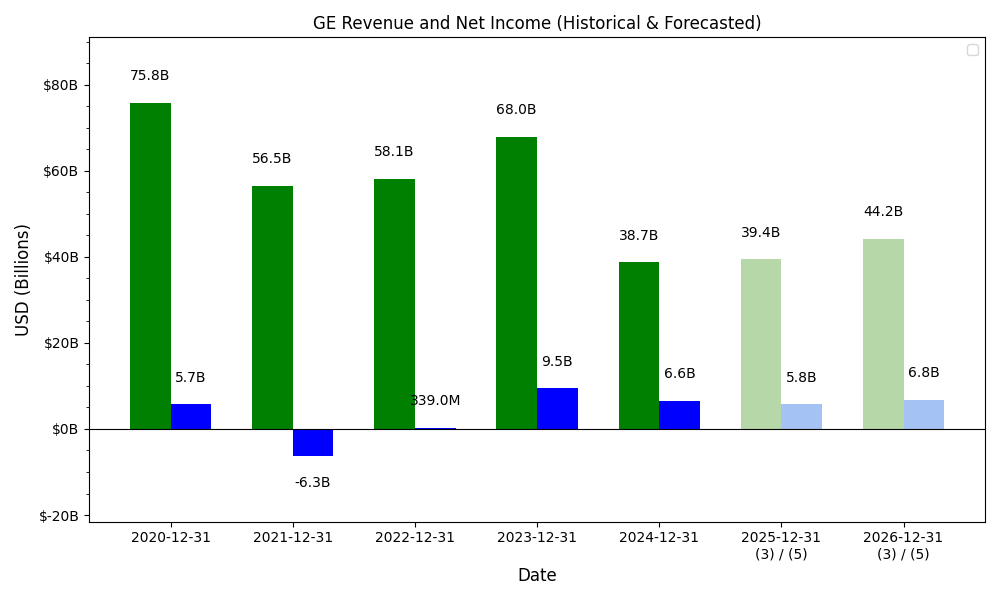
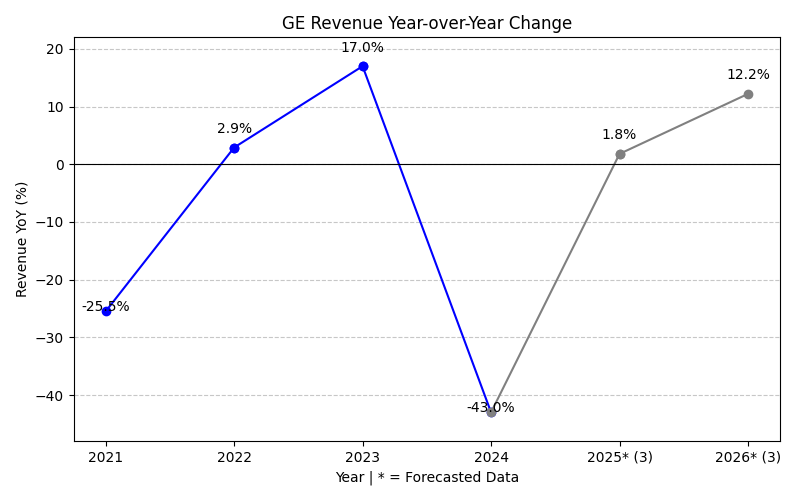
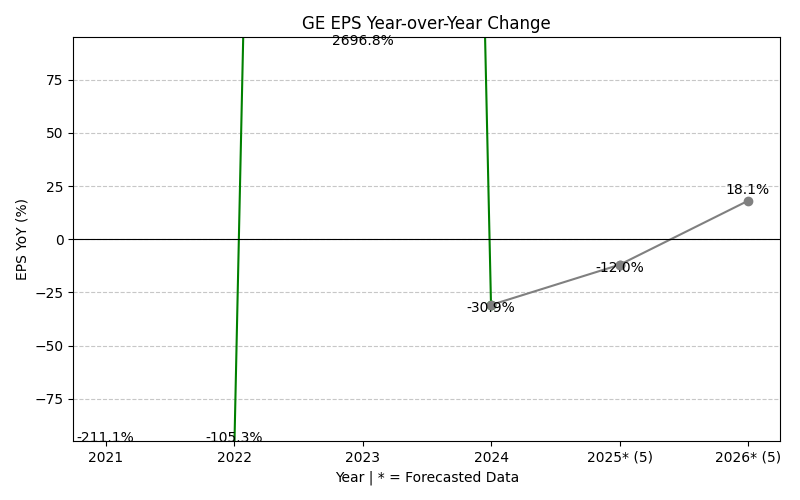
Revenue & Net Income
| Date | Revenue | Net_Income | EPS | Last_Updated | Revenue_Change | Net_Income_Change | EPS_Change | |
|---|---|---|---|---|---|---|---|---|
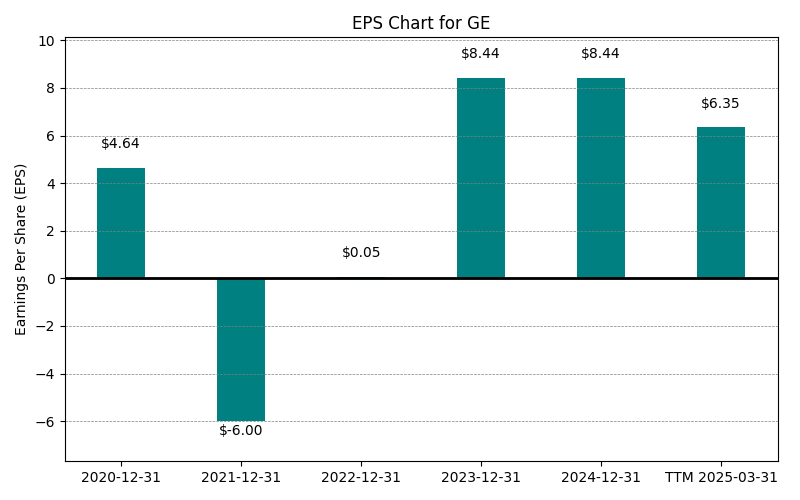
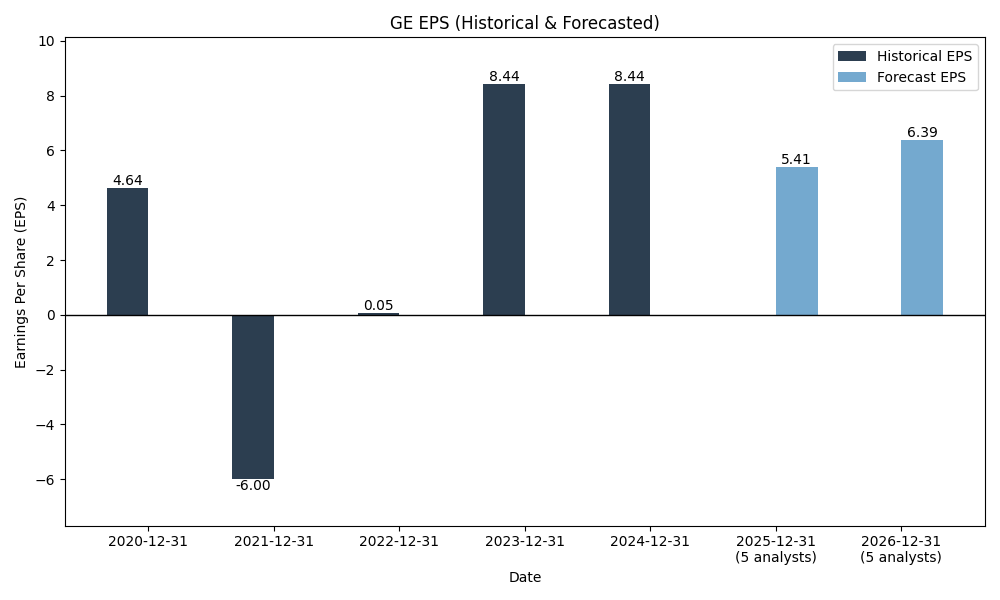
| 0 | 2020-12-31 | $75,834M | $5,704M | $4.64 | 2024-02-03 03:17:10 | N/A | N/A | N/A |
| 1 | 2021-12-31 | $56,469M | $-6,337M | $-6.00 | 2024-04-16 21:20:15 | -25.5% | -211.1% | -229.3% |
| 2 | 2022-12-31 | $29,139M | $336M | $0.05 | 2026-05-29 09:08:16 | -48.4% | -105.3% | -100.8% |
| 3 | 2023-12-31 | $35,348M | $9,482M | $8.44 | 2026-05-29 09:08:16 | 21.3% | 2722.0% | 16780.0% |
| 4 | 2024-12-31 | $38,702M | $6,556M | $6.04 | 2026-05-29 09:08:16 | 9.5% | -30.9% | -28.4% |
| 5 | 2025-12-31 | $45,855M | $8,704M | $8.20 | 2026-05-29 09:08:16 | 18.5% | 32.8% | 35.8% |
| 6 | TTM 2026-03-31 | $48,312M | $8,630M | $8.05 | 2026-04-22 08:37:09 | 5.4% | -0.9% | -1.8% |
EPS
Forecasts
Y/Y % Change
GE Year-over-Year Growth
| 2020 | 2021 | 2022 | 2023 | 2024 | 2025 | 2026 | 2027 | Average | |
|---|---|---|---|---|---|---|---|---|---|
| Revenue Growth (%) | -25.5% | -48.4% | 21.3% | 9.5% | 18.5% | 6.0% | 9.8% | -1.3% | |
| Revenue Analysts (#) | 0 | 0 | 0 | 0 | 0 | 0 | 17 | 17 | |
| EPS Growth (%) | -211.1% | -105.3% | 2722.0% | -30.9% | 32.8% | -9.3% | 23.3% | 345.9% | |
| EPS Analysts (#) | 0 | 0 | 0 | 0 | 0 | 0 | 22 | 11 |
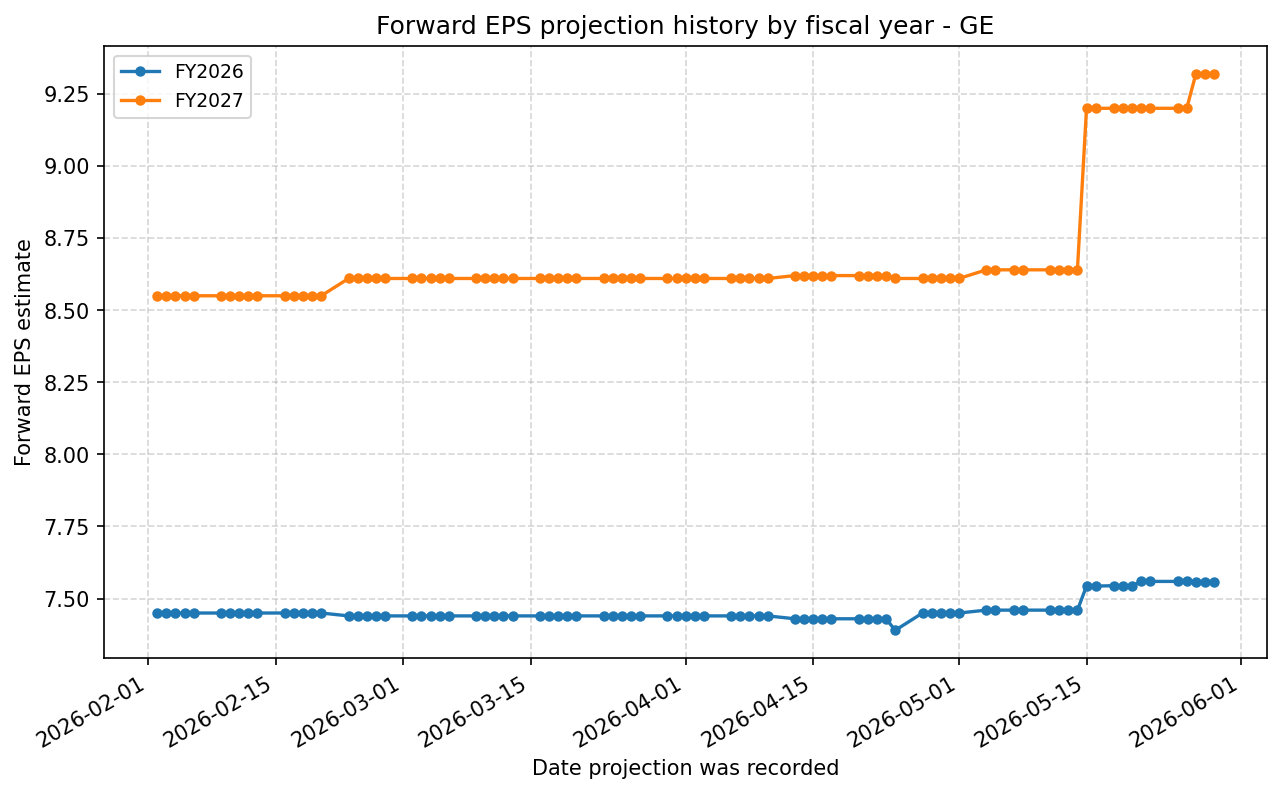
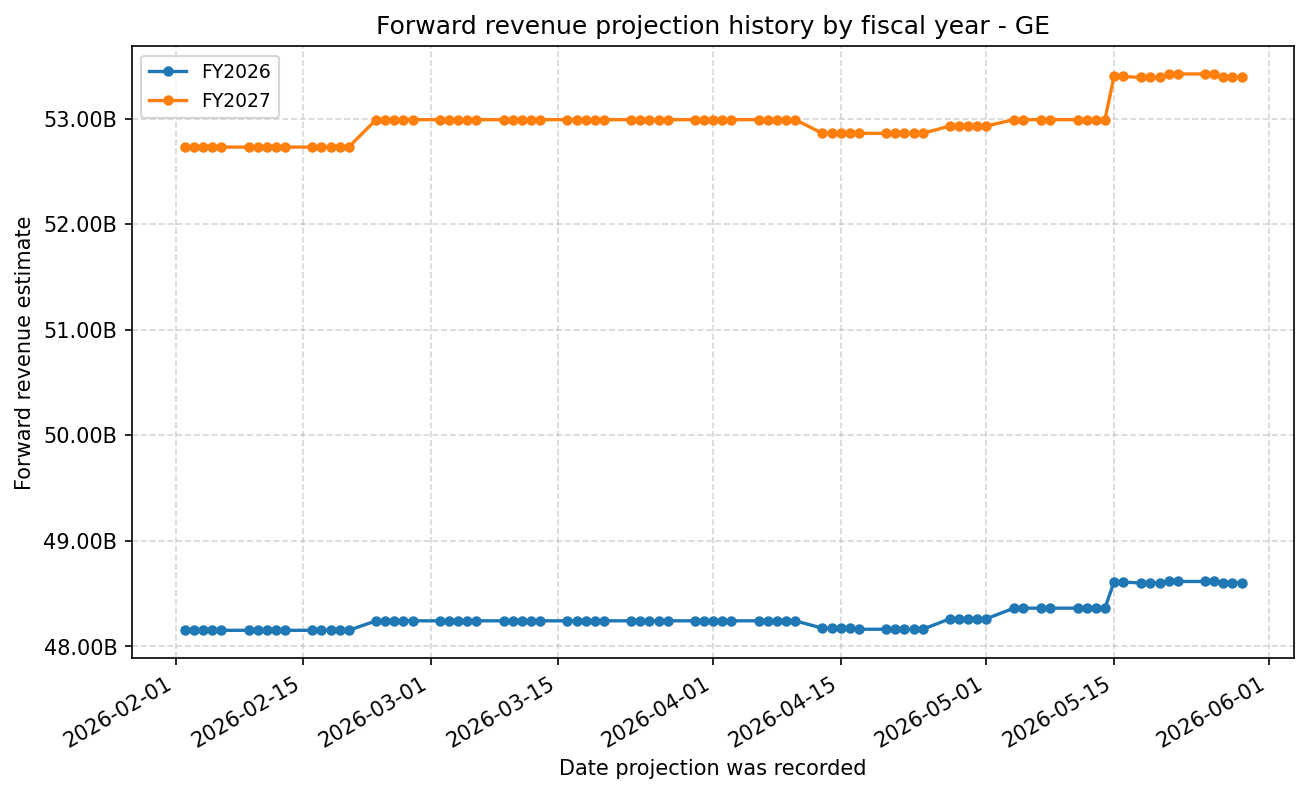
Forward Estimate History
How the next-FY EPS and revenue estimates have drifted over time. One line per fiscal year – past lines end when that FY became current.
Expenses
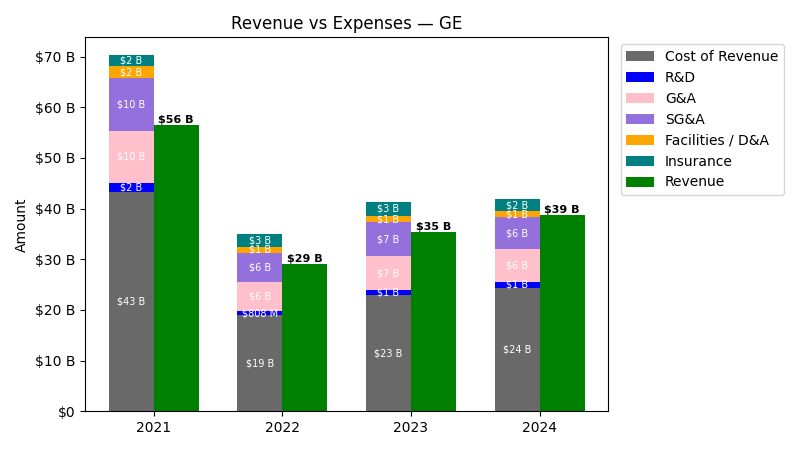
| Year | Revenue ($) | Cost of Revenue ($) | R&D ($) | Sales & Marketing ($) | G&A ($) | SG&A ($) | Facilities / D&A ($) | Insurance / Claims ($) |
|---|---|---|---|---|---|---|---|---|
| 2022 | $29.1B | $20.4B | $808.0M | $3.2B | $3.2B | $1.2B | $2.6B | |
| 2023 | $35.3B | $24.6B | $1.0B | $3.8B | $3.8B | $1.2B | $2.9B | |
| 2024 | $38.7B | $25.6B | $1.3B | $3.9B | $3.9B | $1.2B | $2.4B | |
| 2025 | $45.9B | $30.2B | $1.6B | $4.2B | $4.2B | $1.2B | $2.4B | |
| TTM | $48.3B | $32.0B | $1.7B | $1.2B | $7.3B | $4.4B | $1.2B | $2.4B |
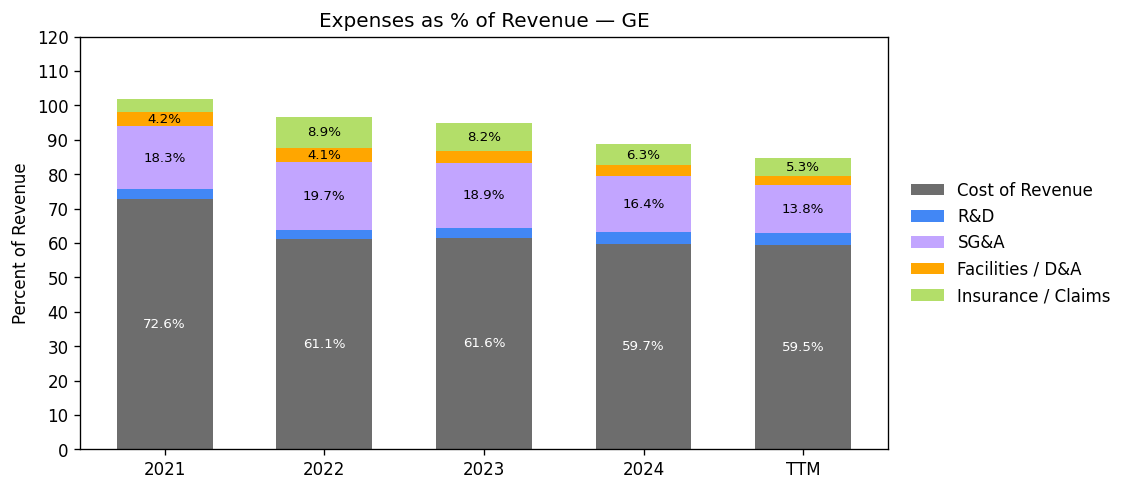
| Year | Revenue Change (%) | Cost of Revenue Change (%) | R&D Change (%) | G&A Change (%) | SG&A Change (%) | Facilities / D&A Change (%) | Insurance / Claims Change (%) |
|---|---|---|---|---|---|---|---|
| 2023 | 21.31 | 20.84 | 25.12 | 20.25 | 20.25 | -0.42 | 11.34 |
| 2024 | 9.49 | 3.68 | 27.20 | 3.24 | 3.24 | 0.42 | -15.84 |
| 2025 | 18.48 | 18.17 | 22.86 | 6.64 | 6.64 | 3.04 | 0.82 |
| TTM | 5.36 | 6.08 | 5.19 | 75.49 | 4.98 | 1.07 | -3.14 |
No unmapped expenses.
Segment Performance
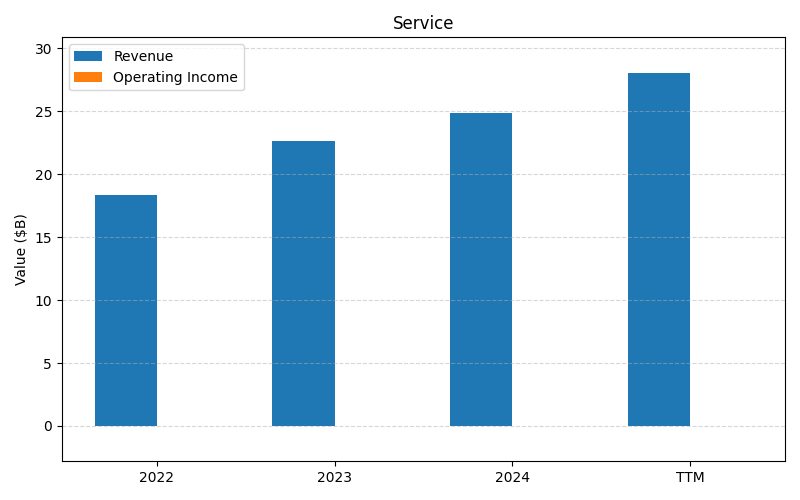
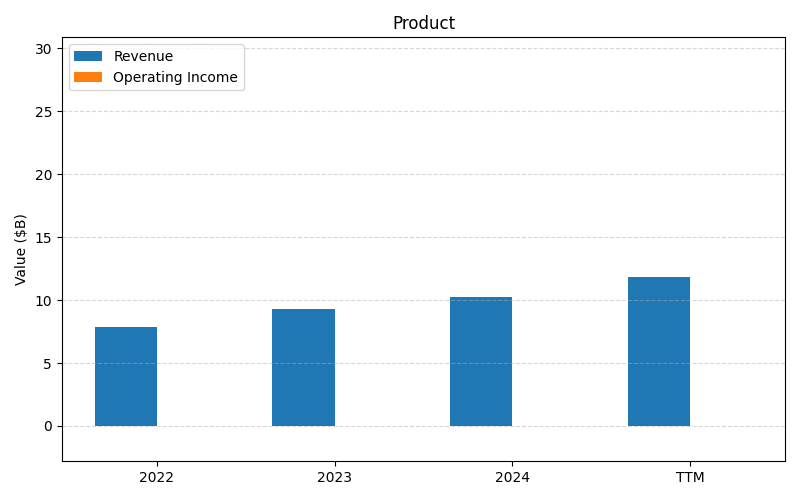
SEGMENTS v2025-09-09 · 2026-05-29 09:08 UTC — Units: $B. Rows list fiscal years (last 3 + TTM) with revenue for each segment; the final row shows the TTM revenue mix (operating income columns display “—” where mix is not applicable).
| Year | Services Rev | Prod Rev | Total Rev |
|---|---|---|---|
| 2023 | 22.6B | 9.32B | 32B |
| 2024 | 24.8B | 10.3B | 35.1B |
| 2025 | 30.2B | 12.2B | 42.3B |
| TTM | 69.7B | 28.4B | 98.1B |
| % of Total (TTM) | 71.1% | 28.9% | 100% |
Segment Performance (Axis 2)
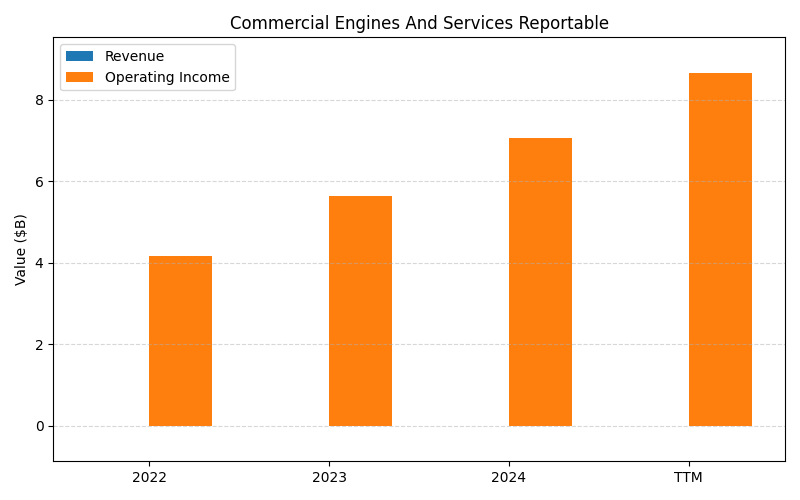
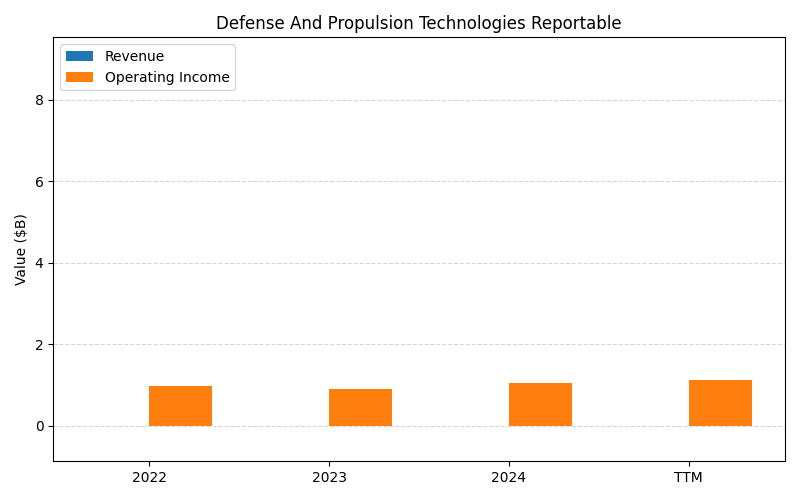
SEGMENTS v2025-09-09 · 2026-05-29 09:08 UTC — Units: $B. Rows list fiscal years (last 3 + TTM) with revenue and operating income for each segment; the final row shows the TTM revenue mix (operating income columns display “—” where mix is not applicable).
| Year | Commercial Engines And Services Reportable Rev | Commercial Engines And Services Reportable OI | Defense And Propulsion Technologies Reportable Rev | Defense And Propulsion Technologies Reportable OI | Total Rev | Total OI |
|---|---|---|---|---|---|---|
| 2023 | – | 5.64B | – | 0.91B | – | 6.55B |
| 2024 | – | 7.05B | – | 1.06B | – | 8.12B |
| 2025 | – | 8.86B | – | 1.30B | – | 10.2B |
| TTM | 0.00B | 20.2B | 0.00B | 3.06B | 0.00B | 23.2B |
Balance Sheet
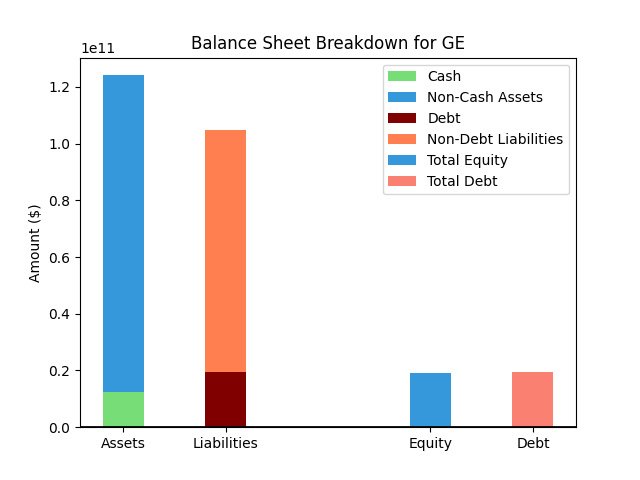
| Metric | Value | |
|---|---|---|
| 0 | Total Assets | $128,445M |
| 1 | Cash | $10,981M |
| 2 | Total Liabilities | $110,148M |
| 3 | Total Debt | $20,277M |
| 4 | Total Equity | $18,057M |
| 5 | Debt to Equity Ratio | 1.12 |
EPS & Dividend
Valuation
| Share Price | Treasury Yield | Estimates | Fair Value (P/E) | Fair Value (P/S) | Current P/S | Current P/E |
|---|---|---|---|---|---|---|
| $323.76 | 4.5% | Nicks Growth: 2% Nick's Expected Margin: 14% FINVIZ Growth: 16% |
Nicks: 8 Finviz: 29 |
Nick's: 1.092 | 7.0 | 40.2 |
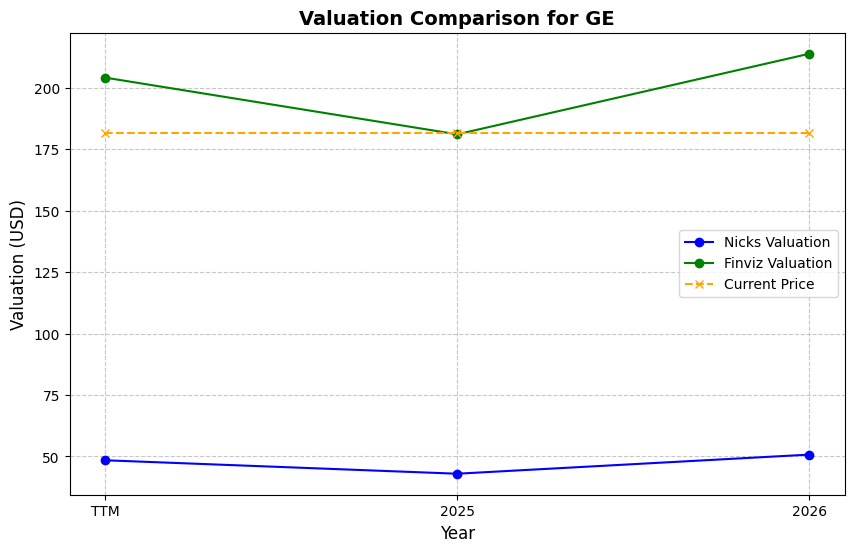
| Basis | Year | Nicks Valuation | Nicks vs Share Price | Finviz Valuation | Finviz vs Share Price |
|---|---|---|---|---|---|
| $8.05 EPS | TTM | $62.80 | -80.6% | $229.96 | -29.0% |
| $7.56 EPS | 2026 | $58.97 | -81.8% | $215.93 | -33.3% |
| $9.32 EPS | 2027 | $72.70 | -77.5% | $266.21 | -17.8% |
Implied Growth
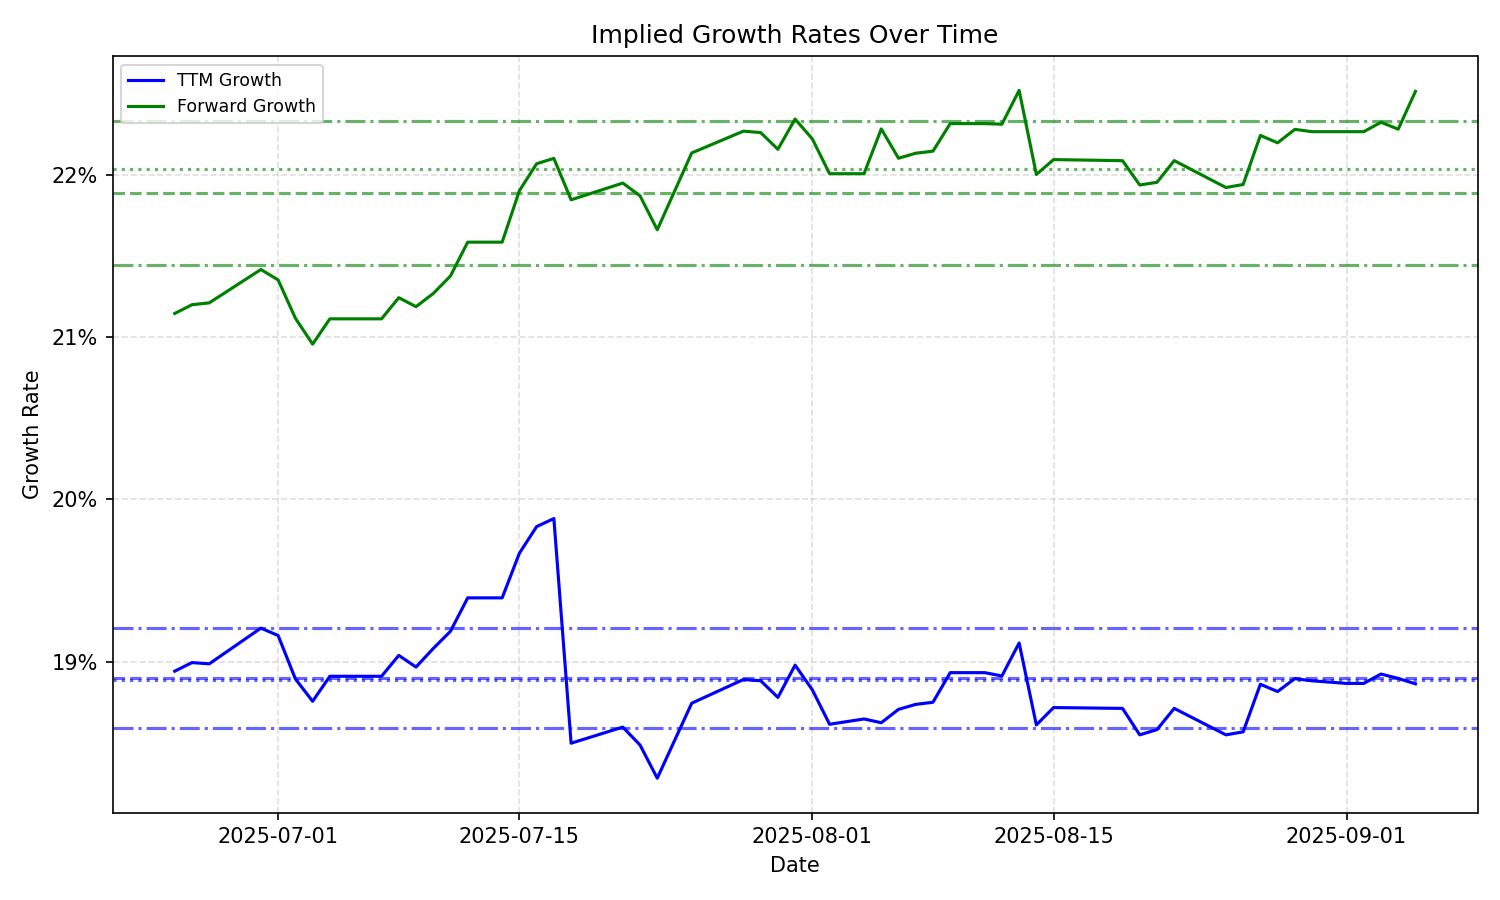
| Average | Median | Std Dev | Current | Percentile | ||||||
|---|---|---|---|---|---|---|---|---|---|---|
| TTM | Forward | TTM | Forward | TTM | Forward | TTM | Forward | TTM | Forward | |
| Timeframe | ||||||||||
| 1 Year | 19.07% | 21.94% | 18.98% | 22.30% | 0.45% | 1.56% | 19.28% | 18.43% | 66.5% | 7.7% |
| 3 Years | 19.07% | 21.94% | 18.98% | 22.30% | 0.45% | 1.56% | 19.28% | 18.43% | 66.5% | 7.7% |
| 5 Years | 19.07% | 21.94% | 18.98% | 22.30% | 0.45% | 1.56% | 19.28% | 18.43% | 66.5% | 7.7% |
| 10 Years | 19.07% | 21.94% | 18.98% | 22.30% | 0.45% | 1.56% | 19.28% | 18.43% | 66.5% | 7.7% |