Ford Motor Company — F
| Close Price | Market Cap | P/E Ratio | Forward P/E Ratio | Implied Growth* | Implied Forward Growth* | Dividend | P/B Ratio |
|---|---|---|---|---|---|---|---|
| $17.44 | $69.49B | - | 9.5 | N/A | 3.9% | $0.60 3.4% | 1.9 |
Latest Headlines
- · Why GM Stock Is Rising Even Though The Car Industry Is Shrinking
- · Ford Just Rallied 43% In a Month: What Could Push the Stock to $20 Per Share?
- · Ford Surges 40% As AI Energy Trade Pushes Shares To 2022 High
- · Why Is Ford Motor (F) Up 37.8% Since Last Earnings Report?
- · Nuclear Stock Face-Off: Is Oklo or NuScale Power the Better Buy Right Now?
- · The AI Play Nobody Saw Coming -- and It Comes With a Lucrative Dividend
Revenue & Net Income
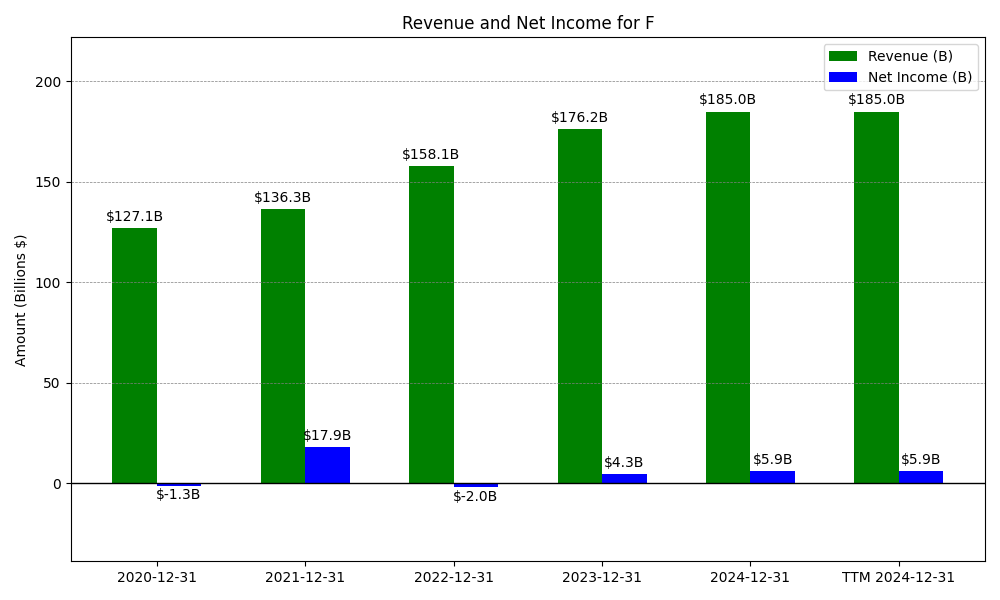
| Date | Revenue | Net_Income | EPS | Last_Updated | Revenue_Change | Net_Income_Change | EPS_Change | |
|---|---|---|---|---|---|---|---|---|
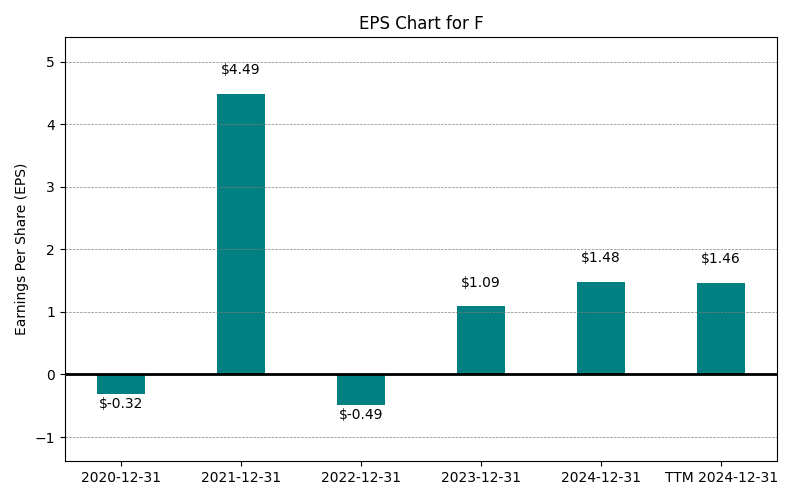
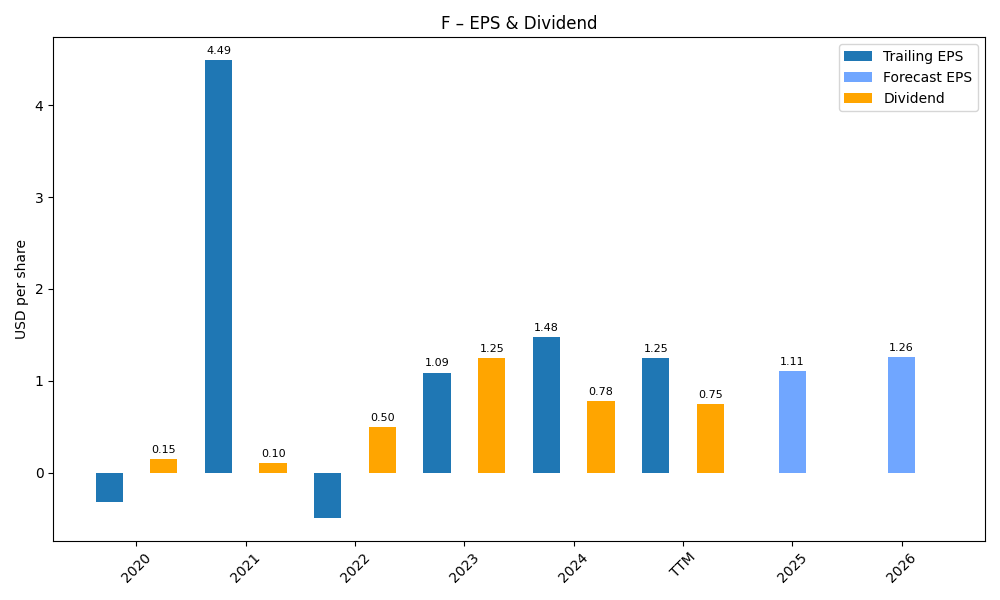
| 0 | 2020-12-31 | $127,144M | $-1,279M | $-0.32 | 2024-02-03 03:17:10 | N/A | N/A | N/A |
| 1 | 2021-12-31 | $136,341M | $17,937M | $4.49 | 2026-02-13 08:37:14 | 7.2% | -1502.4% | -1503.1% |
| 2 | 2022-12-31 | $158,057M | $-1,981M | $-0.49 | 2026-05-29 09:08:01 | 15.9% | -111.0% | -110.9% |
| 3 | 2023-12-31 | $176,191M | $4,347M | $1.09 | 2026-05-29 09:08:01 | 11.5% | -319.4% | -322.4% |
| 4 | 2024-12-31 | $184,992M | $5,879M | $1.48 | 2026-05-29 09:08:01 | 5.0% | 35.2% | 35.8% |
| 5 | 2025-12-31 | $187,267M | $-8,182M | $-2.06 | 2026-05-29 09:08:01 | 1.2% | -239.2% | -239.2% |
| 6 | TTM 2026-03-31 | $189,861M | $-6,105M | $-1.55 | 2026-05-04 08:52:32 | 1.4% | -25.4% | -24.8% |
EPS
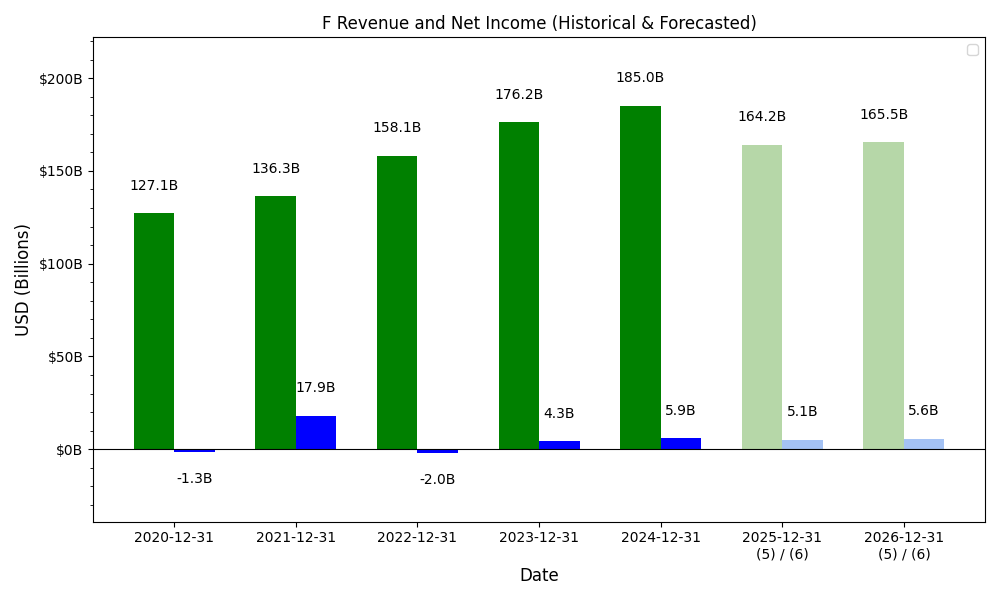
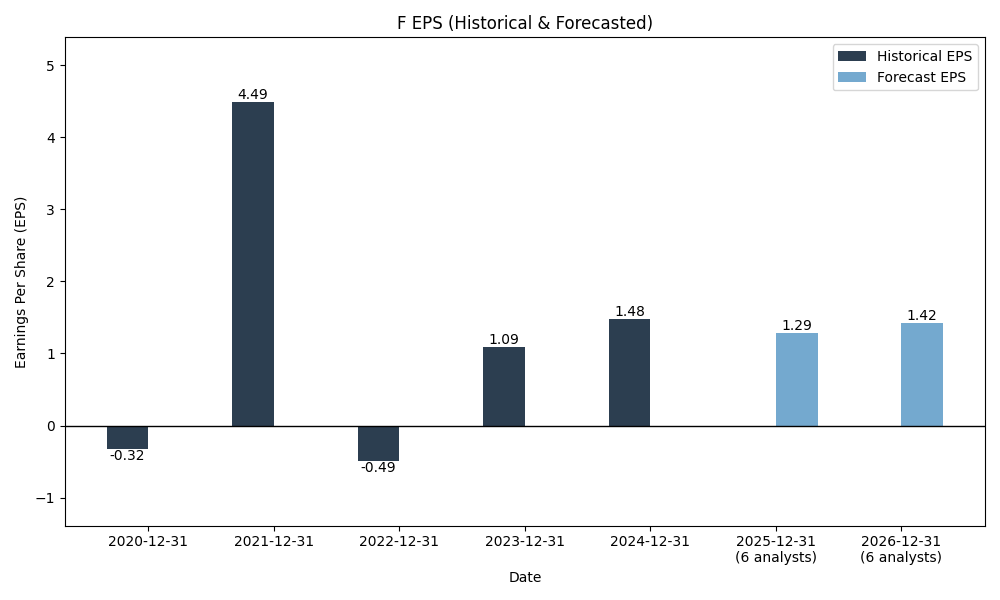
Forecasts
Y/Y % Change
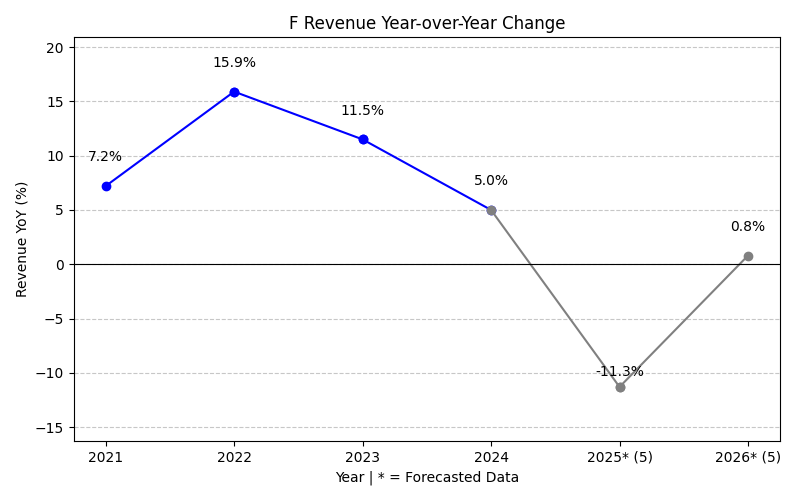
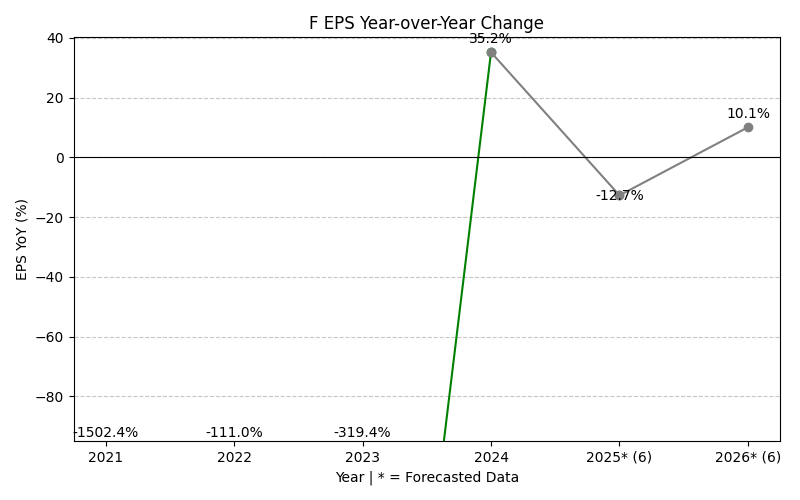
F Year-over-Year Growth
| 2020 | 2021 | 2022 | 2023 | 2024 | 2025 | 2026 | 2027 | Average | |
|---|---|---|---|---|---|---|---|---|---|
| Revenue Growth (%) | 7.2% | 15.9% | 11.5% | 5.0% | 1.2% | -6.3% | 1.9% | 5.2% | |
| Revenue Analysts (#) | 0 | 0 | 0 | 0 | 0 | 0 | 11 | 11 | |
| EPS Growth (%) | -1502.4% | -111.0% | -319.4% | 35.2% | -239.2% | -179.3% | 12.7% | -329.1% | |
| EPS Analysts (#) | 0 | 0 | 0 | 0 | 0 | 0 | 22 | 22 |
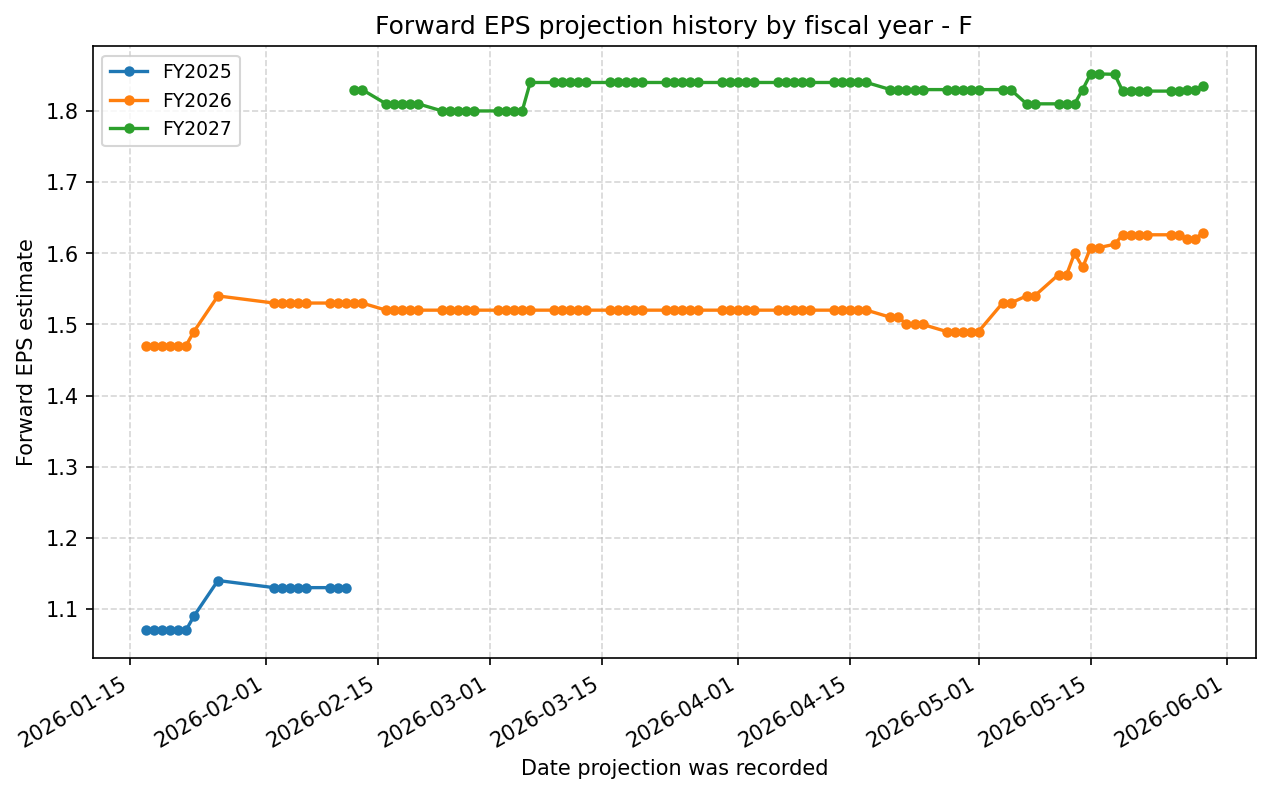
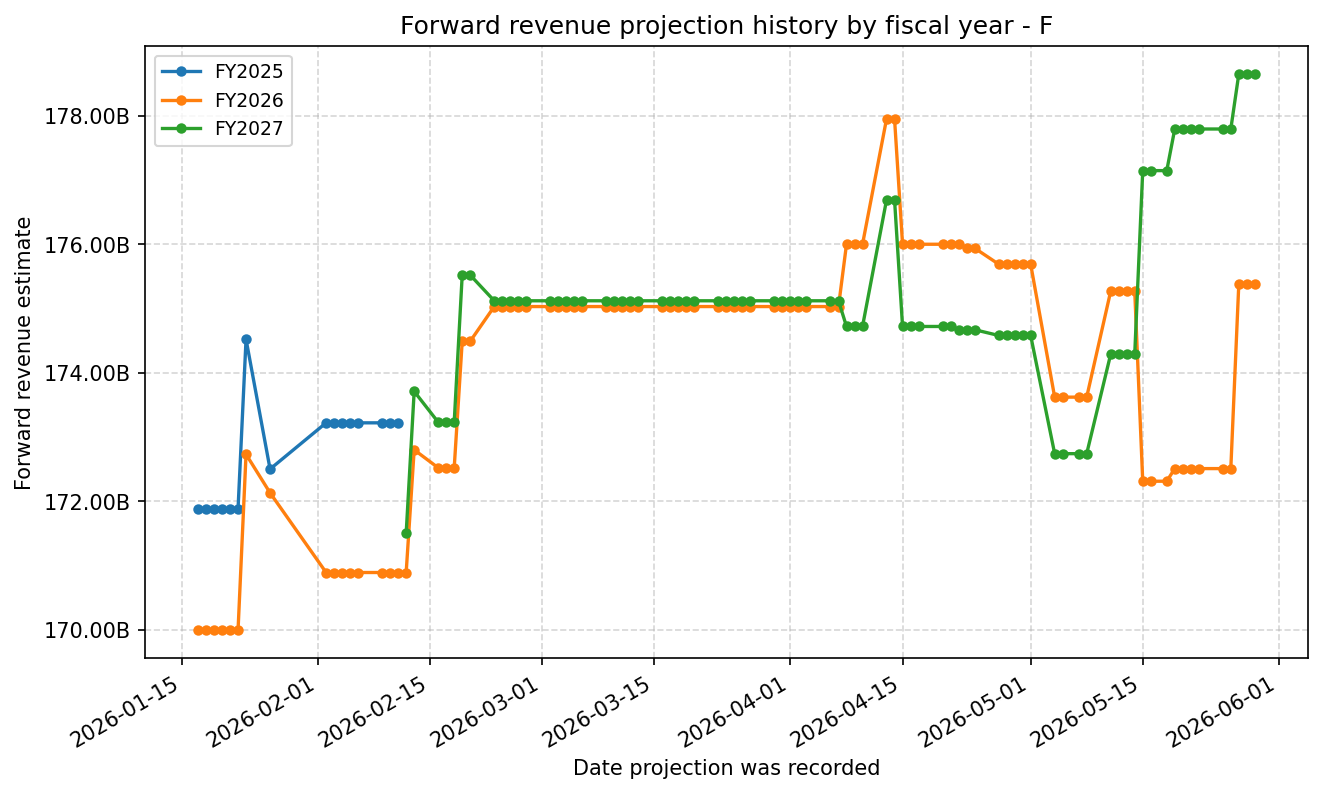
Forward Estimate History
How the next-FY EPS and revenue estimates have drifted over time. One line per fiscal year – past lines end when that FY became current.
Expenses
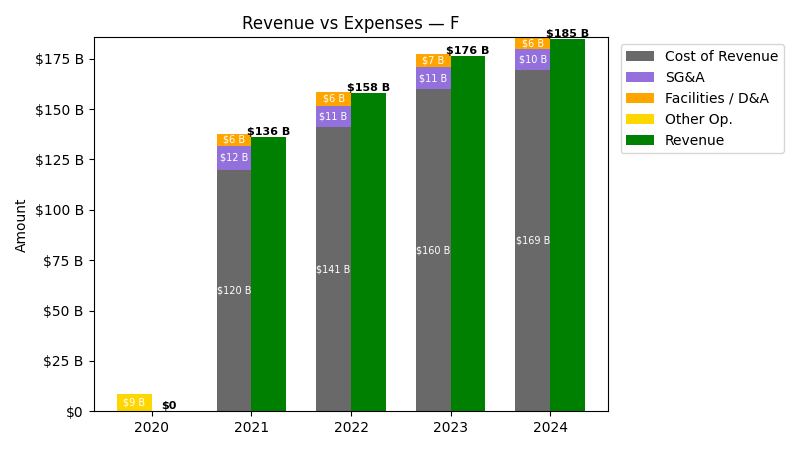
| Year | Revenue ($) | Cost of Revenue ($) | SG&A ($) | Facilities / D&A ($) |
|---|---|---|---|---|
| 2022 | $158.1B | $134.4B | $10.9B | $6.5B |
| 2023 | $176.2B | $153.5B | $10.7B | $6.5B |
| 2024 | $185.0B | $163.6B | $10.3B | $5.9B |
| 2025 | $187.3B | $171.5B | $10.8B | $14.1B |
| TTM | $189.9B | $171.6B | $11.2B | $14.2B |
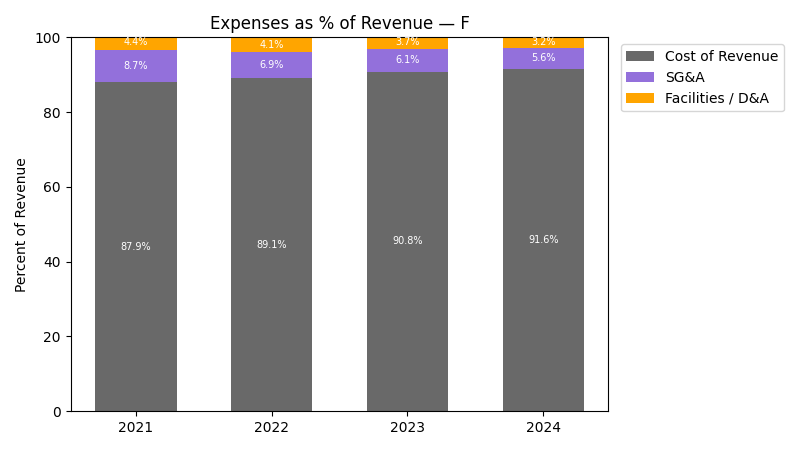
| Year | Revenue Change (%) | Cost of Revenue Change (%) | SG&A Change (%) | Facilities / D&A Change (%) |
|---|---|---|---|---|
| 2023 | 11.47 | 14.22 | -1.71 | 0.46 |
| 2024 | 5.00 | 6.59 | -3.88 | -10.06 |
| 2025 | 1.23 | 4.79 | 5.46 | 140.92 |
| TTM | 1.39 | 0.10 | 3.47 | 0.29 |
No unmapped expenses.
Segment Performance

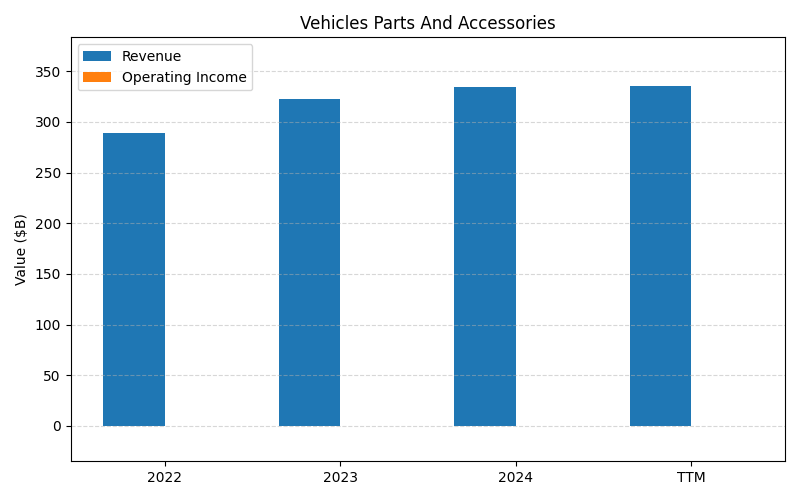
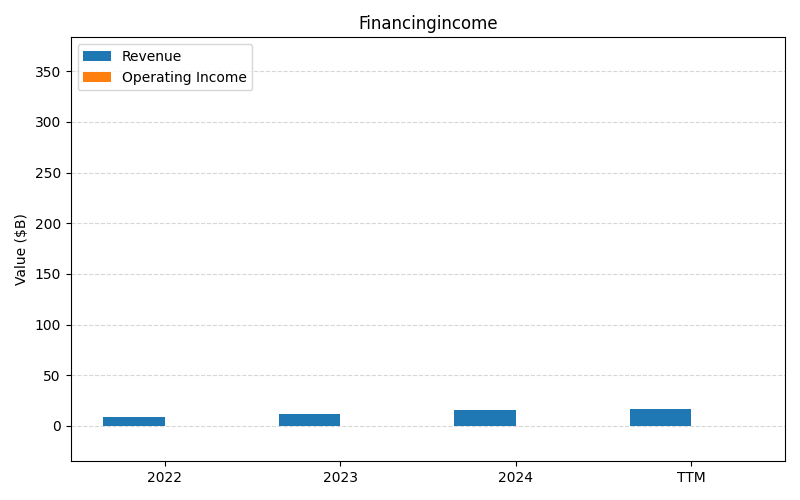
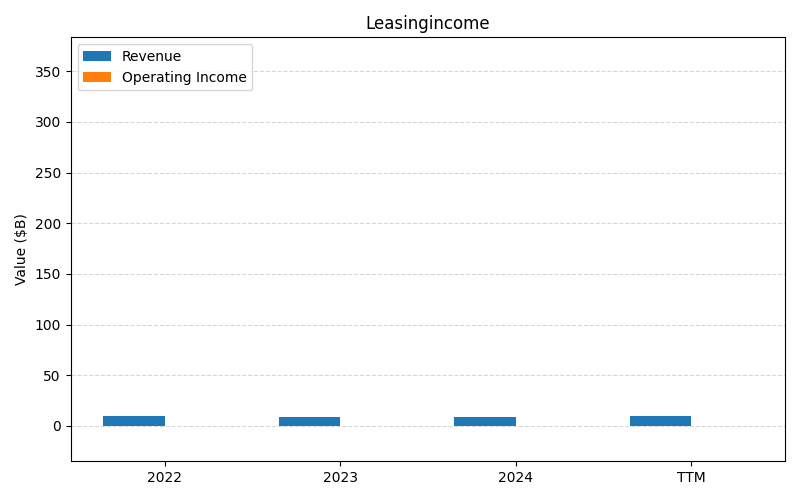
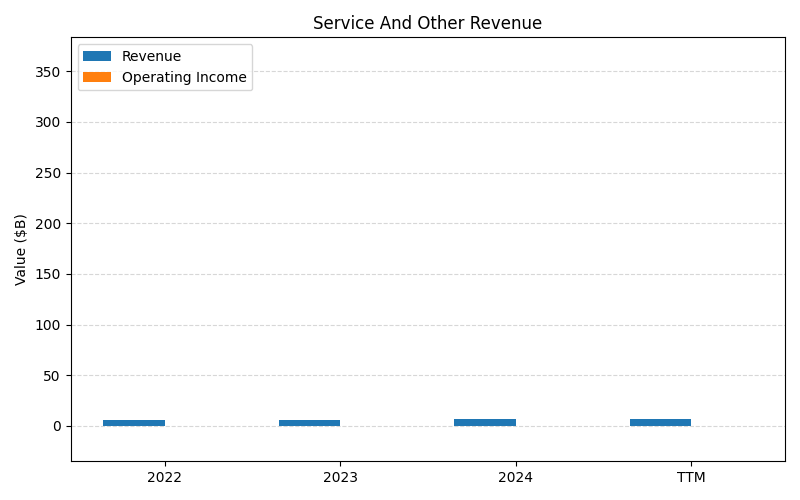
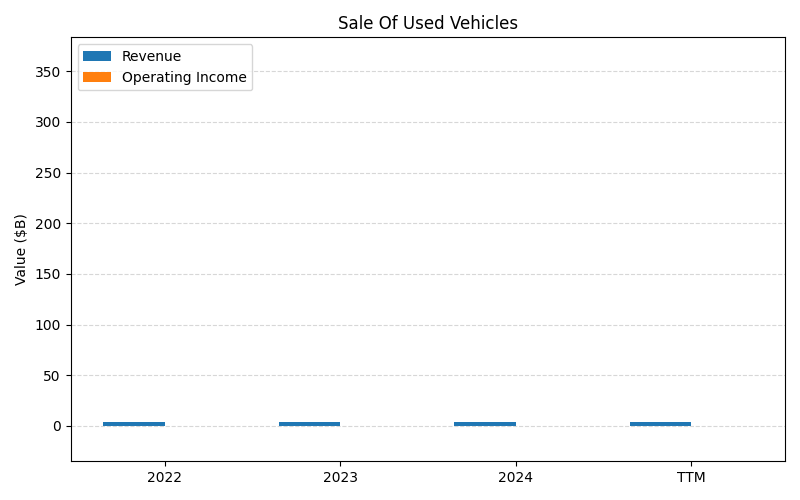
SEGMENTS v2025-09-09 · 2026-05-29 09:08 UTC — Units: $B. Rows list fiscal years (last 3 + TTM) with revenue for each segment; the final row shows the TTM revenue mix (operating income columns display “—” where mix is not applicable).
| Year | All Sales Type Products And Services Rev | Vehicles Parts And Accessories Rev | Financingincome Rev | Leasingincome Rev | Service And Other Revenue Rev | Sale Of Used Vehicles Rev | Insuranceincome Rev | Total Rev |
|---|---|---|---|---|---|---|---|---|
| 2023 | 331.7B | 322.1B | 12B | 8.57B | 5.80B | 3.75B | 0.20B | 684B |
| 2024 | 345.2B | 334.4B | 15.6B | 8.86B | 6.41B | 4.35B | 0.29B | 715.2B |
| 2025 | 347.5B | 334.6B | 16.4B | 10.3B | 7.17B | 5.71B | 0.33B | 722B |
| TTM | 847B | 816.1B | 40.2B | 24.4B | 17.2B | 13.7B | 0.79B | 1759.3B |
| % of Total (TTM) | 48.1% | 46.4% | 2.3% | 1.4% | 1.0% | 0.8% | 0.0% | 100% |
Segment Performance (Axis 2)
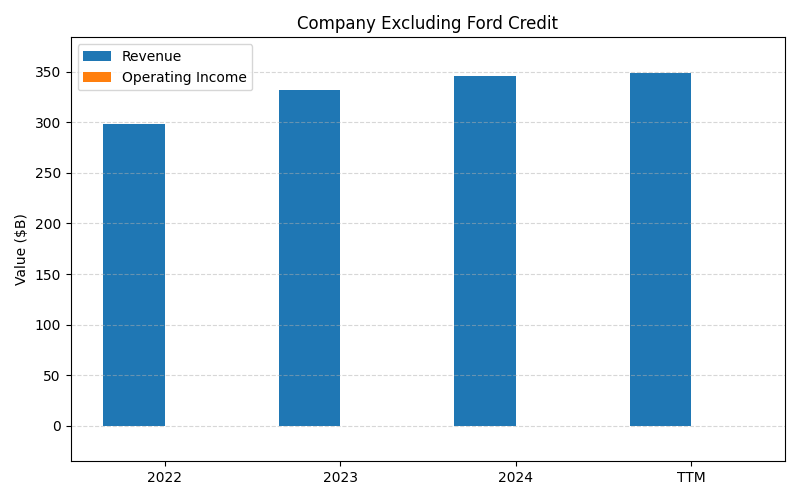
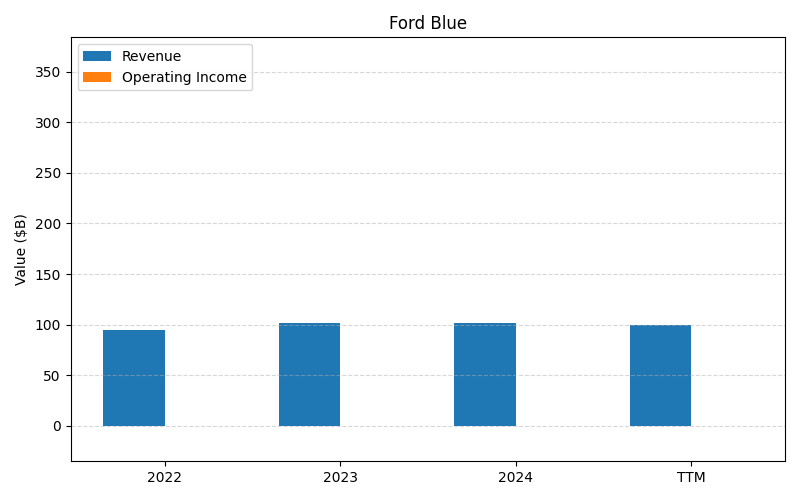
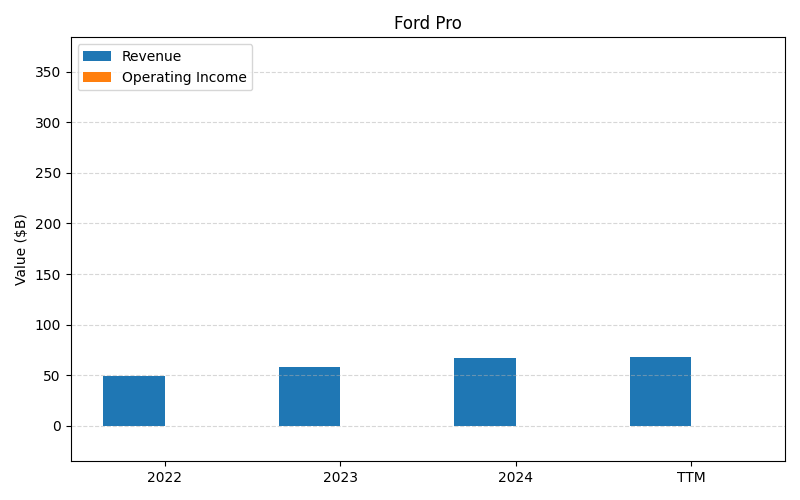
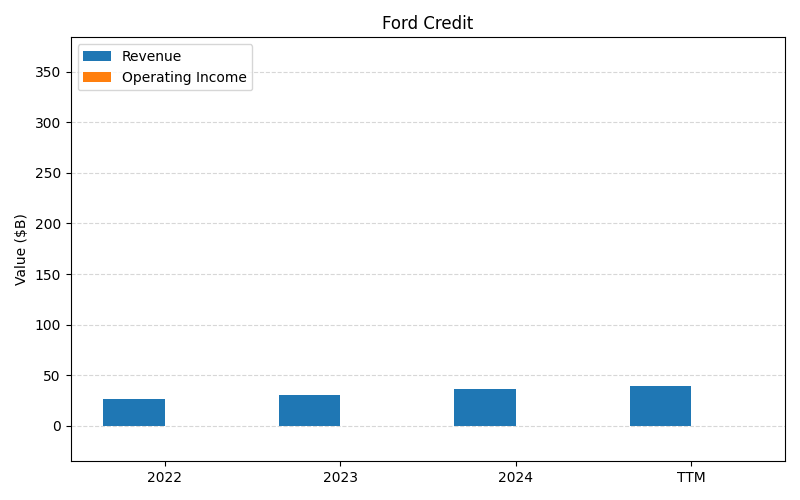
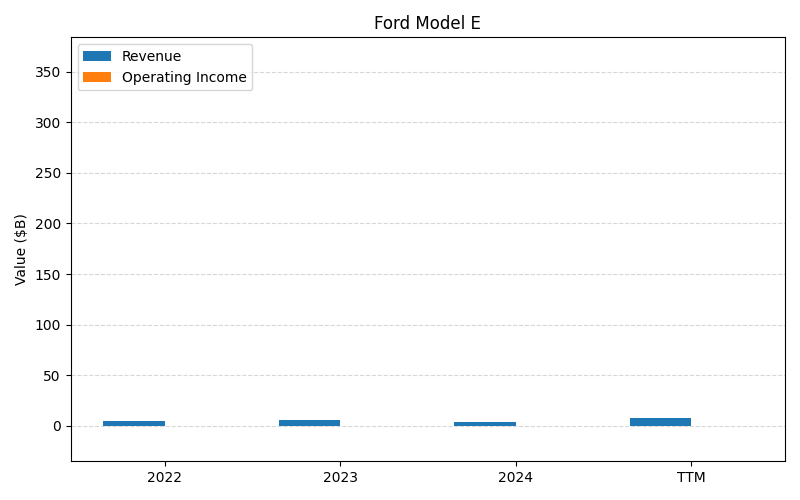
SEGMENTS v2025-09-09 · 2026-05-29 09:08 UTC — Units: $B. Rows list fiscal years (last 3 + TTM) with revenue for each segment; the final row shows the TTM revenue mix (operating income columns display “—” where mix is not applicable).
| Year | Company Excluding Ford Credit Rev | Ford Blue Rev | Ford Pro Rev | Ford Credit Rev | Ford Model E Rev | Total Rev |
|---|---|---|---|---|---|---|
| 2023 | 331.8B | 203.9B | 116.1B | 41.2B | 11.8B | 704.7B |
| 2024 | 345.4B | 203.9B | 133.8B | 49.1B | 7.72B | 740B |
| 2025 | 348B | 202B | 132.6B | 53.1B | 13.3B | 749B |
| TTM | 847.9B | 495.6B | 326.2B | 128.9B | 26B | 1824.6B |
| % of Total (TTM) | 46.5% | 27.2% | 17.9% | 7.1% | 1.4% | 100% |
Balance Sheet
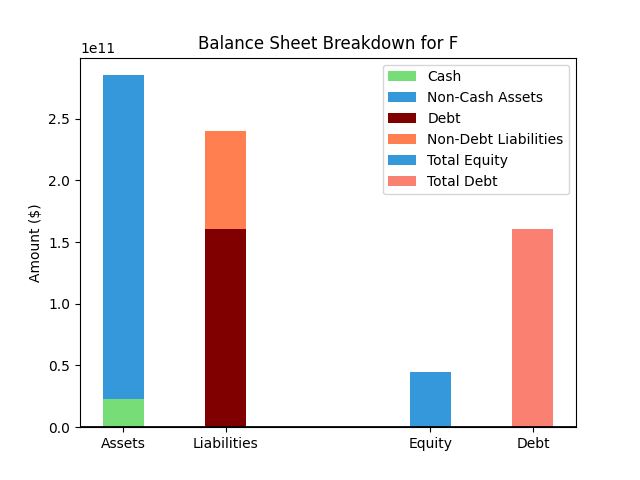
| Metric | Value | |
|---|---|---|
| 0 | Total Assets | $282,434M |
| 1 | Cash | $17,649M |
| 2 | Total Liabilities | $244,950M |
| 3 | Total Debt | $159,511M |
| 4 | Total Equity | $37,453M |
| 5 | Debt to Equity Ratio | 4.26 |
EPS & Dividend
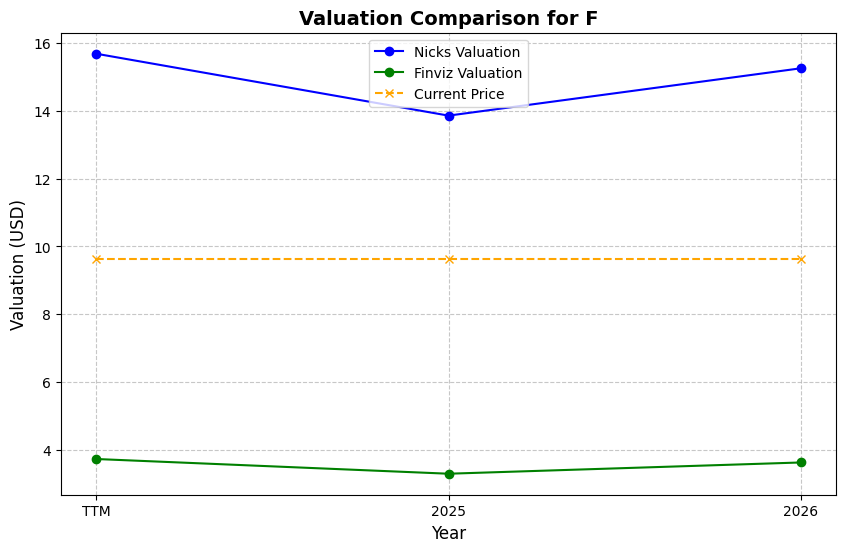
Valuation
| Share Price | Treasury Yield | Estimates | Fair Value (P/E) | Fair Value (P/S) | Current P/S | Current P/E |
|---|---|---|---|---|---|---|
| $17.44 | 4.5% | Nicks Growth: 5% Nick's Expected Margin: 2% FINVIZ Growth: 24% |
Nicks: 11 Finviz: 58 |
Nick's: 0.211 | 0.4 | - |
| Basis | Year | Nicks Valuation | Nicks vs Share Price | Finviz Valuation | Finviz vs Share Price |
|---|---|---|---|---|---|
| $47.65 Revenue | TTM | $10.06 | -42.3% | $55.45 | 218.0% |
| $1.63 EPS | 2026 | $17.19 | -1.4% | $94.73 | 443.2% |
| $1.84 EPS | 2027 | $19.38 | 11.1% | $106.79 | 512.3% |
Implied Growth
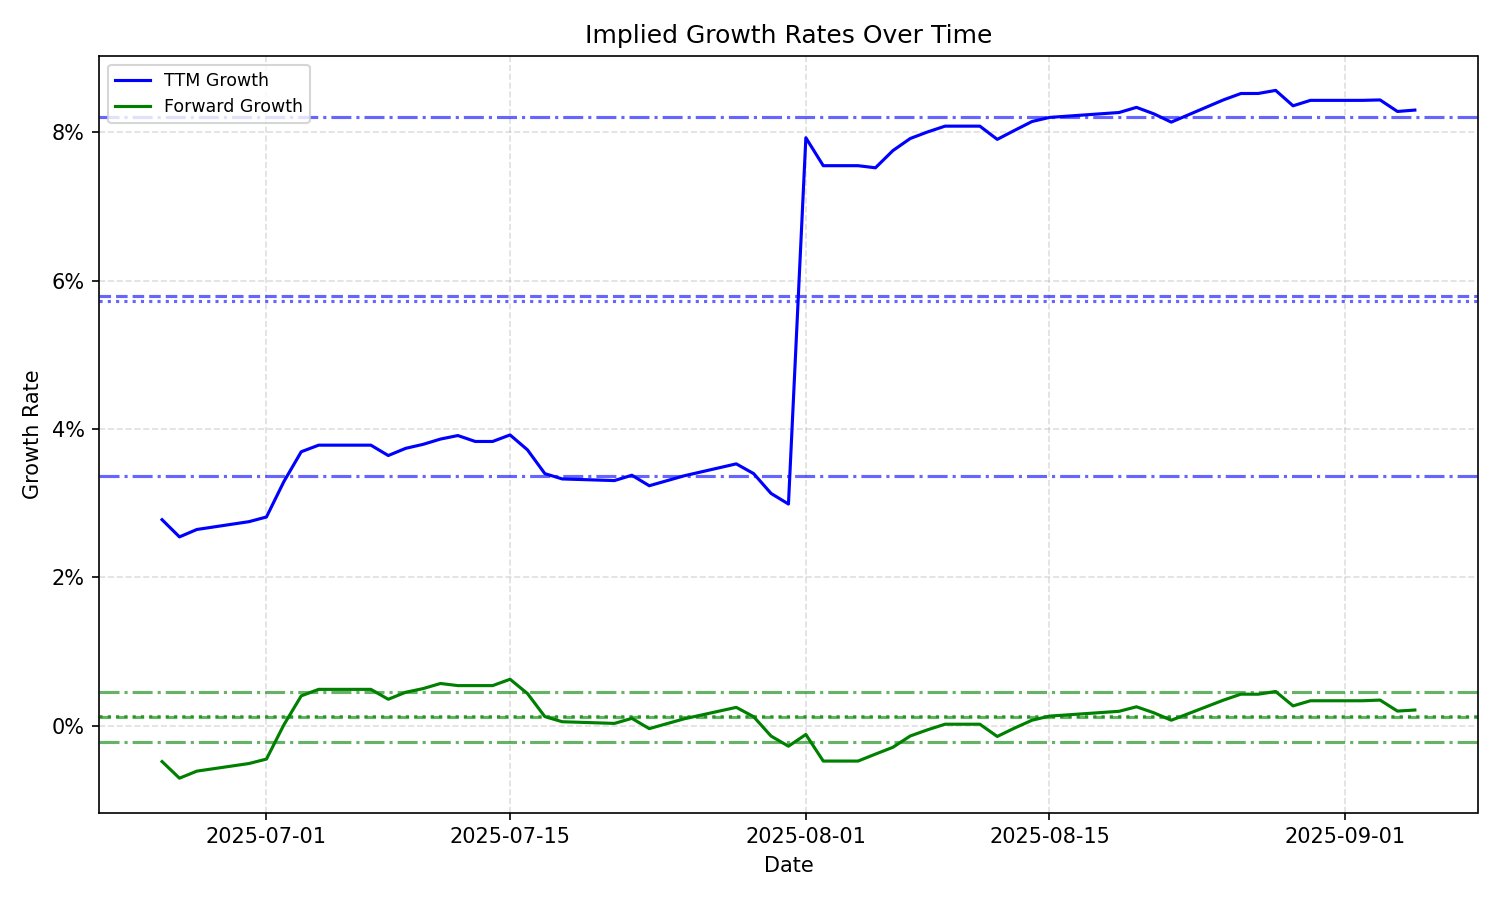
| Average | Median | Std Dev | Current | Percentile | ||||||
|---|---|---|---|---|---|---|---|---|---|---|
| TTM | Forward | TTM | Forward | TTM | Forward | TTM | Forward | TTM | Forward | |
| Timeframe | ||||||||||
| 1 Year | 6.26% | 0.90% | 5.76% | 0.46% | 1.85% | 1.12% | 5.87% | 3.49% | 55.2% | 97.9% |
| 3 Years | 6.26% | 0.90% | 5.76% | 0.46% | 1.85% | 1.12% | 5.87% | 3.49% | 55.2% | 97.9% |
| 5 Years | 6.26% | 0.90% | 5.76% | 0.46% | 1.85% | 1.12% | 5.87% | 3.49% | 55.2% | 97.9% |
| 10 Years | 6.26% | 0.90% | 5.76% | 0.46% | 1.85% | 1.12% | 5.87% | 3.49% | 55.2% | 97.9% |