First Solar, Inc. — FSLR
| Close Price | Market Cap | P/E Ratio | Forward P/E Ratio | Implied Growth* | Implied Forward Growth* | Dividend | P/B Ratio |
|---|---|---|---|---|---|---|---|
| $306.79 | $32.97B | 19.8 | 13.1 | 11.5% | 7.2% | - | 3.3 |
Latest Headlines
- · Why First Solar Stock Is Soaring This Week
- · First Solar (FSLR) Shares Skyrocket, What You Need To Know
- · Stock Market Today: Nasdaq Leads Rise To Record Highs On Iran Deal Hopes; Drone Stocks Fly High
- · Solar Stocks Surge on Breakout Signals Amid Rising Tariff Tensions
- · Solar Stocks To Watch As AI Drives Energy Demand
- · Zacks Industry Outlook Highlights First Solar, Enphase Energy and Canadian Solar
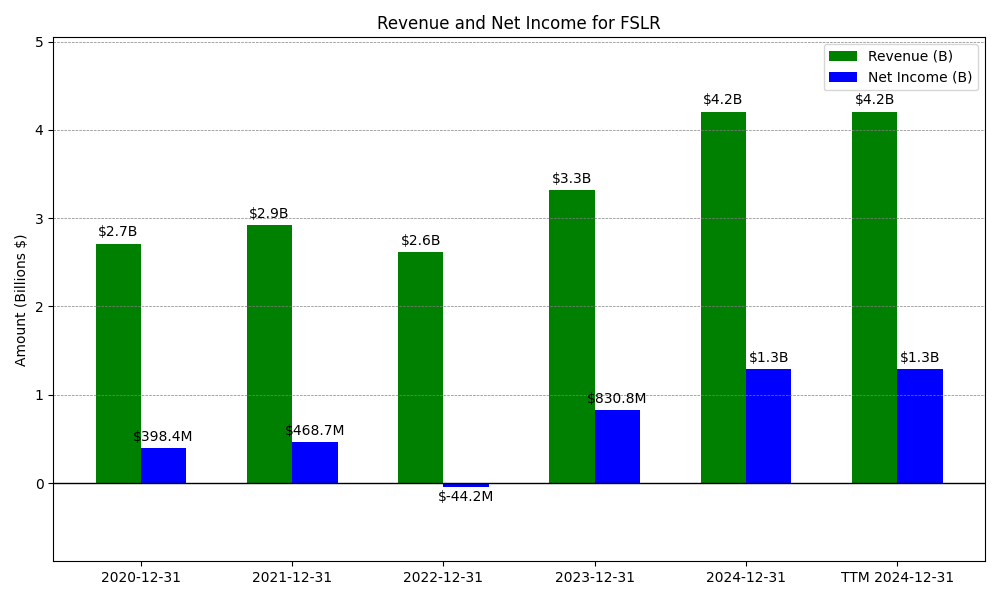
Revenue & Net Income
| Date | Revenue | Net_Income | EPS | Last_Updated | Revenue_Change | Net_Income_Change | EPS_Change | |
|---|---|---|---|---|---|---|---|---|
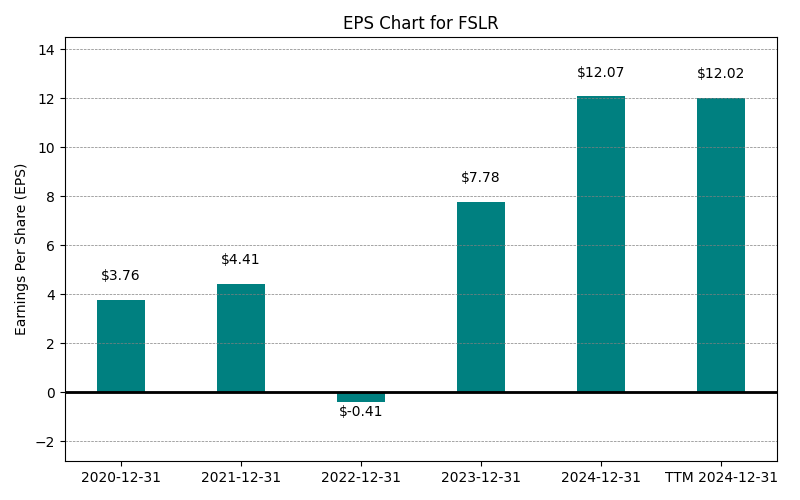
| 0 | 2020-12-31 | $2,711M | $398M | $3.76 | 2024-02-03 03:17:10 | N/A | N/A | N/A |
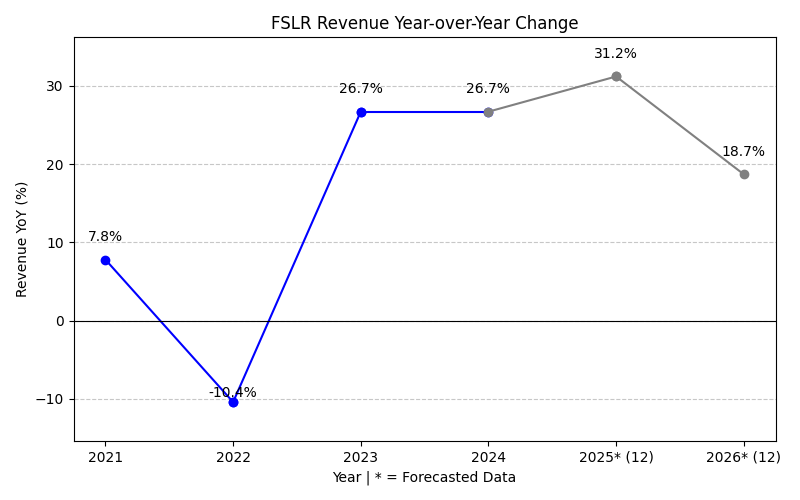
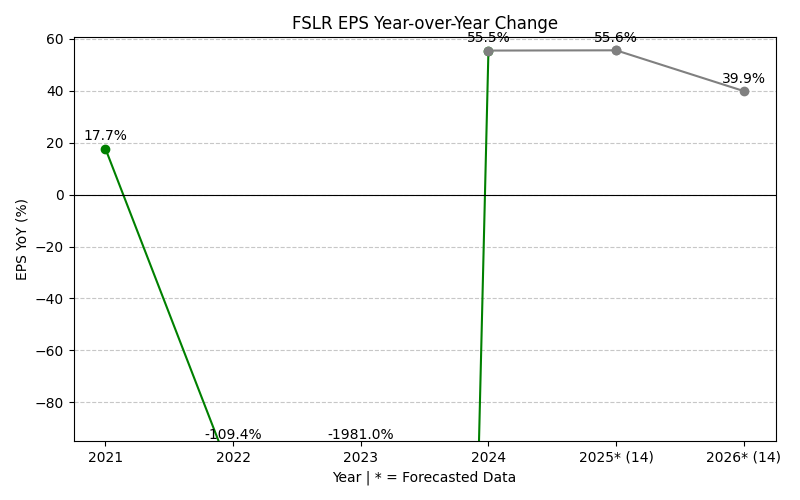
| 1 | 2021-12-31 | $2,923M | $469M | $4.41 | 2026-03-02 08:38:46 | 7.8% | 17.7% | 17.3% |
| 2 | 2022-12-31 | $2,619M | $-44M | $-0.41 | 2026-05-29 09:08:11 | -10.4% | -109.4% | -109.3% |
| 3 | 2023-12-31 | $3,319M | $831M | $7.78 | 2026-05-29 09:08:11 | 26.7% | -1981.0% | -1997.6% |
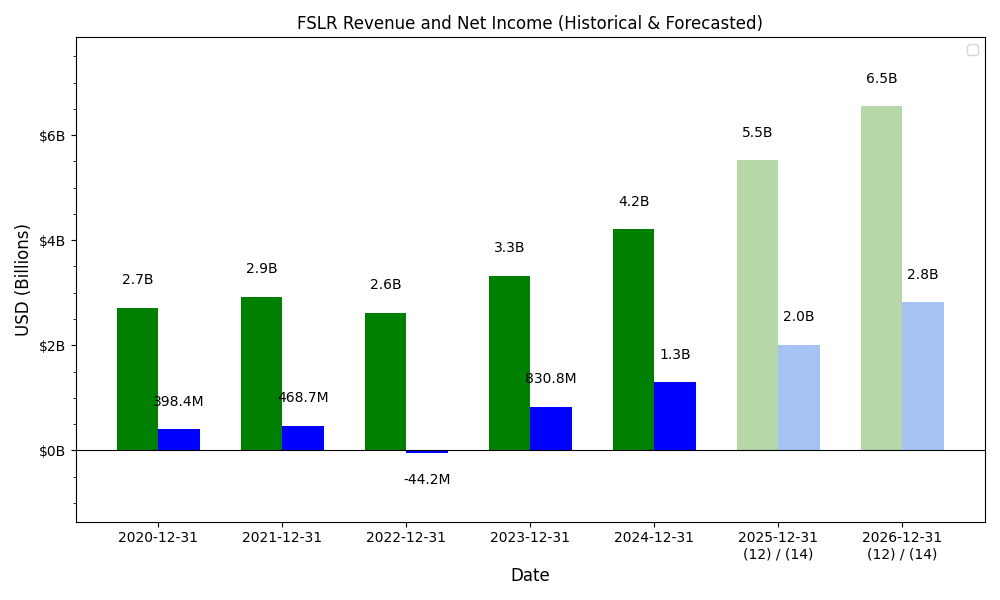
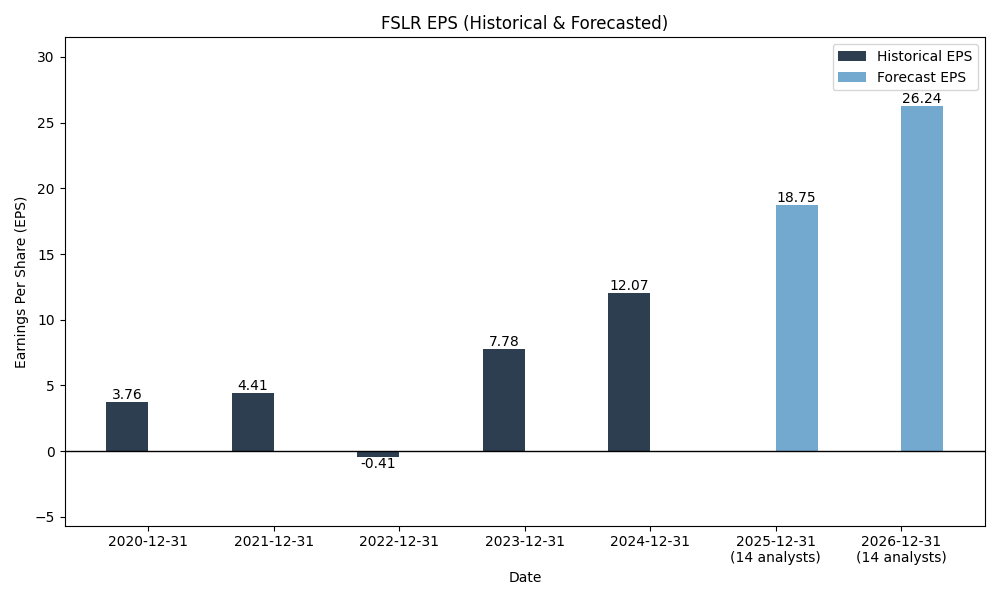
| 4 | 2024-12-31 | $4,206M | $1,292M | $12.07 | 2026-05-29 09:08:11 | 26.7% | 55.5% | 55.1% |
| 5 | 2025-12-31 | $5,219M | $1,528M | $14.25 | 2026-05-29 09:08:11 | 24.1% | 18.3% | 18.1% |
| 6 | TTM 2026-03-31 | $5,419M | $1,665M | $15.47 | 2026-05-04 08:52:42 | 3.8% | 9.0% | 8.6% |
EPS
Forecasts
Y/Y % Change
FSLR Year-over-Year Growth
| 2020 | 2021 | 2022 | 2023 | 2024 | 2025 | 2026 | 2027 | Average | |
|---|---|---|---|---|---|---|---|---|---|
| Revenue Growth (%) | 7.8% | -10.4% | 26.7% | 26.7% | 24.1% | -2.3% | 16.1% | 12.7% | |
| Revenue Analysts (#) | 0 | 0 | 0 | 0 | 0 | 0 | 28 | 27 | |
| EPS Growth (%) | 17.7% | -109.4% | -1981.0% | 55.5% | 18.3% | 22.3% | 33.1% | -277.6% | |
| EPS Analysts (#) | 0 | 0 | 0 | 0 | 0 | 0 | 29 | 28 |
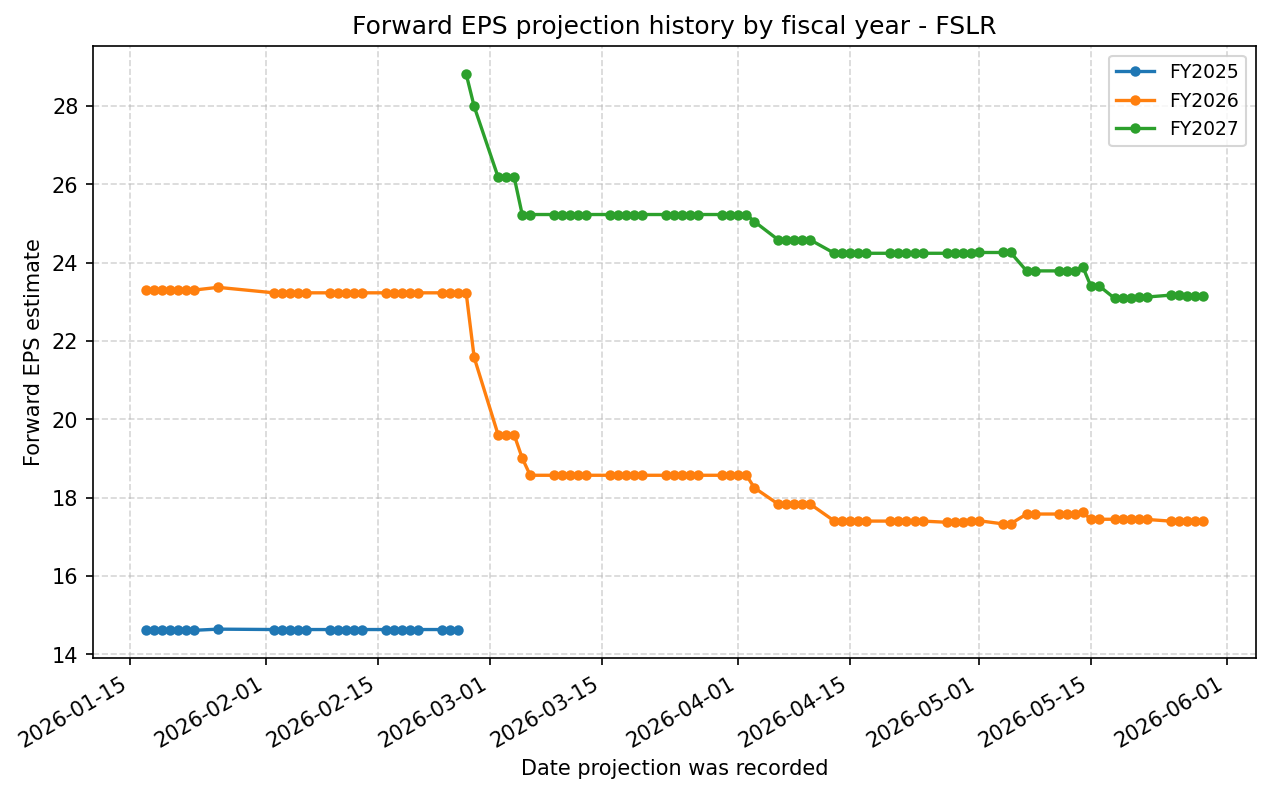
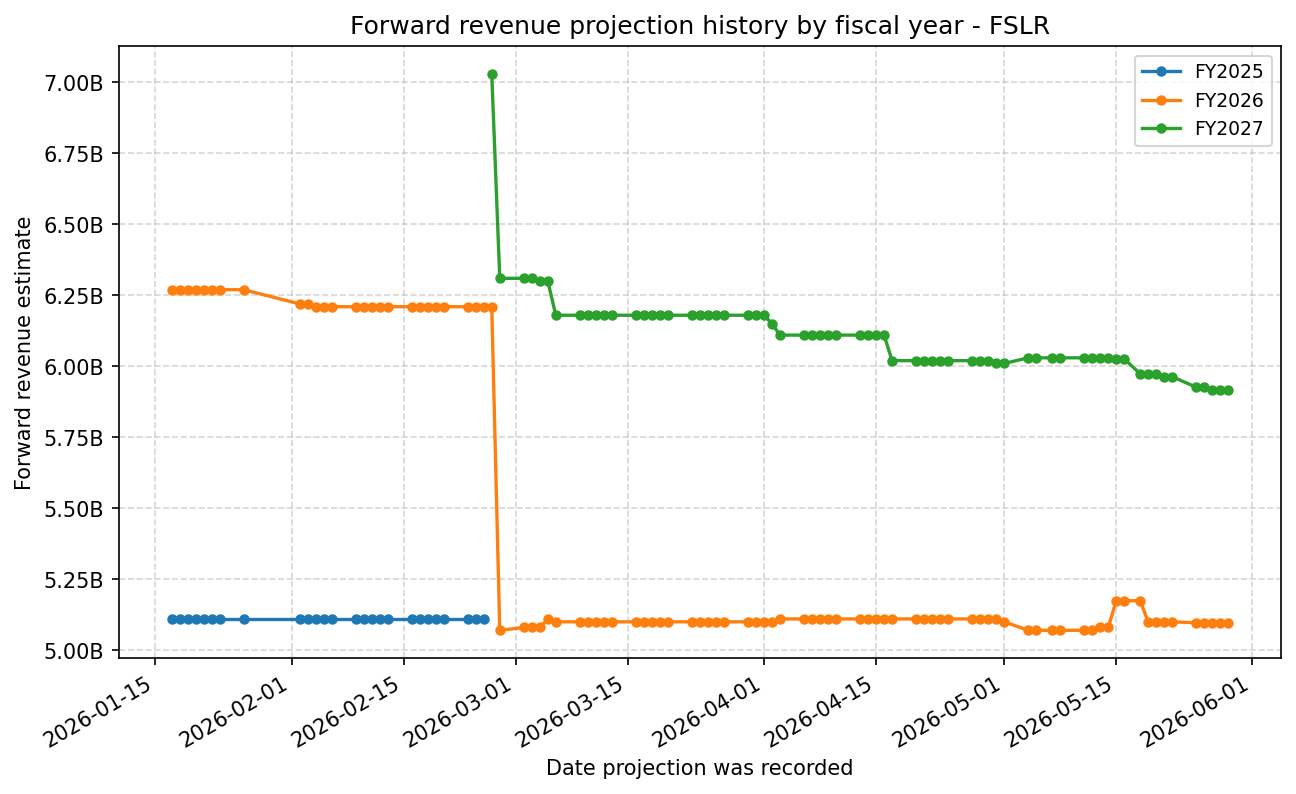
Forward Estimate History
How the next-FY EPS and revenue estimates have drifted over time. One line per fiscal year – past lines end when that FY became current.
Expenses
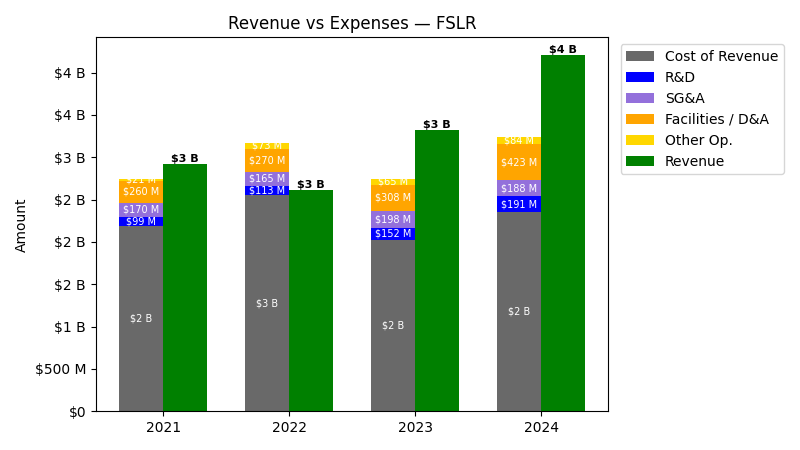
| Year | Revenue ($) | Cost of Revenue ($) | R&D ($) | SG&A ($) | Facilities / D&A ($) |
|---|---|---|---|---|---|
| 2022 | $2.6B | $2.3B | $112.8M | $164.7M | $269.7M |
| 2023 | $3.3B | $1.7B | $152.3M | $197.6M | $308.0M |
| 2024 | $4.2B | $1.9B | $191.4M | $188.3M | $423.5M |
| 2025 | $5.2B | $2.6B | $233.4M | $203.8M | $529.2M |
| TTM | $5.4B | $2.6B | $248.0M | $215.9M | $551.8M |
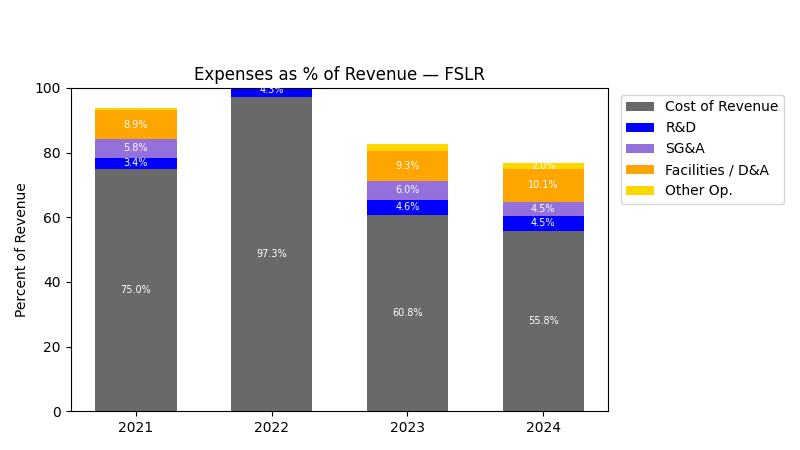
| Year | Revenue Change (%) | Cost of Revenue Change (%) | R&D Change (%) | SG&A Change (%) | Facilities / D&A Change (%) |
|---|---|---|---|---|---|
| 2023 | 26.70 | -24.99 | 35.02 | 19.97 | 14.19 |
| 2024 | 26.75 | 12.57 | 25.65 | -4.74 | 37.50 |
| 2025 | 24.09 | 33.50 | 21.97 | 8.23 | 24.96 |
| TTM | 3.83 | 1.38 | 6.24 | 5.97 | 4.26 |
No unmapped expenses.
Balance Sheet
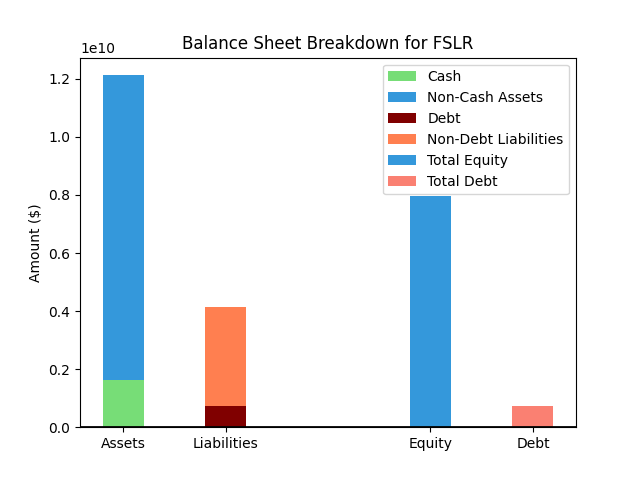
| Metric | Value | |
|---|---|---|
| 0 | Total Assets | $13,351M |
| 1 | Cash | $2,363M |
| 2 | Total Liabilities | $3,473M |
| 3 | Total Debt | $587M |
| 4 | Total Equity | $9,879M |
| 5 | Debt to Equity Ratio | 0.06 |
EPS & Dividend

Valuation
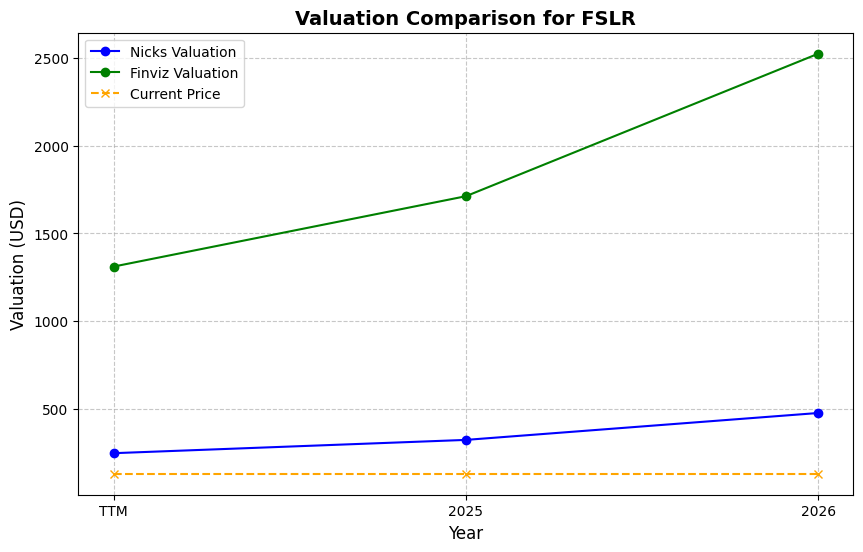
| Share Price | Treasury Yield | Estimates | Fair Value (P/E) | Fair Value (P/S) | Current P/S | Current P/E |
|---|---|---|---|---|---|---|
| $306.79 | 4.5% | Nicks Growth: 12% Nick's Expected Margin: 25% FINVIZ Growth: 27% |
Nicks: 21 Finviz: 75 |
Nick's: 5.175 | 6.1 | 19.8 |
| Basis | Year | Nicks Valuation | Nicks vs Share Price | Finviz Valuation | Finviz vs Share Price |
|---|---|---|---|---|---|
| $15.47 EPS | TTM | $320.24 | 4.4% | $1160.68 | 278.3% |
| $17.40 EPS | 2026 | $360.17 | 17.4% | $1305.41 | 325.5% |
| $23.16 EPS | 2027 | $479.36 | 56.2% | $1737.40 | 466.3% |
Implied Growth
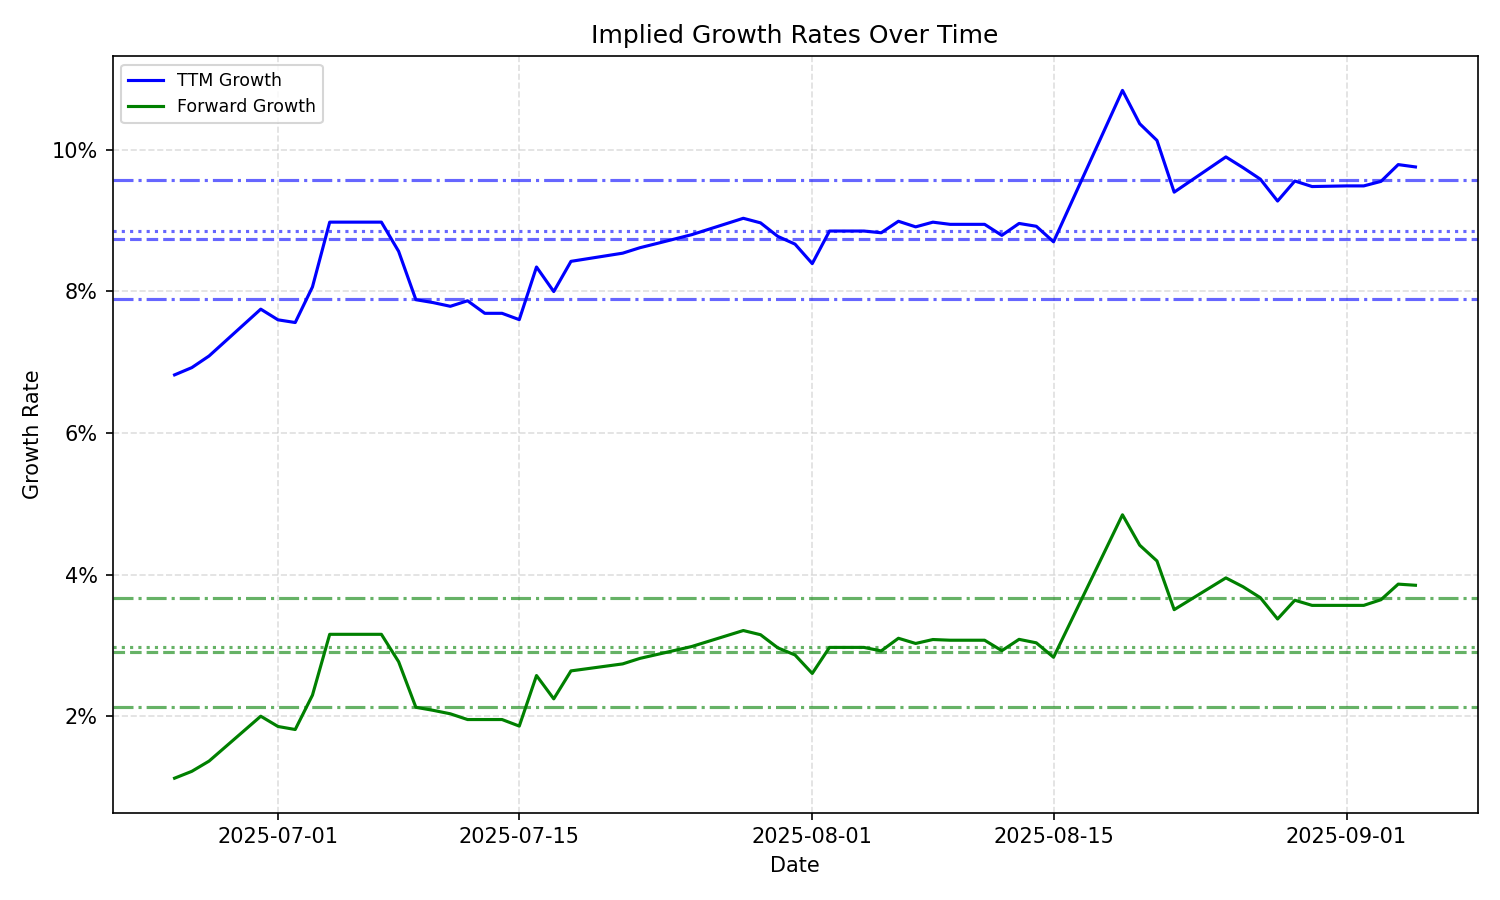
| Average | Median | Std Dev | Current | Percentile | ||||||
|---|---|---|---|---|---|---|---|---|---|---|
| TTM | Forward | TTM | Forward | TTM | Forward | TTM | Forward | TTM | Forward | |
| Timeframe | ||||||||||
| 1 Year | 9.52% | 3.87% | 9.71% | 3.87% | 1.49% | 1.55% | 11.42% | 7.07% | 90.0% | 100.0% |
| 3 Years | 9.52% | 3.87% | 9.71% | 3.87% | 1.49% | 1.55% | 11.42% | 7.07% | 90.0% | 100.0% |
| 5 Years | 9.52% | 3.87% | 9.71% | 3.87% | 1.49% | 1.55% | 11.42% | 7.07% | 90.0% | 100.0% |
| 10 Years | 9.52% | 3.87% | 9.71% | 3.87% | 1.49% | 1.55% | 11.42% | 7.07% | 90.0% | 100.0% |