EVgo Inc. — EVGO
| Close Price | Market Cap | P/E Ratio | Forward P/E Ratio | Implied Growth* | Implied Forward Growth* | Dividend | P/B Ratio |
|---|---|---|---|---|---|---|---|
| $2.22 | $696.77M | - | -6.7 | N/A | - | - | -2.6 |
Latest Headlines
- · Why EVgo (EVGO) Shares Are Getting Obliterated Today
- · EVgo Welcomes Amber Scott as Chief Accounting Officer
- · Boeing, EVgo, Standex, Donaldson, and Flowserve Shares Are Falling, What You Need To Know
- · 1 Russell 2000 Stock to Target This Week and 2 We Turn Down
- · The Top 5 Analyst Questions From EVgo’s Q1 Earnings Call
- · EVgo (EVGO): 8 Best Fast Growing Penny Stocks to Buy Right Now
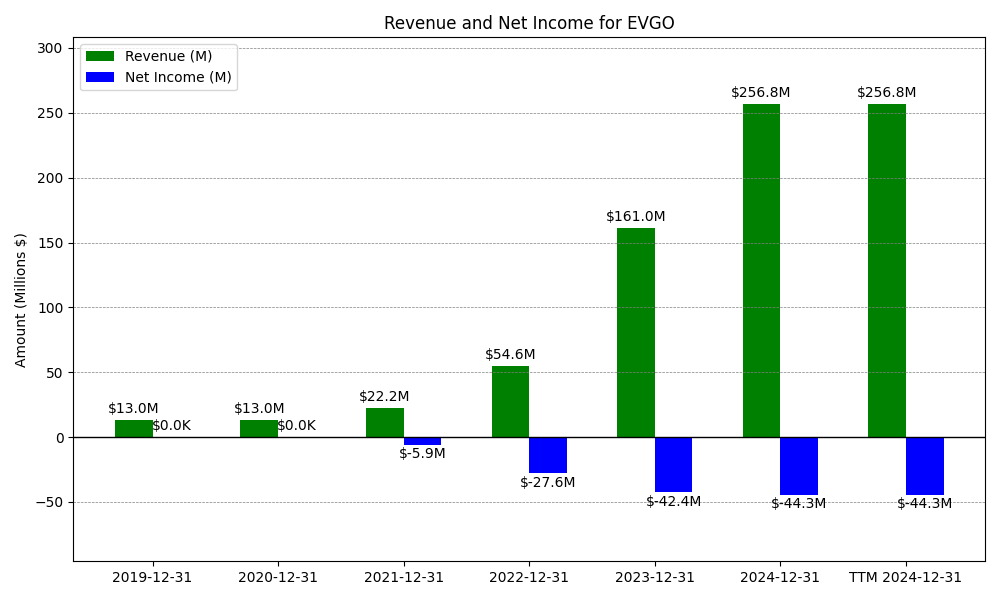
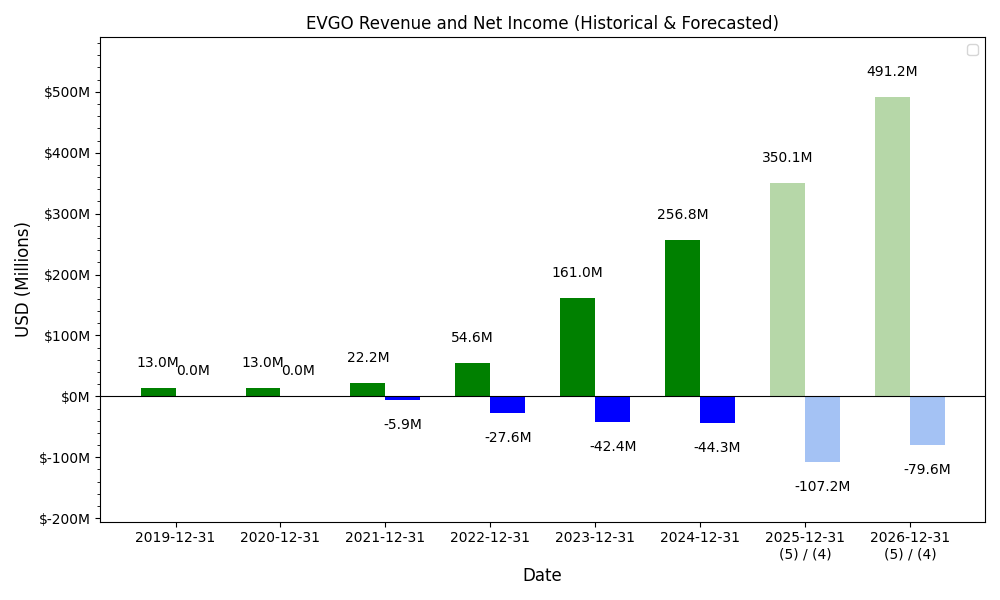
Revenue & Net Income
| Date | Revenue | Net_Income | EPS | Last_Updated | Revenue_Change | Net_Income_Change | EPS_Change | |
|---|---|---|---|---|---|---|---|---|
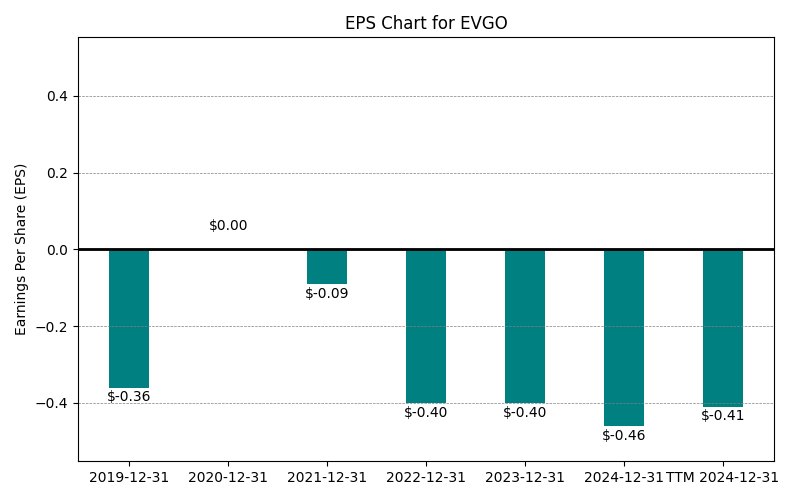
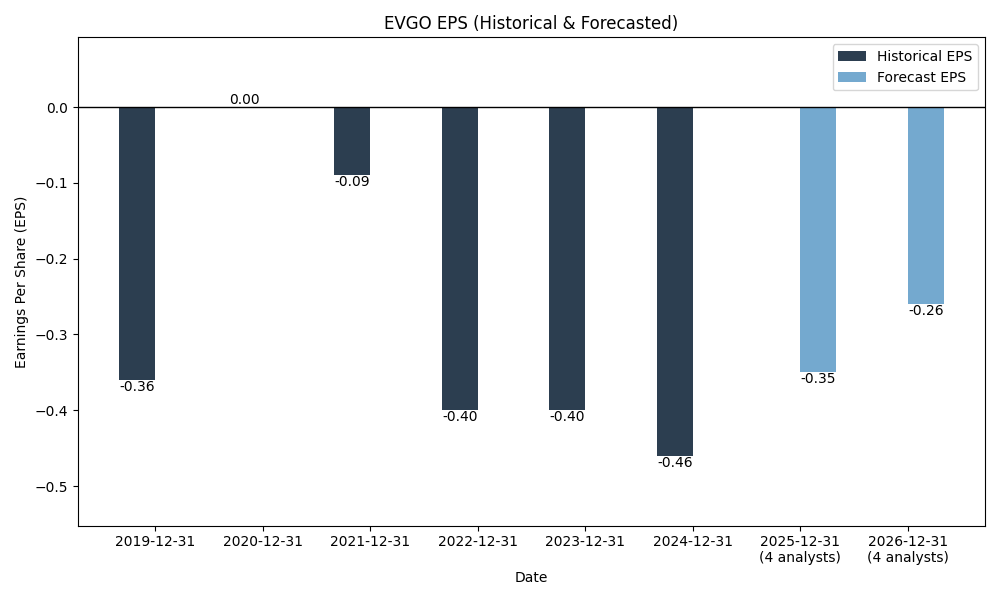
| 0 | 2019-12-31 | $13M | $0M | $-0.36 | 2024-05-25 13:10:58 | N/A | N/A | N/A |
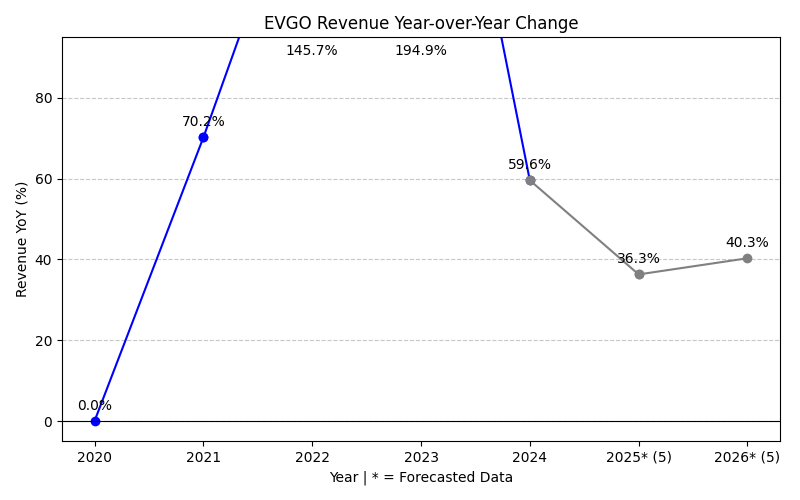
| 1 | 2020-12-31 | $13M | $0M | $0.00 | 2024-02-03 03:17:10 | 0.0% | N/A | -100.0% |
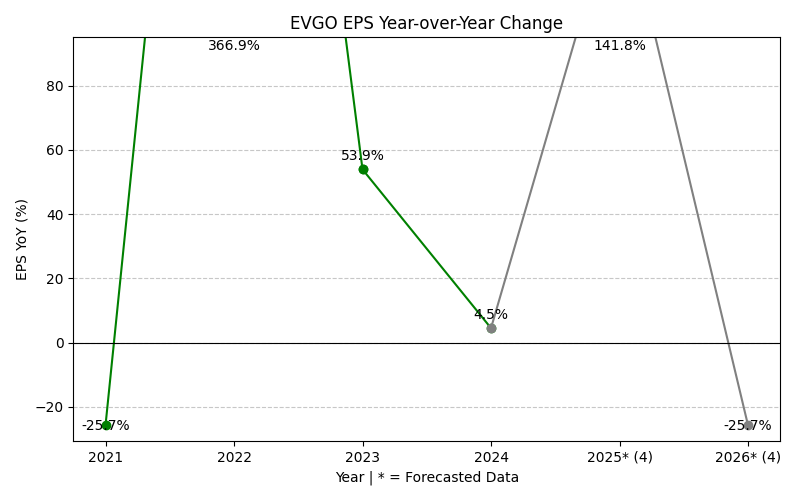
| 2 | 2021-12-31 | $55M | $-28M | $-0.09 | 2026-05-29 09:07:55 | 318.3% | -inf% | -inf% |
| 3 | 2022-12-31 | $55M | $-28M | $-0.40 | 2026-05-29 09:07:55 | 0.0% | 0.0% | 344.4% |
| 4 | 2023-12-31 | $161M | $-42M | $-0.46 | 2026-05-29 09:07:55 | 194.9% | 53.9% | 15.0% |
| 5 | 2024-12-31 | $257M | $-44M | $-0.41 | 2026-05-29 09:07:55 | 59.6% | 4.5% | -10.9% |
| 6 | 2025-12-31 | $384M | $-42M | $-0.41 | 2026-05-29 09:07:55 | 49.6% | -6.2% | 0.0% |
| 7 | TTM 2026-03-31 | $418M | $-47M | $-0.34 | 2026-05-19 09:07:10 | 8.9% | 12.2% | -17.1% |
EPS
Forecasts
Y/Y % Change
EVGO Year-over-Year Growth
| 2019 | 2020 | 2021 | 2022 | 2023 | 2024 | 2025 | 2026 | 2027 | Average | |
|---|---|---|---|---|---|---|---|---|---|---|
| Revenue Growth (%) | 0.0% | 318.3% | 0.0% | 194.9% | 59.6% | 49.6% | 12.3% | 28.9% | 83.0% | |
| Revenue Analysts (#) | 0 | 0 | 0 | 0 | 0 | 0 | 0 | 10 | 9 | |
| EPS Growth (%) | -inf% | 0.0% | 53.9% | 4.5% | -6.2% | 269.9% | -32.7% | -inf% | ||
| EPS Analysts (#) | 0 | 0 | 0 | 0 | 0 | 0 | 0 | 2 | 2 |
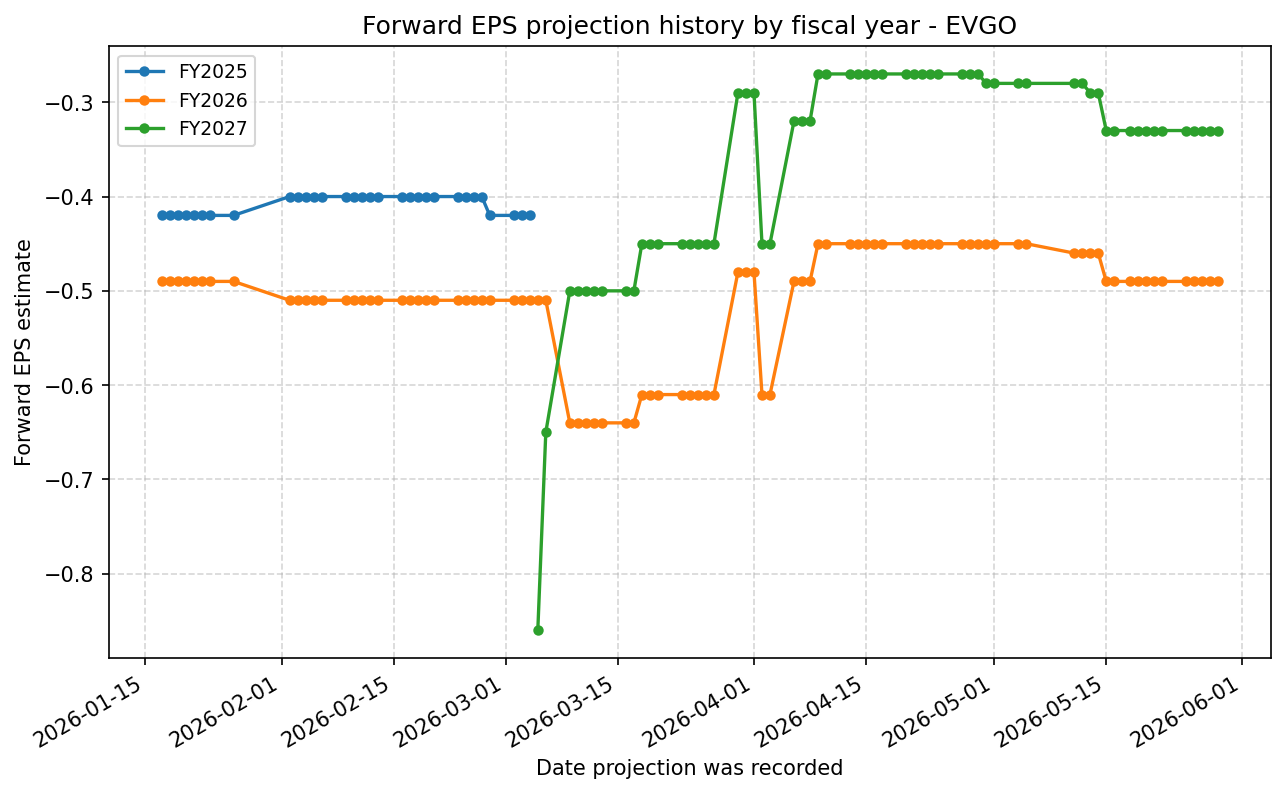
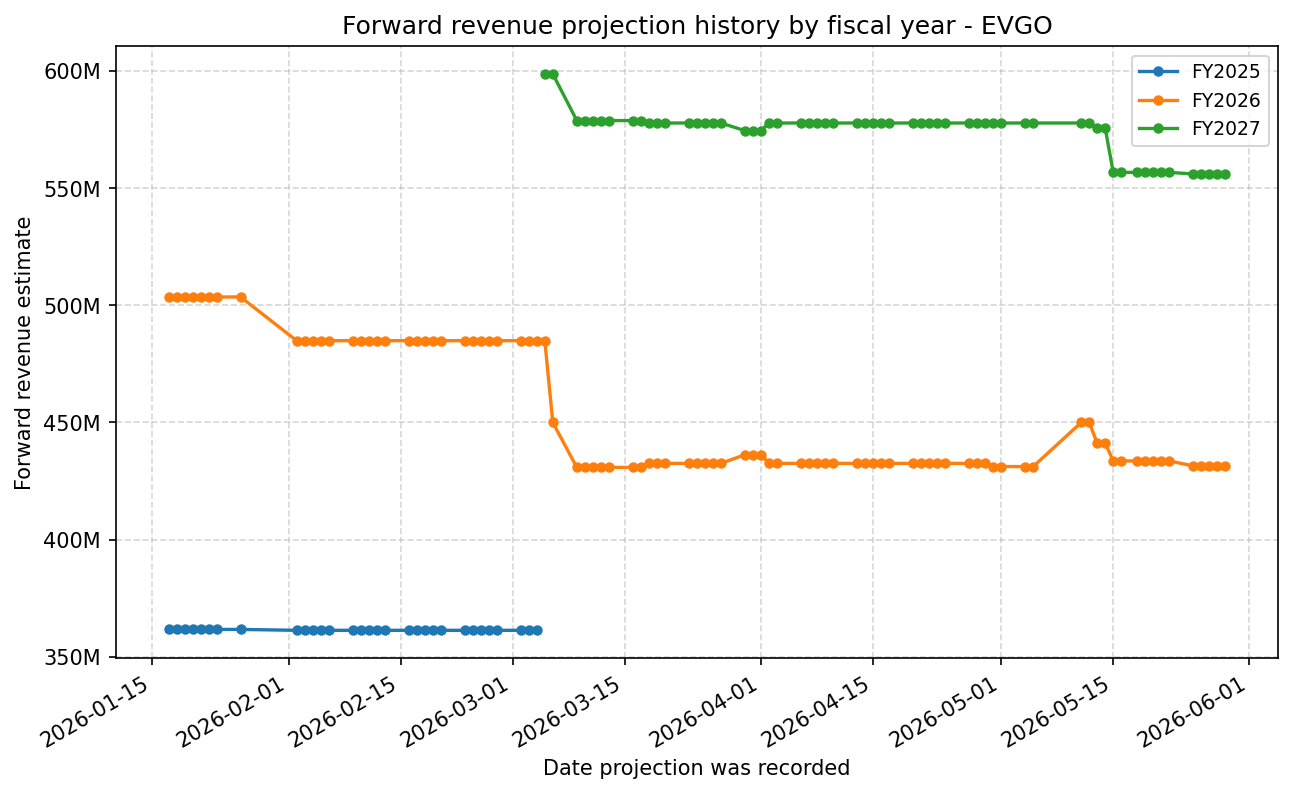
Forward Estimate History
How the next-FY EPS and revenue estimates have drifted over time. One line per fiscal year – past lines end when that FY became current.
Expenses
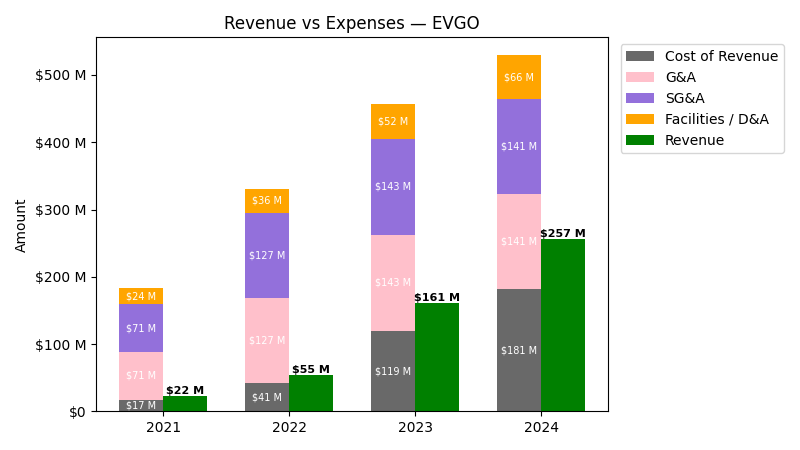
| Year | Revenue ($) | Cost of Revenue ($) | G&A ($) | SG&A ($) | Facilities / D&A ($) |
|---|---|---|---|---|---|
| 2022 | $54.6M | $5.5M | $126.7M | $126.7M | $35.9M |
| 2023 | $161.0M | $67.4M | $143.0M | $143.0M | $52.0M |
| 2024 | $256.8M | $115.7M | $141.1M | $141.1M | $65.8M |
| 2025 | $384.1M | $169.8M | $176.9M | $176.9M | $74.0M |
| TTM | $418.3M | $200.0M | $184.2M | $184.2M | $73.8M |
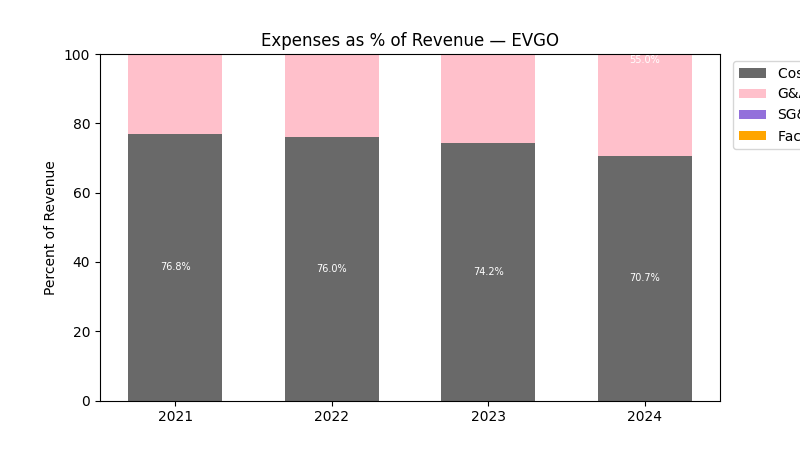
| Year | Revenue Change (%) | Cost of Revenue Change (%) | G&A Change (%) | SG&A Change (%) | Facilities / D&A Change (%) |
|---|---|---|---|---|---|
| 2023 | 194.85 | 1116.58 | 12.87 | 12.87 | 44.67 |
| 2024 | 59.57 | 71.56 | -1.32 | -1.32 | 26.62 |
| 2025 | 49.55 | 46.83 | 25.32 | 25.32 | 12.49 |
| TTM | 8.92 | 17.76 | 4.17 | 4.17 | -0.24 |
No unmapped expenses.
Segment Performance
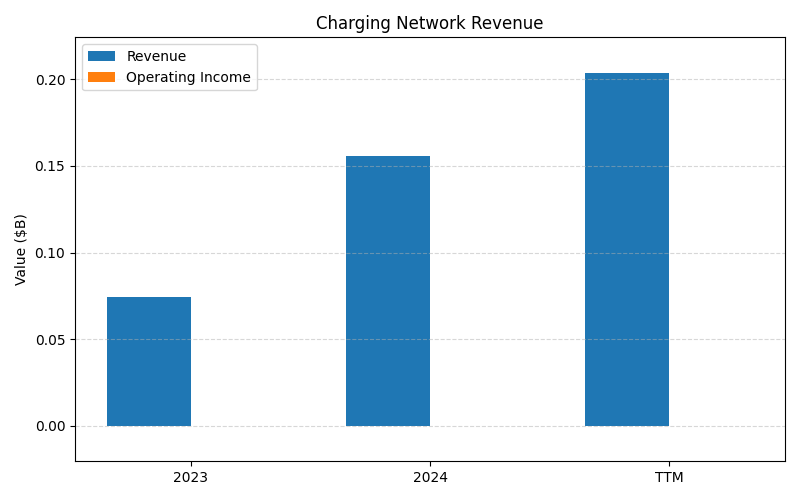
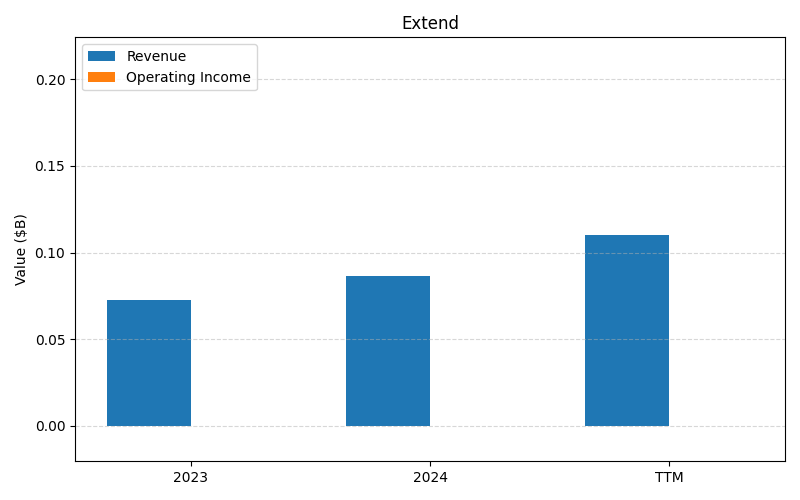

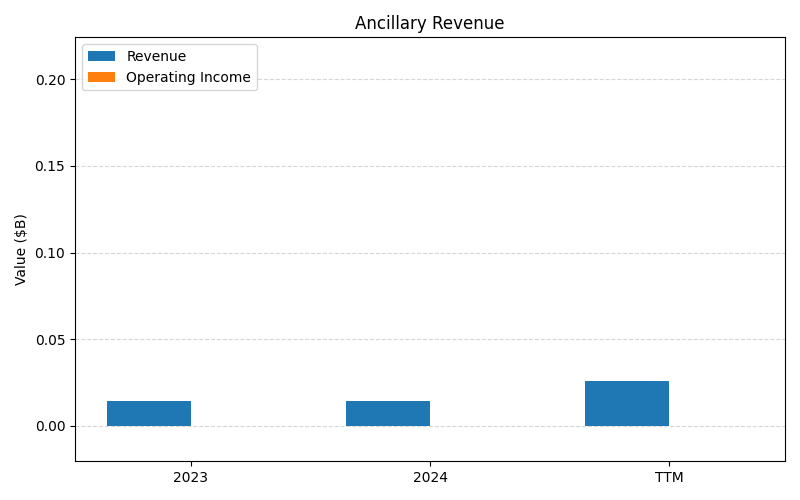
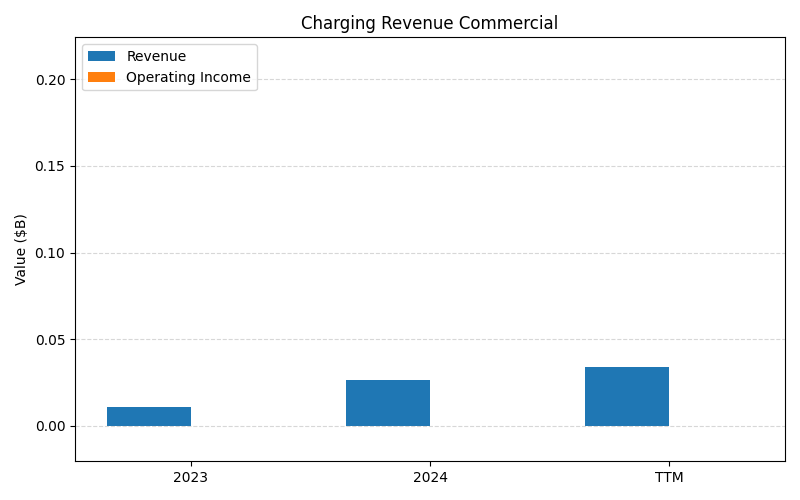
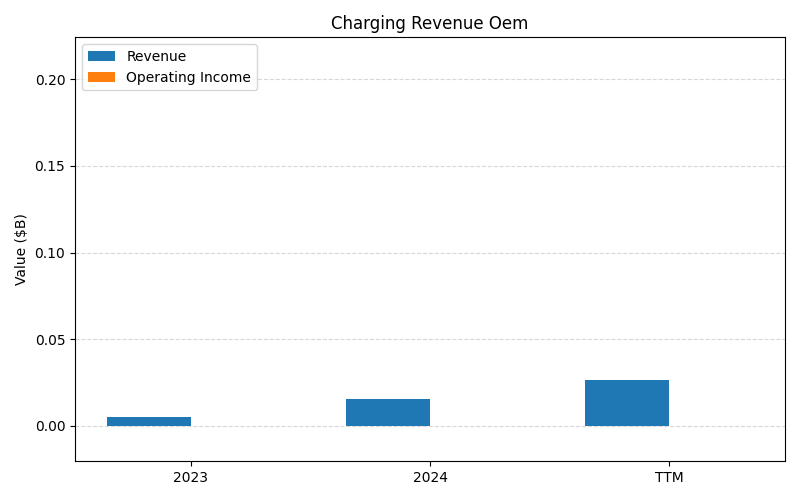
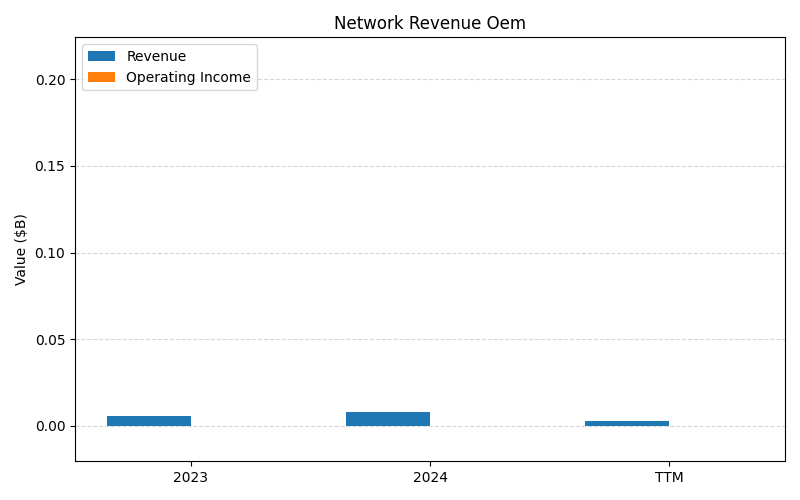
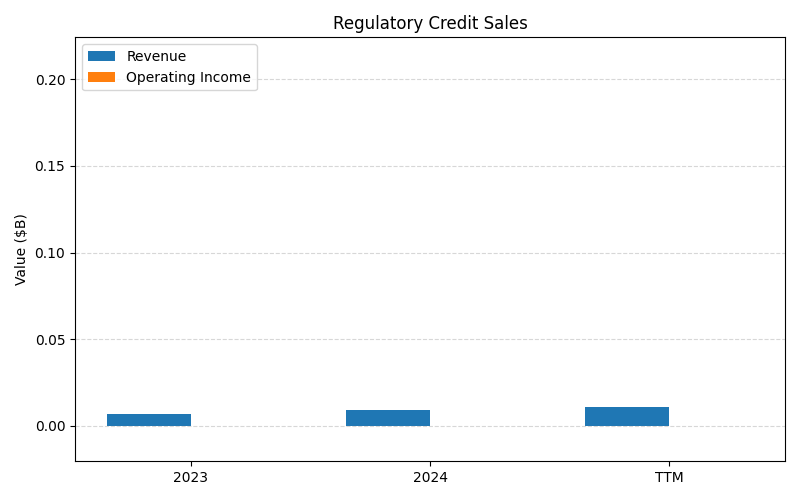
SEGMENTS v2025-09-09 · 2026-05-29 09:08 UTC — Units: $M. Rows list fiscal years (last 3 + TTM) with revenue for each segment; the final row shows the TTM revenue mix (operating income columns display “—” where mix is not applicable).
| Year | Charging Network Revenue Rev | Extend Rev | Charging Revenue Retail Rev | Ancillary Revenue Rev | Charging Revenue Commercial Rev | Charging Revenue Oem Rev | Network Revenue Oem Rev | Regulatory Credit Sales Rev | Total Rev |
|---|---|---|---|---|---|---|---|---|---|
| 2024 | 155.7M | 86.6M | 96.7M | 14.5M | 26.7M | 15.6M | 7.79M | 8.99M | 412.5M |
| 2025 | 218.3M | 116.5M | 133.9M | 49.3M | 34.8M | 26.1M | 13.4M | 10.2M | 602.4M |
| TTM | 579.6M | 316.4M | 294.3M | 89.1M | 78M | 51.7M | 27.5M | 25.2M | 1462.1M |
| % of Total (TTM) | 39.6% | 21.6% | 20.1% | 6.1% | 5.3% | 3.5% | 1.9% | 1.7% | 100% |
Balance Sheet
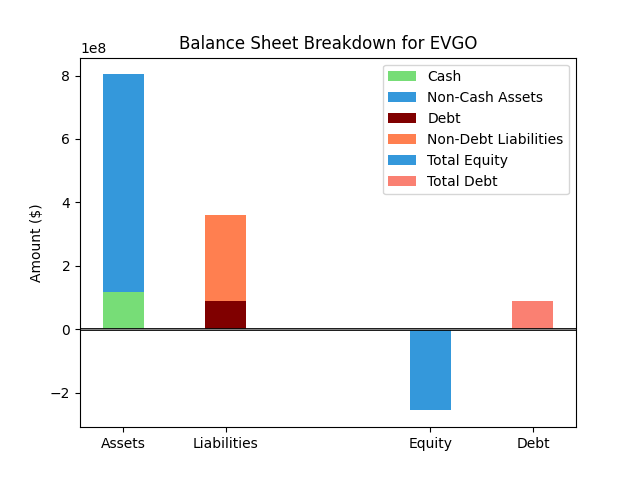
| Metric | Value | |
|---|---|---|
| 0 | Total Assets | $920M |
| 1 | Cash | $122M |
| 2 | Total Liabilities | $568M |
| 3 | Total Debt | $322M |
| 4 | Total Equity | $39M |
| 5 | Debt to Equity Ratio | 8.33 |
EPS & Dividend

Valuation
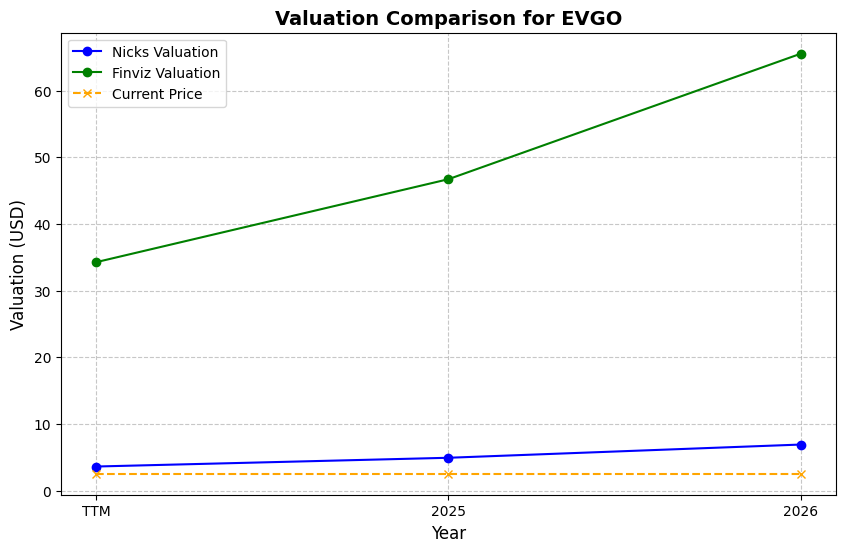
| Share Price | Treasury Yield | Estimates | Fair Value (P/E) | Fair Value (P/S) | Current P/S | Current P/E |
|---|---|---|---|---|---|---|
| $2.22 | 4.5% | Nicks Growth: 20% Nick's Expected Margin: 10% FINVIZ Growth: 0% |
Nicks: 42 Finviz: 7 |
Nick's: 4.242 | 1.7 | - |
| Basis | Year | Nicks Valuation | Nicks vs Share Price | Finviz Valuation | Finviz vs Share Price |
|---|---|---|---|---|---|
| $1.33 Revenue | TTM | $5.65 | 154.7% | $0.89 | -60.0% |
| $1.37 Revenue | 2026 | $5.83 | 162.7% | $0.92 | -58.7% |
| $1.77 Revenue | 2027 | $7.52 | 238.6% | $1.18 | -46.8% |
Implied Growth

No implied growth data available.