Domino's Pizza Inc — DPZ
| Close Price | Market Cap | P/E Ratio | Forward P/E Ratio | Implied Growth* | Implied Forward Growth* | Dividend | P/B Ratio |
|---|---|---|---|---|---|---|---|
| $310.58 | $10.33B | 17.9 | 14.8 | 10.4% | 8.5% | $7.96 2.6% | -2.7 |
Latest Headlines
- · Implied Volatility Surging for Domino's Pizza Stock Options
- · Domino's Pizza (DPZ) Down 8.8% Since Last Earnings Report: Can It Rebound?
- · Interact Enters a New Era of Growth with Brand Evolution, AI Innovation, and Industry Recognition
- · Richard Delcid Wins Domino's® 2026 World's Fastest Pizza Maker Title
- · Krispy Kreme vs. Domino's Pizza: Which Consumer Goods Stock Is a Better Buy in 2026?
- · Berkshire Sells Visa, Domino's, and Pool Corp: Should You Follow?
Revenue & Net Income
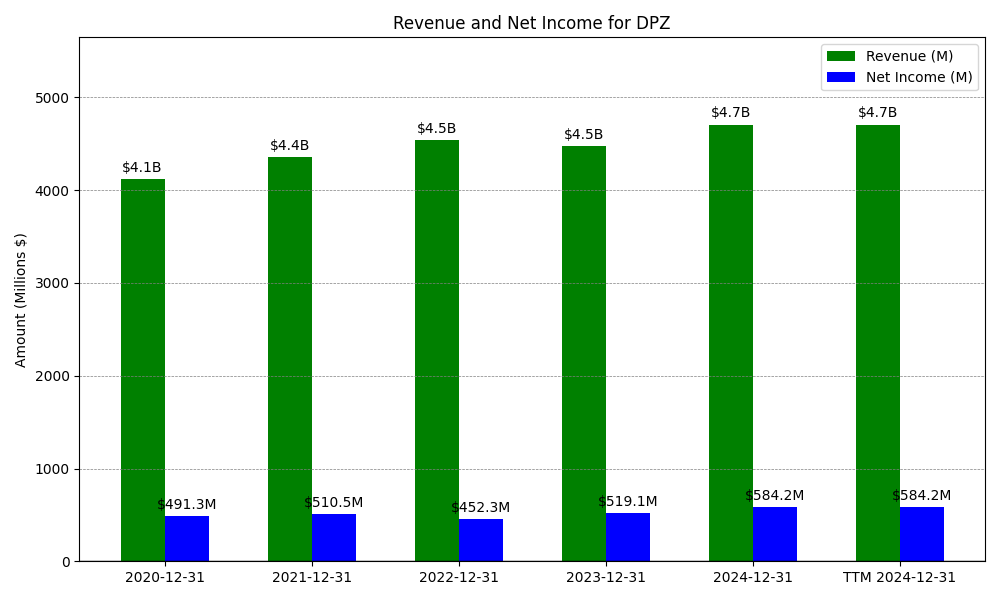
| Date | Revenue | Net_Income | EPS | Last_Updated | Revenue_Change | Net_Income_Change | EPS_Change | |
|---|---|---|---|---|---|---|---|---|
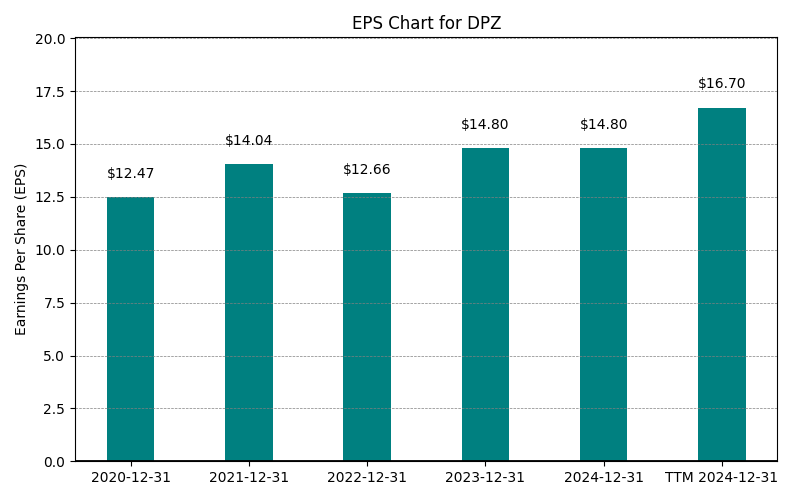
| 0 | 2020-12-31 | $4,117M | $491M | $12.47 | 2024-02-03 03:17:10 | N/A | N/A | N/A |
| 1 | 2021-12-31 | $4,537M | $452M | $14.04 | 2026-03-11 08:33:34 | 10.2% | -7.9% | 12.6% |
| 2 | 2022-12-31 | $4,537M | $452M | $12.78 | 2026-05-29 09:07:47 | 0.0% | 0.0% | -9.0% |
| 3 | 2023-12-31 | $4,479M | $519M | $14.80 | 2026-05-29 09:07:47 | -1.3% | 14.8% | 15.8% |
| 4 | 2024-12-31 | $4,706M | $584M | $17.04 | 2026-05-29 09:07:47 | 5.1% | 12.5% | 15.1% |
| 5 | 2025-12-31 | $4,940M | $602M | $17.89 | 2026-05-29 09:07:47 | 5.0% | 3.0% | 5.0% |
| 6 | TTM 2026-03-31 | $4,979M | $592M | $17.38 | 2026-04-28 08:50:29 | 0.8% | -1.6% | -2.9% |
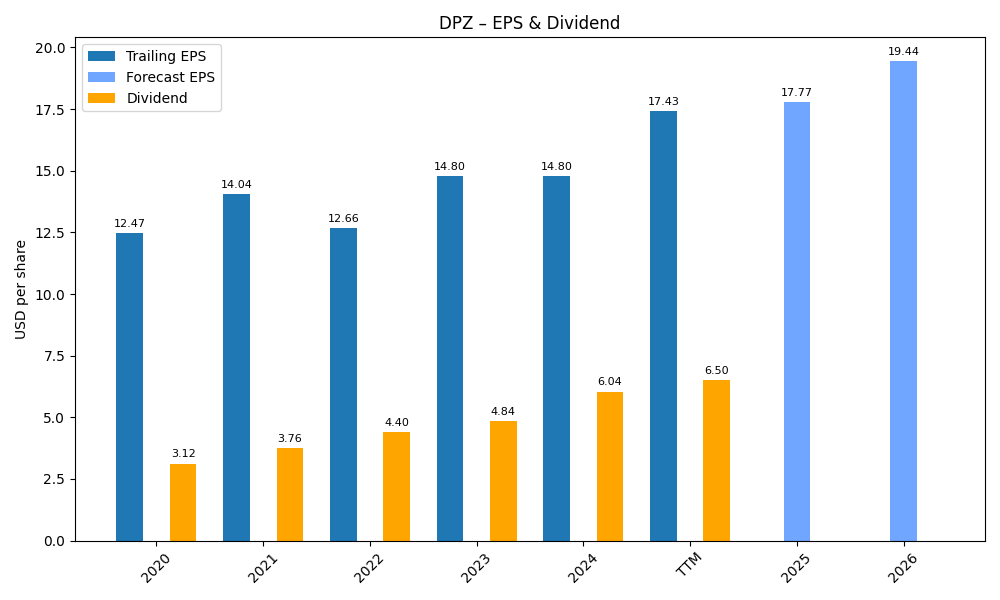
EPS
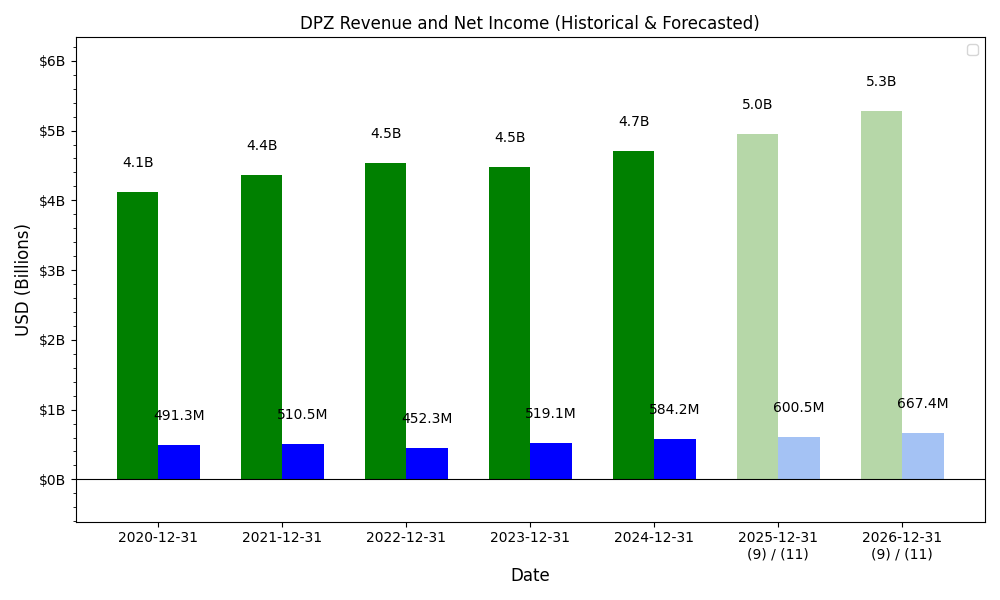
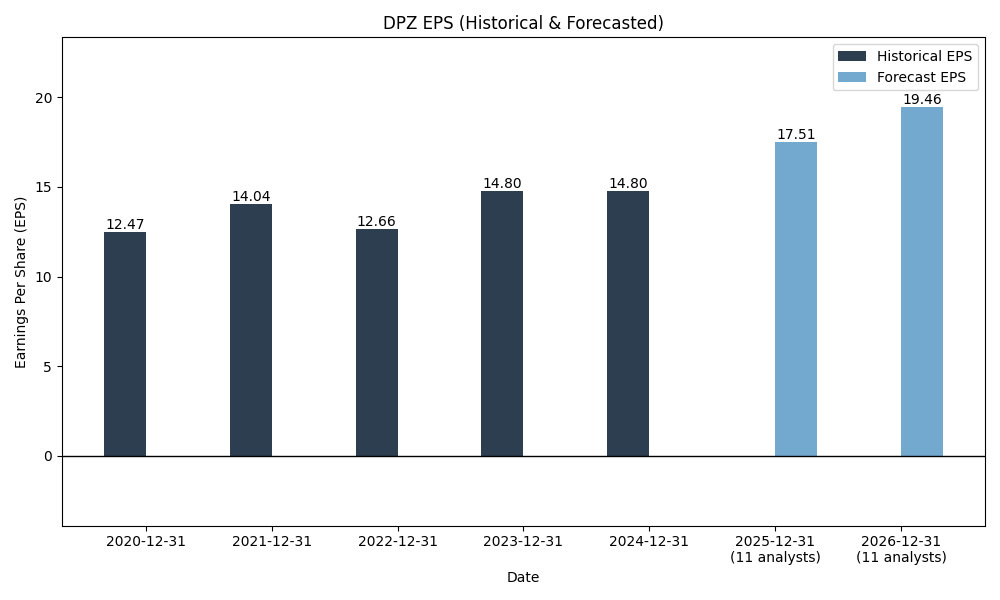
Forecasts
Y/Y % Change
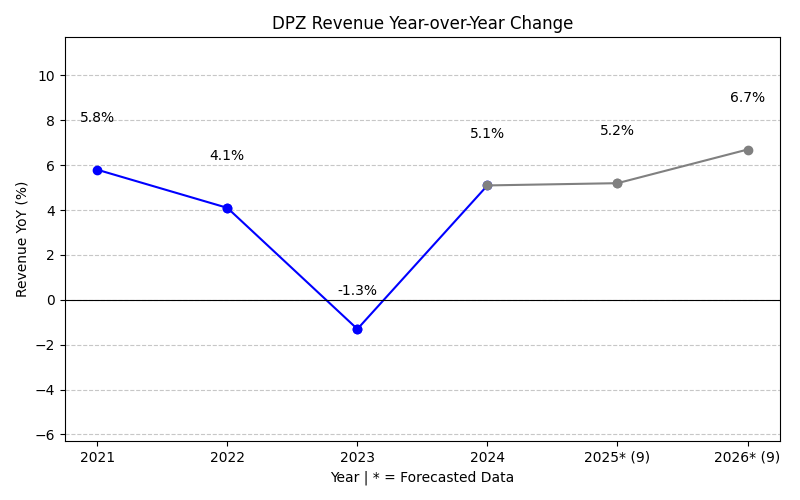
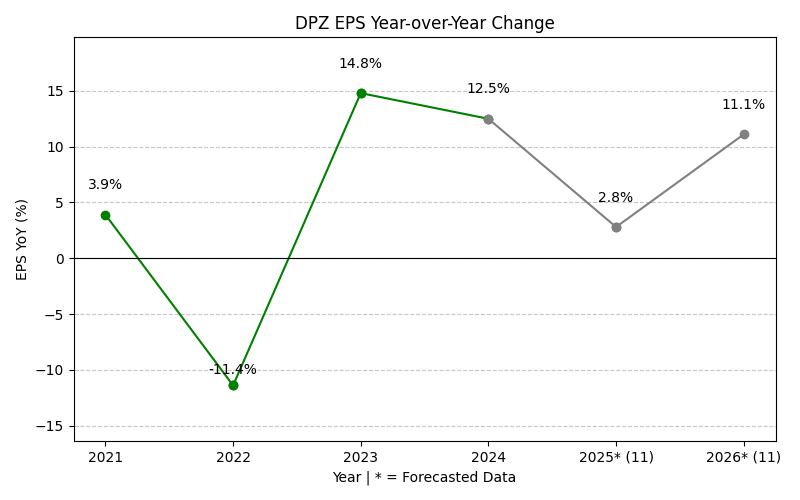
DPZ Year-over-Year Growth
| 2020 | 2021 | 2022 | 2023 | 2024 | 2025 | 2026 | 2027 | Average | |
|---|---|---|---|---|---|---|---|---|---|
| Revenue Growth (%) | 10.2% | 0.0% | -1.3% | 5.1% | 5.0% | 5.5% | 3.5% | 4.0% | |
| Revenue Analysts (#) | 0 | 0 | 0 | 0 | 0 | 0 | 28 | 29 | |
| EPS Growth (%) | -7.9% | 0.0% | 14.8% | 12.5% | 3.0% | 6.1% | 9.3% | 5.4% | |
| EPS Analysts (#) | 0 | 0 | 0 | 0 | 0 | 0 | 24 | 24 |
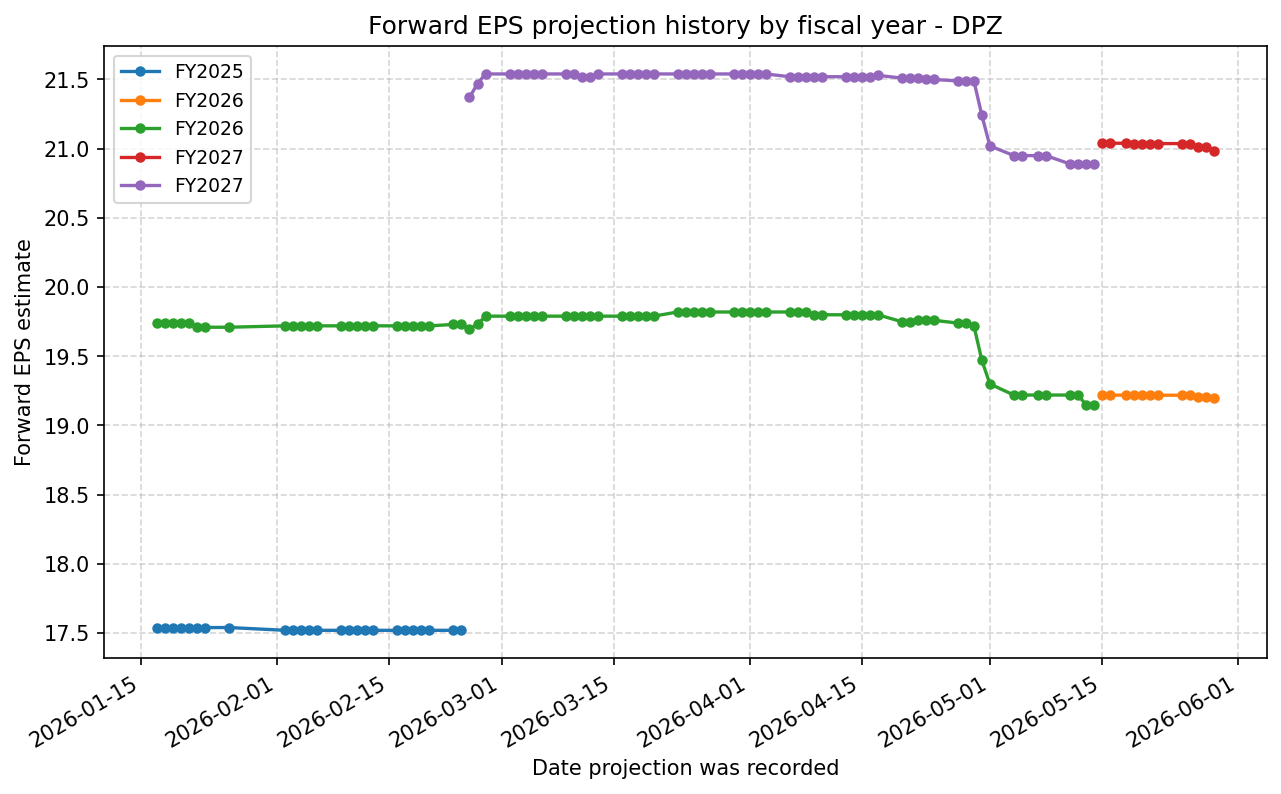
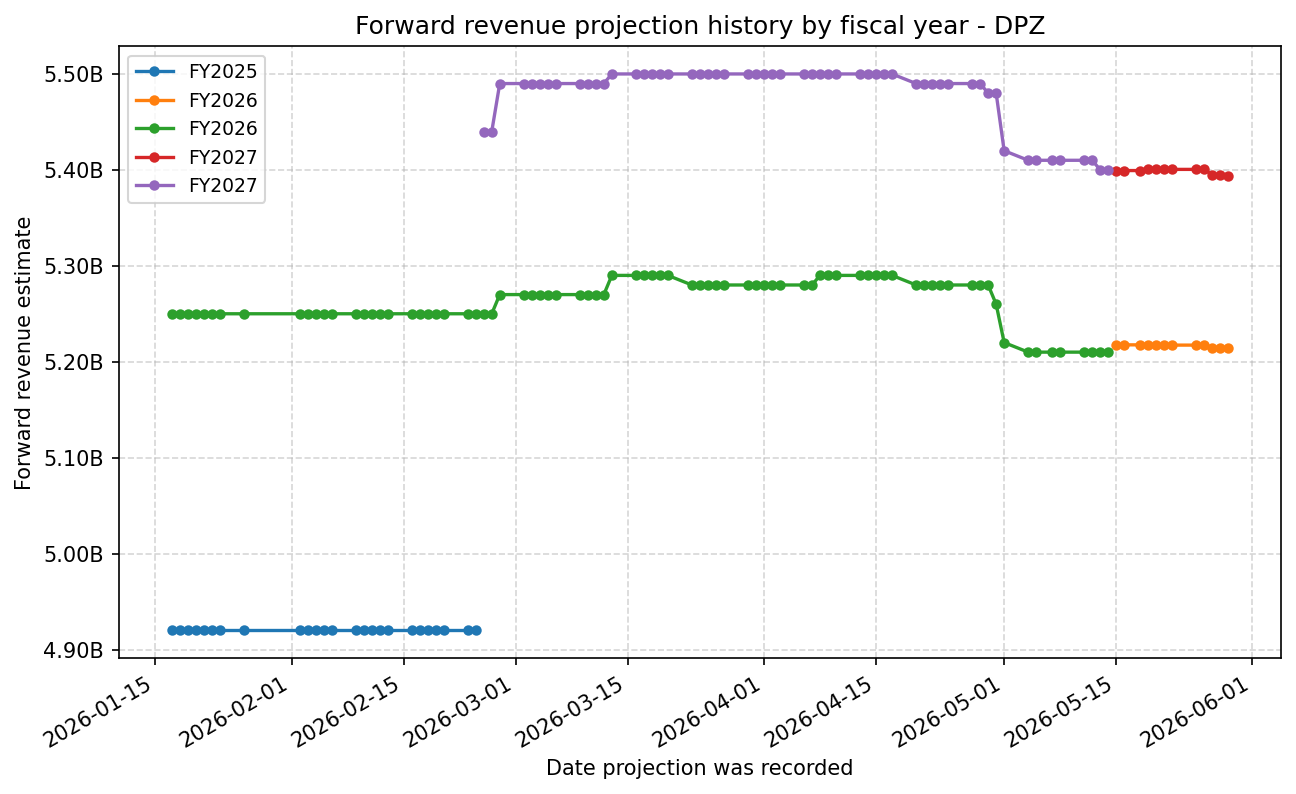
Forward Estimate History
How the next-FY EPS and revenue estimates have drifted over time. One line per fiscal year – past lines end when that FY became current.
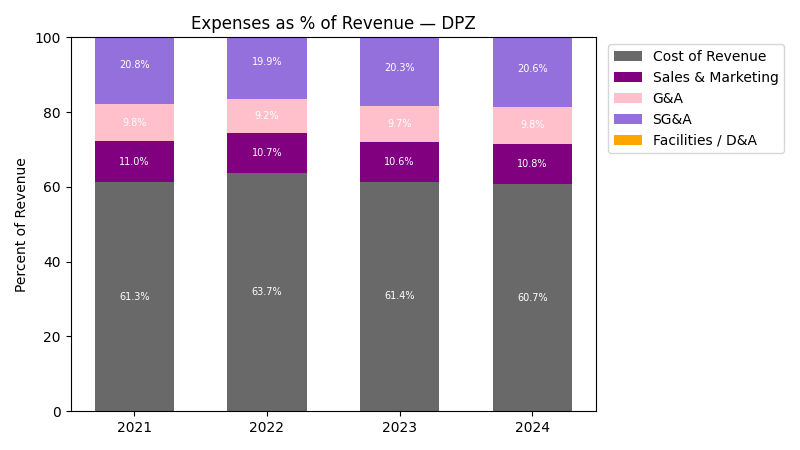
Expenses
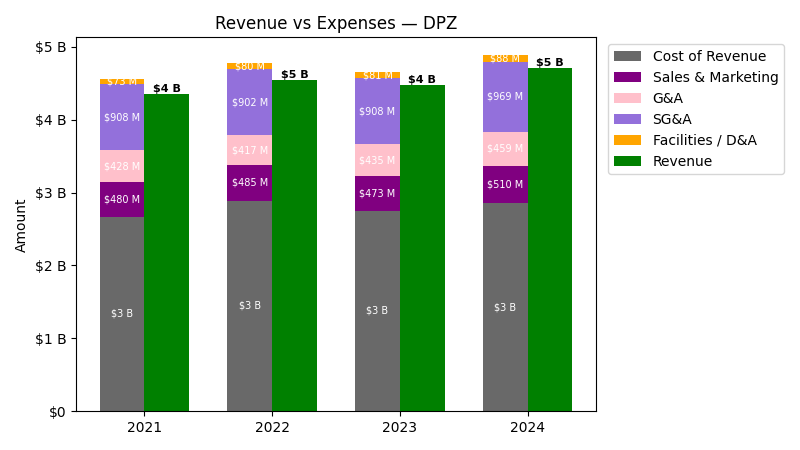
| Year | Revenue ($) | Cost of Revenue ($) | Sales & Marketing ($) | G&A ($) | SG&A ($) | Facilities / D&A ($) |
|---|---|---|---|---|---|---|
| 2022 | $4.5B | $2.8B | $485.3M | $416.5M | $901.9M | $80.3M |
| 2023 | $4.5B | $2.7B | $473.2M | $434.6M | $907.7M | $80.6M |
| 2024 | $4.7B | $2.8B | $509.9M | $459.5M | $969.3M | $87.7M |
| 2025 | $4.9B | $2.9B | $559.5M | $464.1M | $1.0B | $88.8M |
| TTM | $5.0B | $2.9B | $566.0M | $466.4M | $1.0B | $88.9M |
| Year | Revenue Change (%) | Cost of Revenue Change (%) | Sales & Marketing Change (%) | G&A Change (%) | SG&A Change (%) | Facilities / D&A Change (%) |
|---|---|---|---|---|---|---|
| 2023 | -1.27 | -4.88 | -2.50 | 4.33 | 0.65 | 0.48 |
| 2024 | 5.07 | 3.70 | 7.75 | 5.74 | 6.79 | 8.79 |
| 2025 | 4.96 | 3.88 | 9.74 | 1.01 | 5.60 | 1.25 |
| TTM | 0.78 | 0.59 | 1.17 | 0.50 | 0.87 | 0.08 |
No unmapped expenses.
Segment Performance
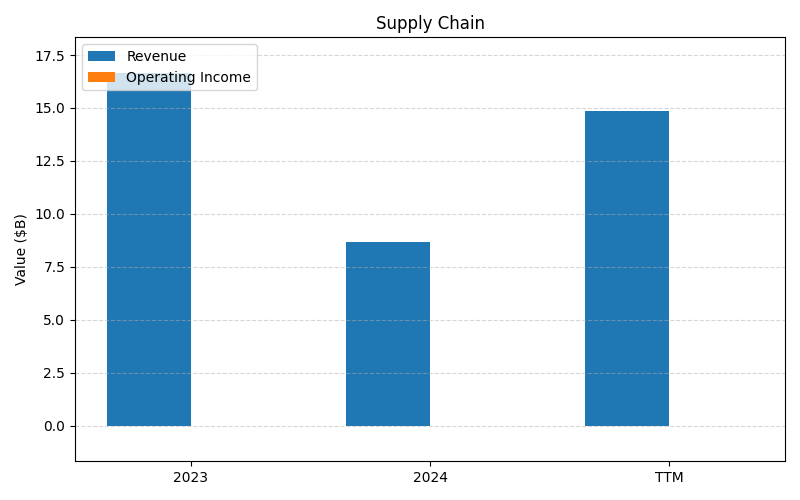
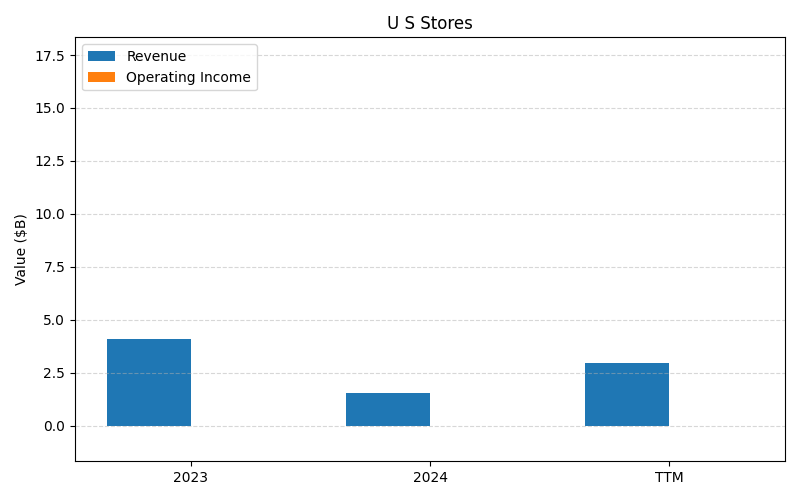
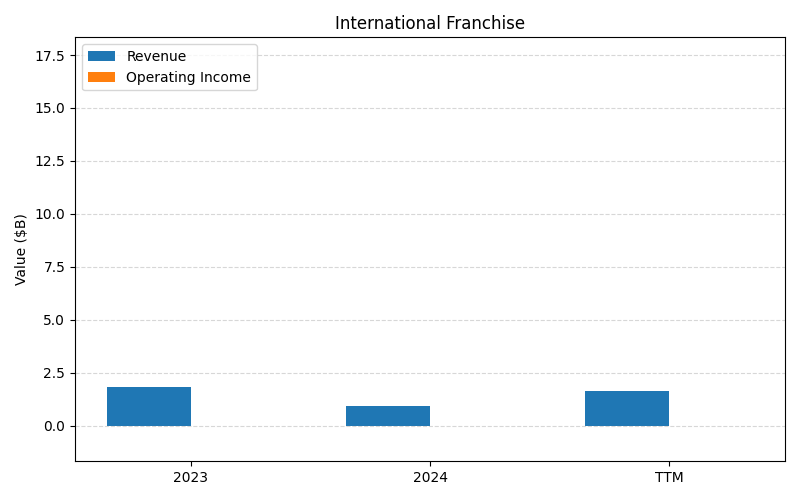
SEGMENTS v2025-09-09 · 2026-05-29 09:07 UTC — Units: $B. Rows list fiscal years (last 3 + TTM) with revenue for each segment; the final row shows the TTM revenue mix (operating income columns display “—” where mix is not applicable).
| Year | Supply Chain Rev | U S Stores Rev | International Franchise Rev | Total Rev |
|---|---|---|---|---|
| 2023 | 8.26B | 2.66B | 0.93B | 11.9B |
| 2024 | 8.66B | 1.54B | 0.96B | 11.2B |
| 2025 | 9.09B | 2.29B | 1.02B | 12.4B |
| TTM | 21.9B | 4.87B | 2.44B | 29.2B |
| % of Total (TTM) | 75.0% | 16.7% | 8.4% | 100% |
Segment Performance (Axis 2)
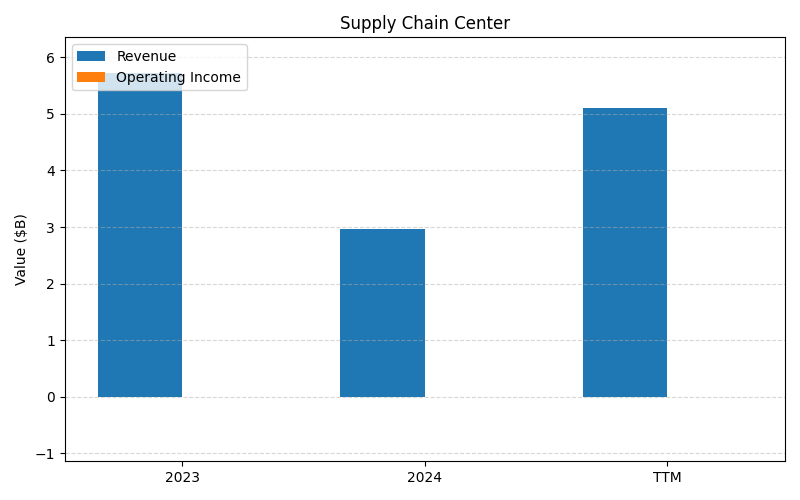
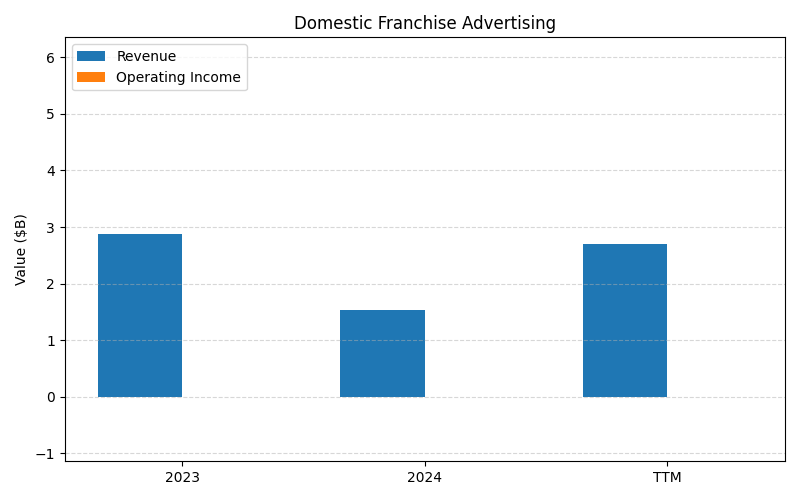
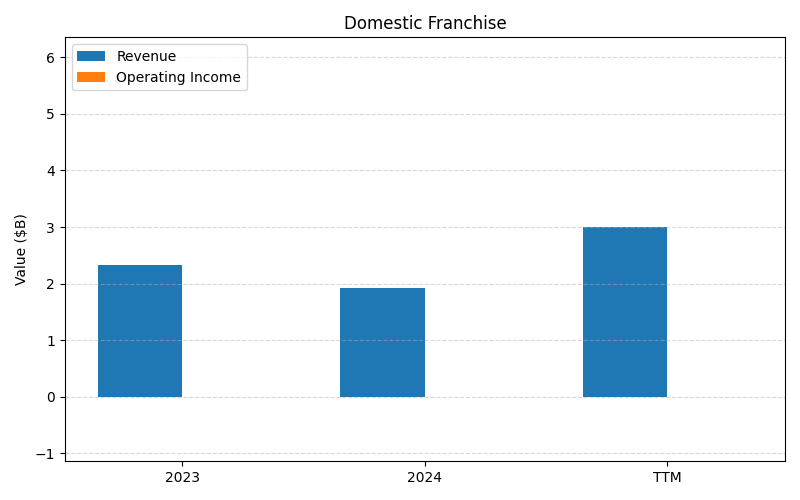
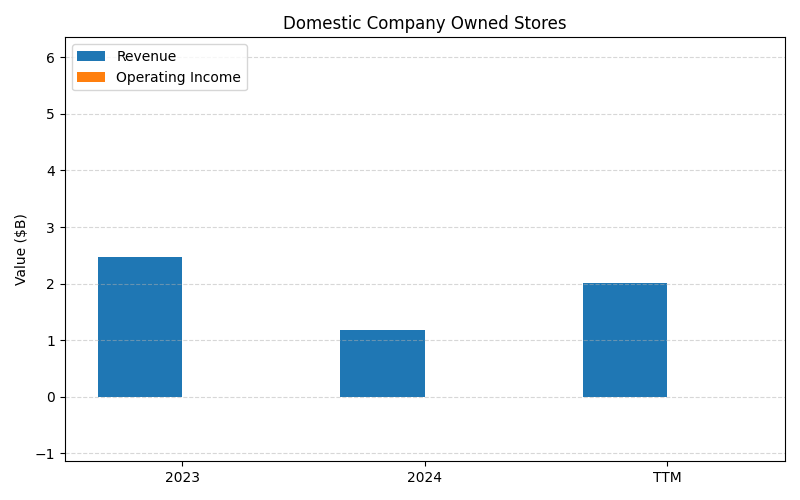
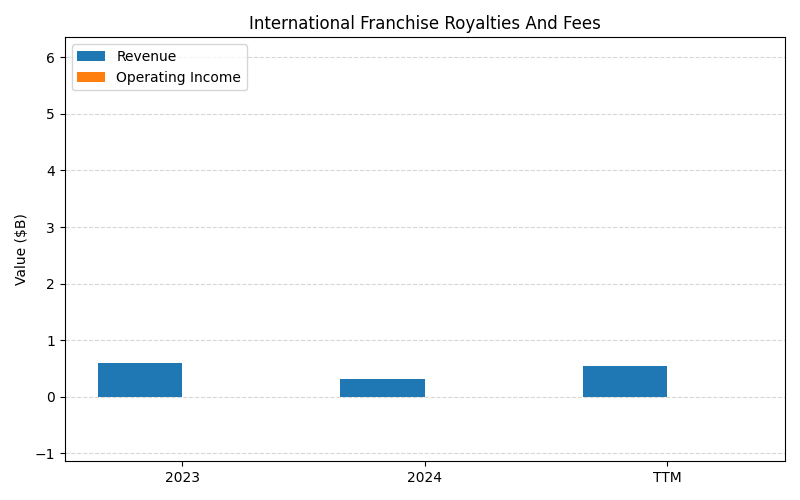
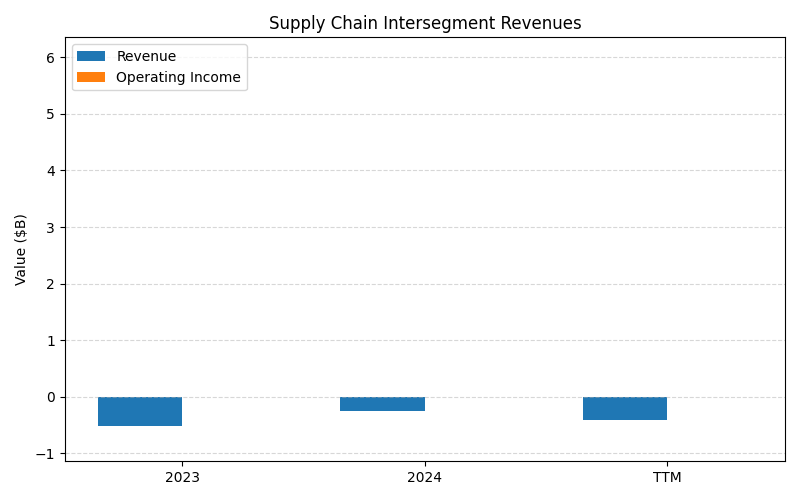
SEGMENTS v2025-09-09 · 2026-05-29 09:07 UTC — Units: $B. Rows list fiscal years (last 3 + TTM) with revenue for each segment; the final row shows the TTM revenue mix (operating income columns display “—” where mix is not applicable).
| Year | Supply Chain Center Rev | Domestic Franchise Advertising Rev | Domestic Franchise Rev | Domestic Company Owned Stores Rev | International Franchise Royalties And Fees Rev | Supply Chain Intersegment Revenues Rev | Total Rev |
|---|---|---|---|---|---|---|---|
| 2023 | 2.83B | 1.42B | 0.60B | 1.13B | 0.31B | -0.23B | 6.06B |
| 2024 | 2.97B | 1.53B | 1.91B | 1.18B | 0.32B | -0.24B | 7.67B |
| 2025 | 3.11B | 1.68B | 1.35B | 1.13B | 0.34B | 0.23B | 7.84B |
| TTM | 7.50B | 3.97B | 3.89B | 2.83B | 0.81B | -0.12B | 18.9B |
| % of Total (TTM) | 39.7% | 21.0% | 20.6% | 15.0% | 4.3% | -0.6% | 100% |
Balance Sheet
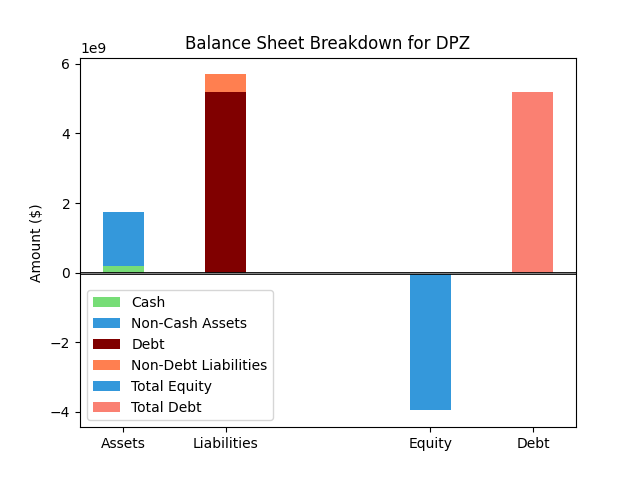
| Metric | Value | |
|---|---|---|
| 0 | Total Assets | $1,844M |
| 1 | Cash | $233M |
| 2 | Total Liabilities | $5,751M |
| 3 | Total Debt | $5,136M |
| 4 | Total Equity | $-3,907M |
| 5 | Debt to Equity Ratio | -1.31 |
EPS & Dividend
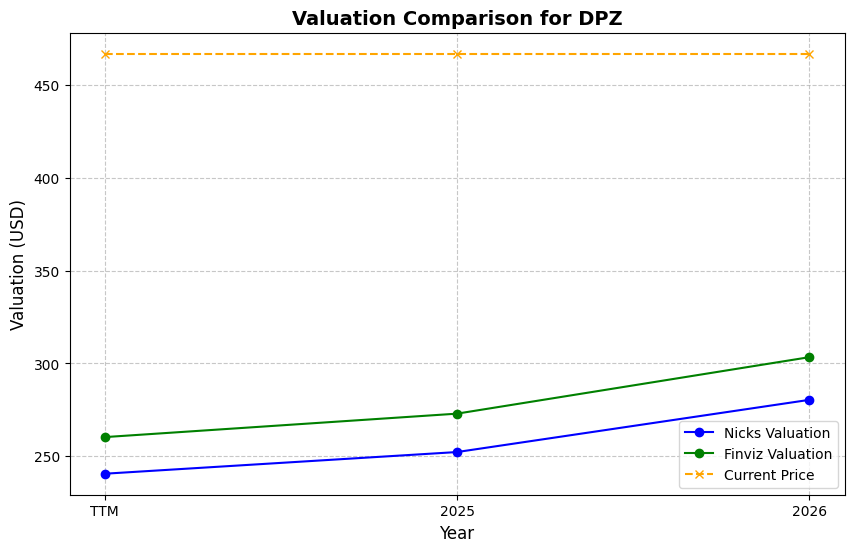
Valuation
| Share Price | Treasury Yield | Estimates | Fair Value (P/E) | Fair Value (P/S) | Current P/S | Current P/E |
|---|---|---|---|---|---|---|
| $310.58 | 4.5% | Nicks Growth: 8% Nick's Expected Margin: 12% FINVIZ Growth: 9% |
Nicks: 14 Finviz: 16 |
Nick's: 1.700 | 2.1 | 17.9 |
| Basis | Year | Nicks Valuation | Nicks vs Share Price | Finviz Valuation | Finviz vs Share Price |
|---|---|---|---|---|---|
| $17.38 EPS | TTM | $246.28 | -20.7% | $271.90 | -12.5% |
| $19.20 EPS | 2026 | $272.03 | -12.4% | $300.33 | -3.3% |
| $20.98 EPS | 2027 | $297.32 | -4.3% | $328.25 | 5.7% |
Implied Growth
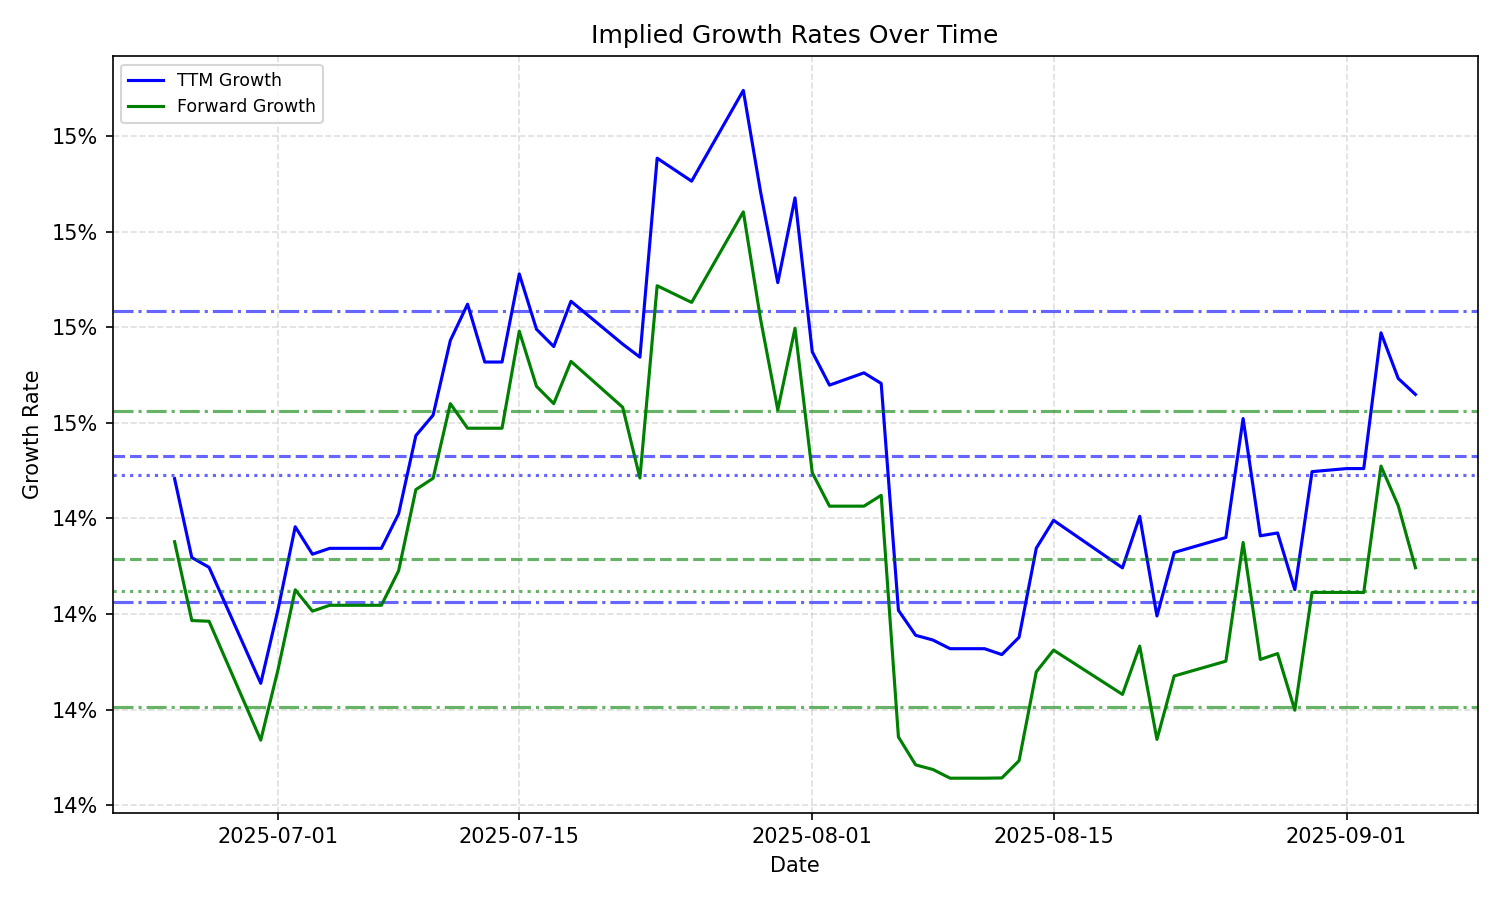
| Average | Median | Std Dev | Current | Percentile | ||||||
|---|---|---|---|---|---|---|---|---|---|---|
| TTM | Forward | TTM | Forward | TTM | Forward | TTM | Forward | TTM | Forward | |
| Timeframe | ||||||||||
| 1 Year | 13.18% | 12.19% | 13.27% | 12.75% | 1.17% | 1.90% | 10.42% | 8.47% | 2.1% | 2.5% |
| 3 Years | 13.18% | 12.19% | 13.27% | 12.75% | 1.17% | 1.90% | 10.42% | 8.47% | 2.1% | 2.5% |
| 5 Years | 13.18% | 12.19% | 13.27% | 12.75% | 1.17% | 1.90% | 10.42% | 8.47% | 2.1% | 2.5% |
| 10 Years | 13.18% | 12.19% | 13.27% | 12.75% | 1.17% | 1.90% | 10.42% | 8.47% | 2.1% | 2.5% |