DraftKings Inc. — DKNG
| Close Price | Market Cap | P/E Ratio | Forward P/E Ratio | Implied Growth* | Implied Forward Growth* | Dividend | P/B Ratio |
|---|---|---|---|---|---|---|---|
| $24.49 | $12.15B | 272.1 | 14.3 | 43.6% | 8.1% | - | 20.1 |
Latest Headlines
- · Top Funds Forgo FanDuel And DraftKings To Place Their Bets Here
- · Massachusetts Sees Opening As California Proposes 5% Billionaire Tax
- · Boston Seizes on California Billionaire Tax to Lure AI Jobs
- · Caesars Entertainment, a Las Vegas Strip icon, is sold for nearly $6 billion
- · Why Trump is endorsing prediction markets
- · $1.29B bitcoin dark pool trade: What to know
Revenue & Net Income
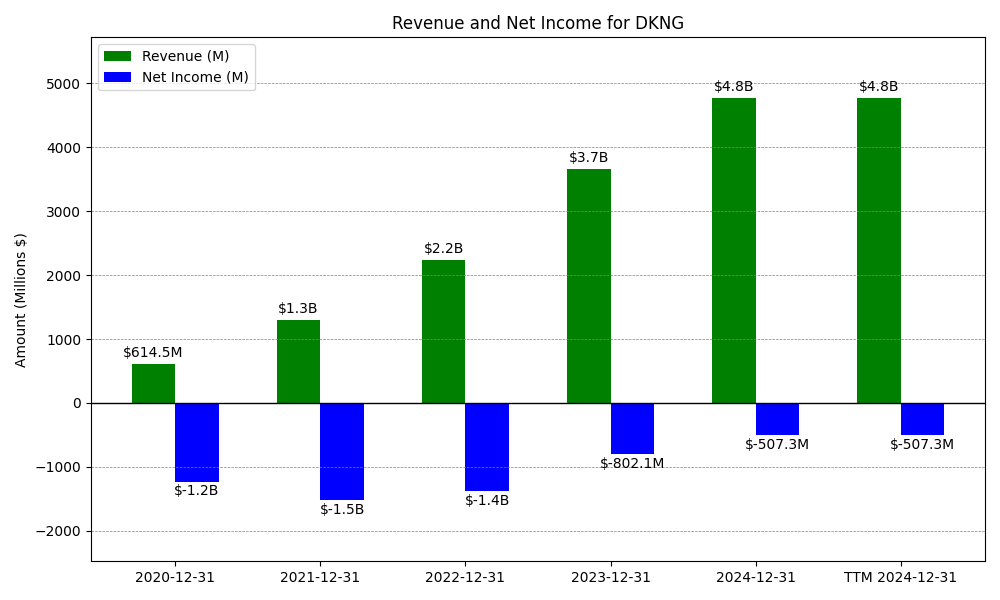
| Date | Revenue | Net_Income | EPS | Last_Updated | Revenue_Change | Net_Income_Change | EPS_Change | |
|---|---|---|---|---|---|---|---|---|
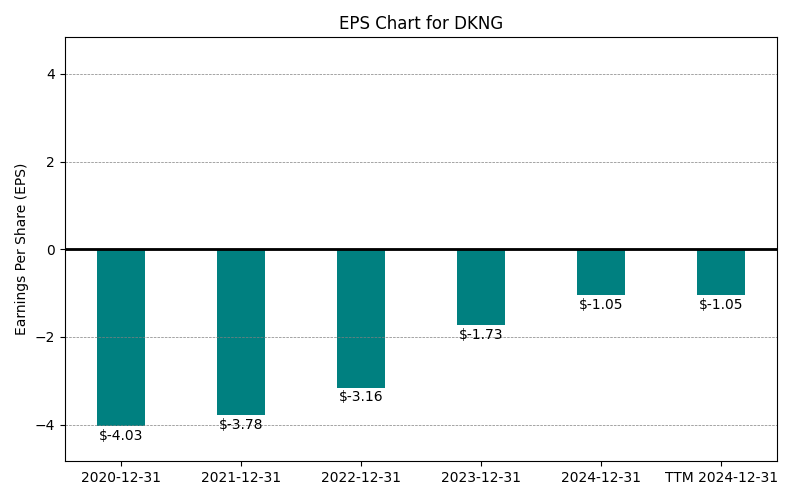
| 0 | 2020-12-31 | $615M | $-1,232M | $-4.03 | 2024-02-03 03:17:10 | N/A | N/A | N/A |
| 1 | 2021-12-31 | $1,296M | $-1,523M | $-3.78 | 2026-02-16 08:40:04 | 110.9% | 23.7% | -6.2% |
| 2 | 2022-12-31 | $2,240M | $-1,378M | $-3.16 | 2026-05-29 09:07:42 | 72.9% | -9.5% | -16.4% |
| 3 | 2023-12-31 | $3,665M | $-802M | $-1.73 | 2026-05-29 09:07:42 | 63.6% | -41.8% | -45.3% |
| 4 | 2024-12-31 | $4,768M | $-507M | $-1.05 | 2026-05-29 09:07:42 | 30.1% | -36.8% | -39.3% |
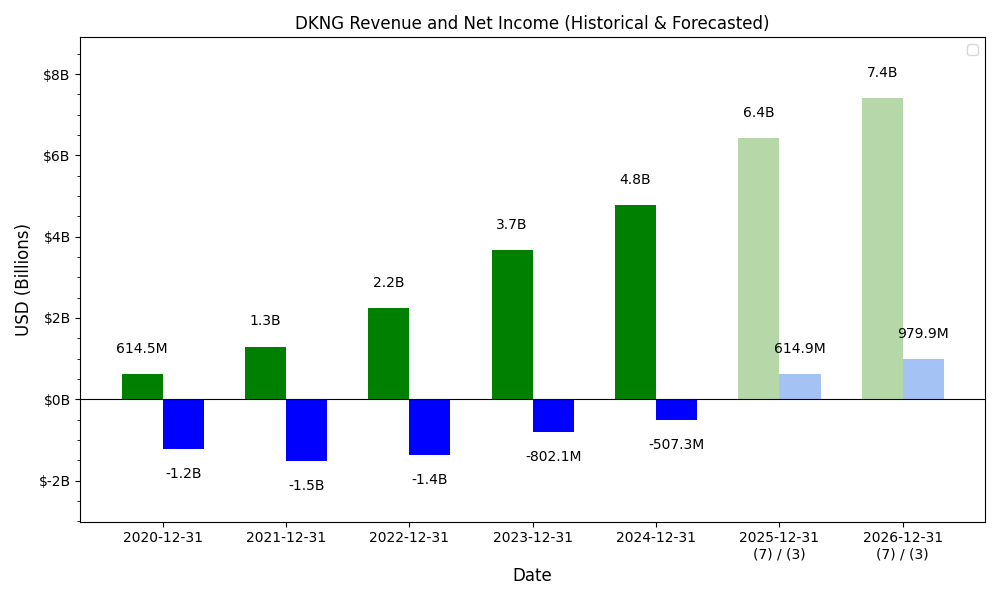
| 5 | 2025-12-31 | $6,055M | $4M | $-0.01 | 2026-05-29 09:07:42 | 27.0% | -100.7% | -99.0% |
| 6 | TTM 2026-03-31 | $6,292M | $59M | $0.09 | 2026-05-19 09:06:56 | 3.9% | 1480.7% | -1000.0% |
EPS
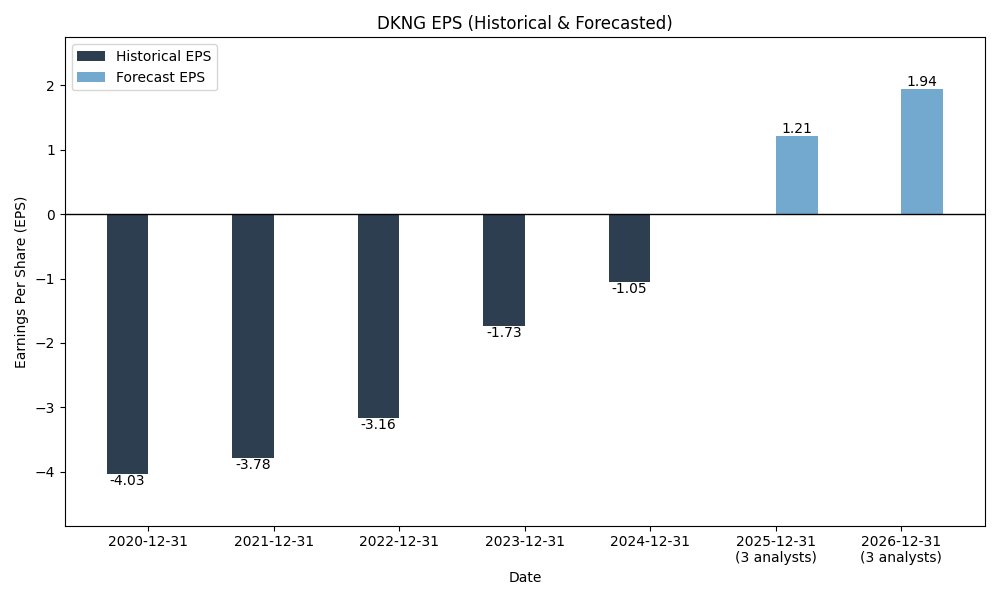
Forecasts
Y/Y % Change
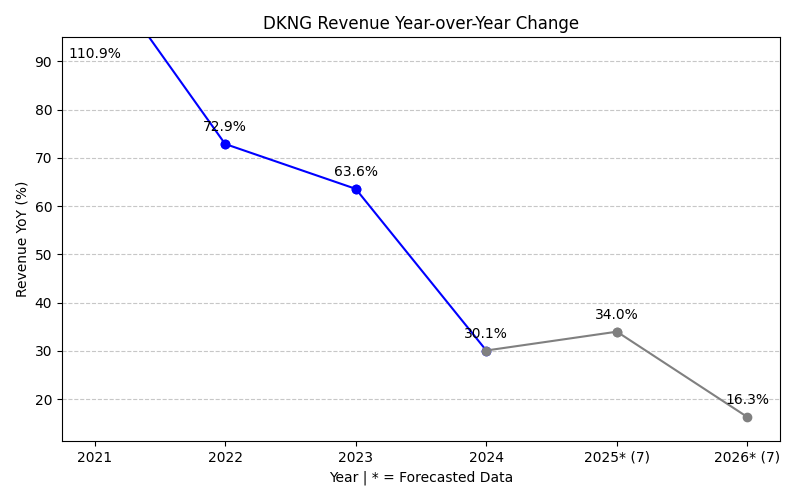
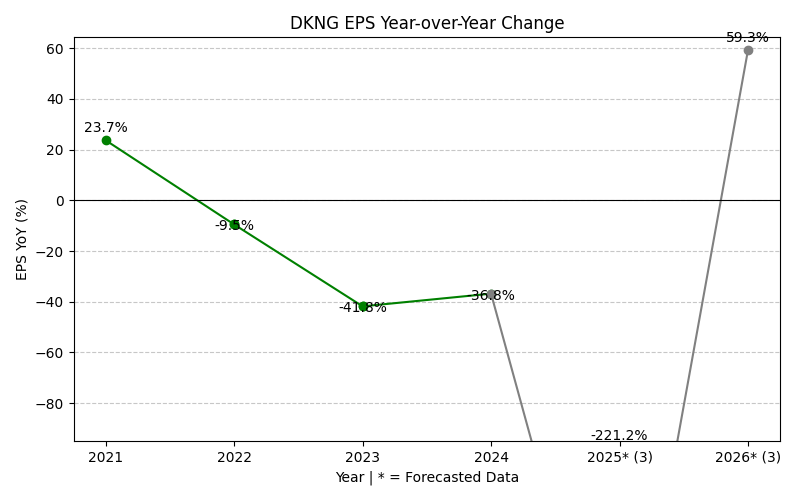
DKNG Year-over-Year Growth
| 2020 | 2021 | 2022 | 2023 | 2024 | 2025 | 2026 | 2027 | Average | |
|---|---|---|---|---|---|---|---|---|---|
| Revenue Growth (%) | 110.9% | 72.9% | 63.6% | 30.1% | 27.0% | 12.4% | 12.9% | 47.1% | |
| Revenue Analysts (#) | 0 | 0 | 0 | 0 | 0 | 0 | 34 | 32 | |
| EPS Growth (%) | 23.7% | -9.5% | -41.8% | -36.8% | -100.7% | 14254.7% | 59.5% | 2021.3% | |
| EPS Analysts (#) | 0 | 0 | 0 | 0 | 0 | 0 | 15 | 16 |
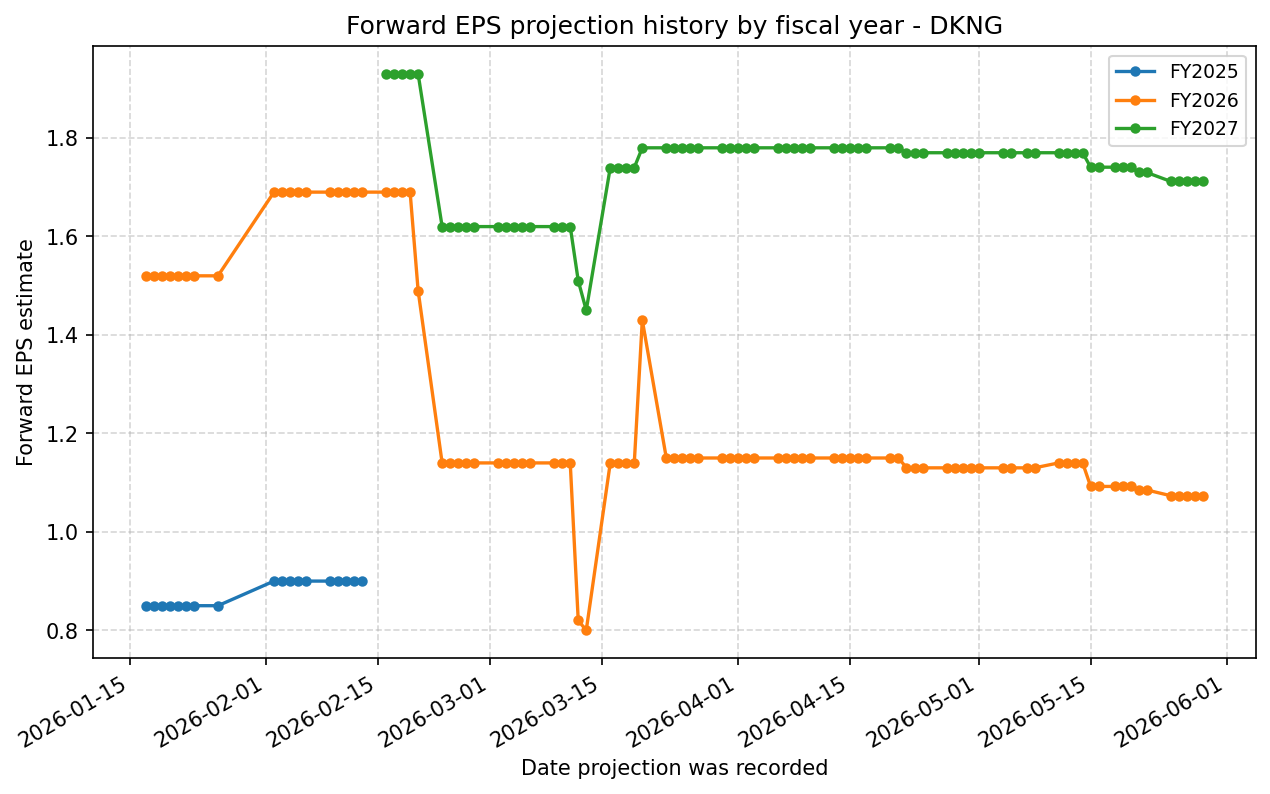
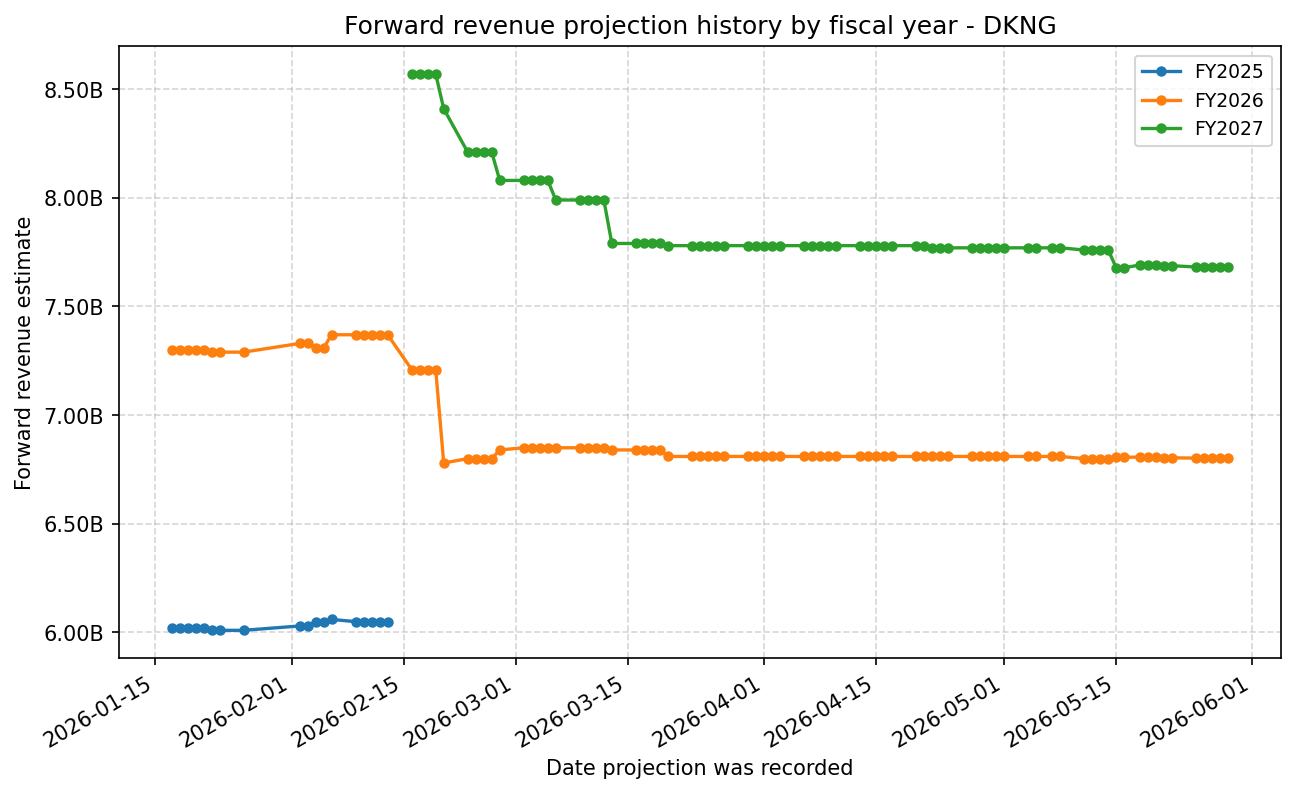
Forward Estimate History
How the next-FY EPS and revenue estimates have drifted over time. One line per fiscal year – past lines end when that FY became current.
Expenses
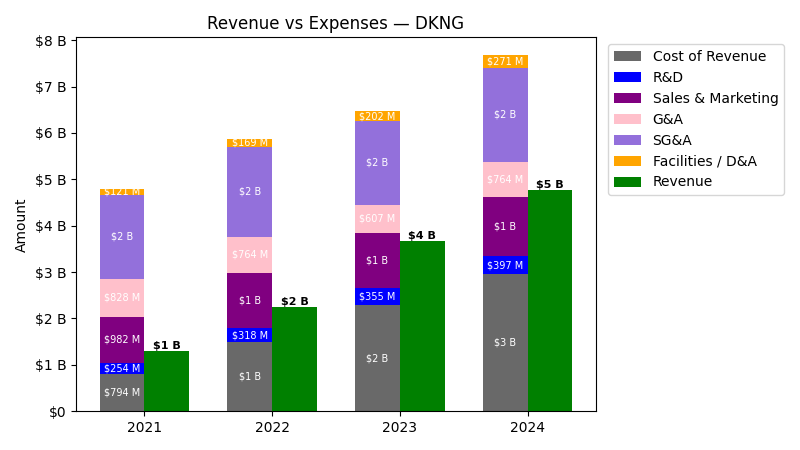
| Year | Revenue ($) | Cost of Revenue ($) | R&D ($) | Sales & Marketing ($) | G&A ($) | SG&A ($) | Facilities / D&A ($) |
|---|---|---|---|---|---|---|---|
| 2022 | $2.2B | $1.3B | $318.2M | $1.2B | $763.7M | $1.9B | $169.3M |
| 2023 | $3.7B | $2.1B | $355.2M | $1.2B | $606.6M | $1.8B | $201.9M |
| 2024 | $4.8B | $2.7B | $397.1M | $1.3B | $764.1M | $2.0B | $270.9M |
| 2025 | $6.1B | $3.3B | $459.9M | $1.4B | $673.6M | $2.1B | $275.5M |
| TTM | $6.3B | $3.4B | $479.8M | $1.4B | $675.1M | $2.1B | $277.0M |
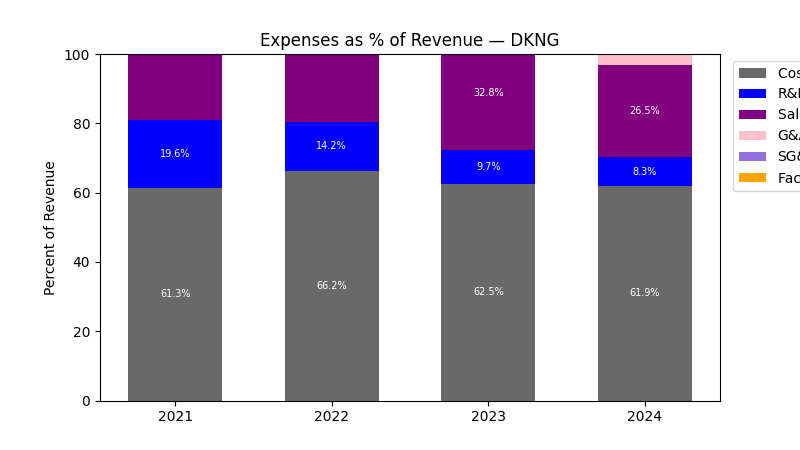
| Year | Revenue Change (%) | Cost of Revenue Change (%) | R&D Change (%) | Sales & Marketing Change (%) | G&A Change (%) | SG&A Change (%) | Facilities / D&A Change (%) |
|---|---|---|---|---|---|---|---|
| 2023 | 63.60 | 58.95 | 11.60 | 1.24 | -20.58 | -7.30 | 19.30 |
| 2024 | 30.07 | 28.20 | 11.81 | 5.35 | 25.97 | 12.27 | 34.14 |
| 2025 | 26.99 | 22.46 | 15.81 | 9.09 | -11.84 | 1.21 | 1.71 |
| TTM | 3.92 | 3.17 | 4.33 | 4.21 | 0.23 | 2.90 | 0.56 |
No unmapped expenses.
Segment Performance
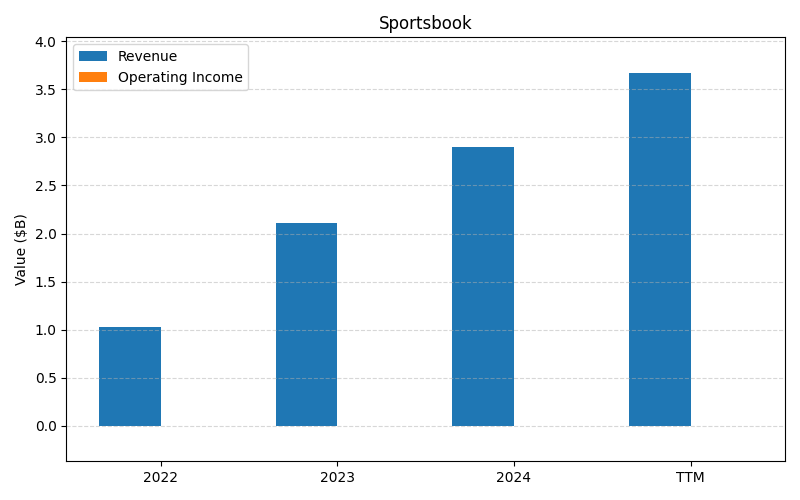
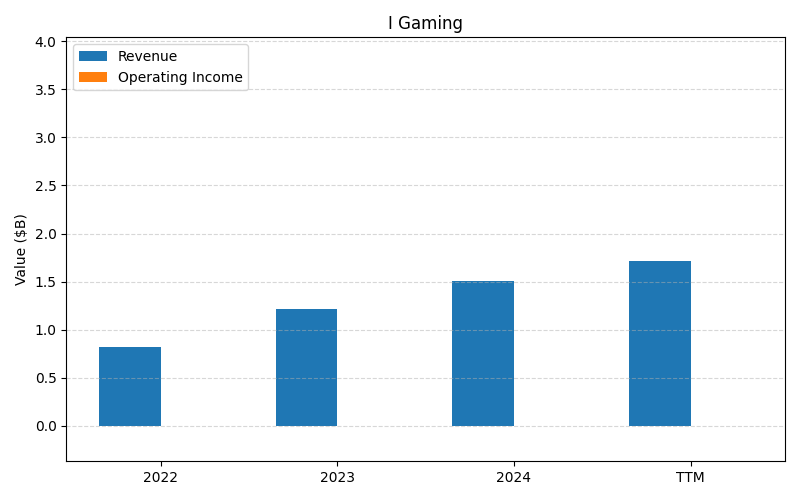
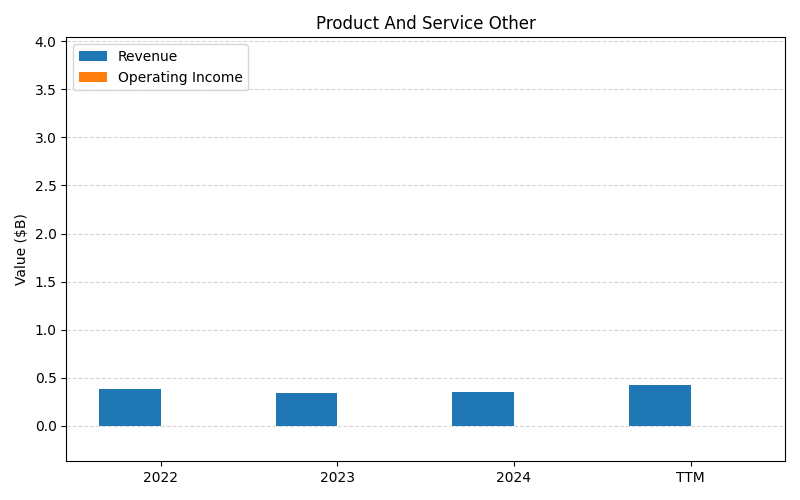
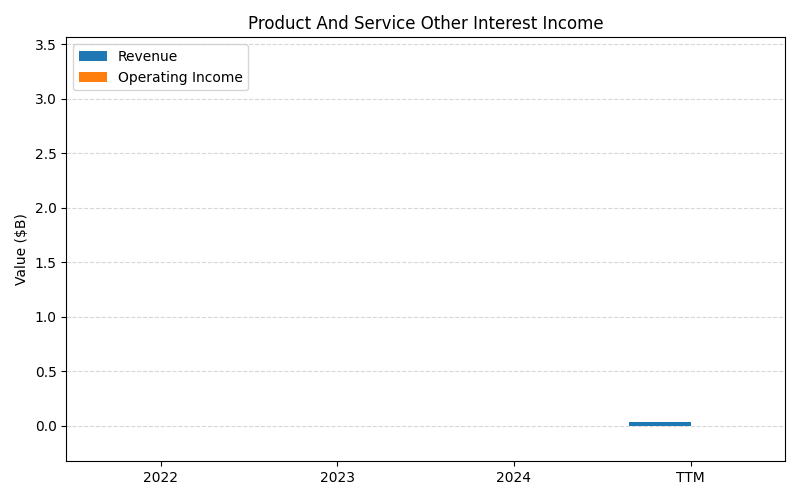
SEGMENTS v2025-09-09 · 2026-05-29 09:07 UTC — Units: $B. Rows list fiscal years (last 3 + TTM) with revenue for each segment; the final row shows the TTM revenue mix (operating income columns display “—” where mix is not applicable).
| Year | Sportsbook Rev | I Gaming Rev | Product And Service Other Rev | Product And Service Other Interest Income Rev | Total Rev |
|---|---|---|---|---|---|
| 2023 | 2.11B | 1.22B | 0.34B | – | 3.67B |
| 2024 | 2.90B | 1.51B | 0.36B | – | 4.77B |
| 2025 | 3.83B | 1.80B | 0.42B | 0.03B | 6.08B |
| TTM | 8.71B | 4.20B | 0.97B | – | 13.9B |
| % of Total (TTM) | 62.7% | 30.2% | 7.0% | – | 100% |
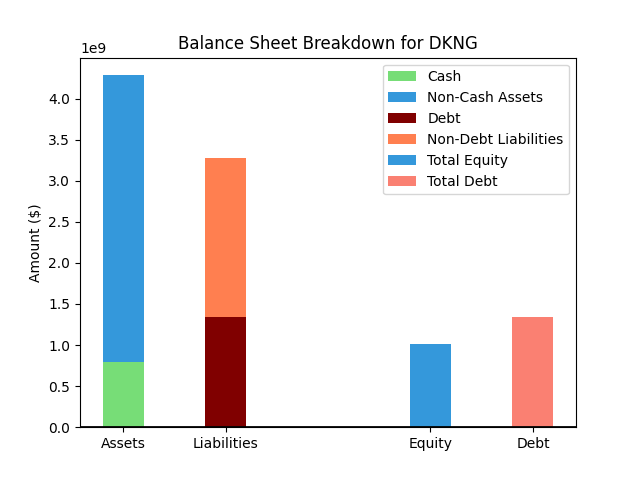
Balance Sheet
| Metric | Value | |
|---|---|---|
| 0 | Total Assets | $4,308M |
| 1 | Cash | $999M |
| 2 | Total Liabilities | $3,702M |
| 3 | Total Debt | $1,918M |
| 4 | Total Equity | $605M |
| 5 | Debt to Equity Ratio | 3.17 |
EPS & Dividend

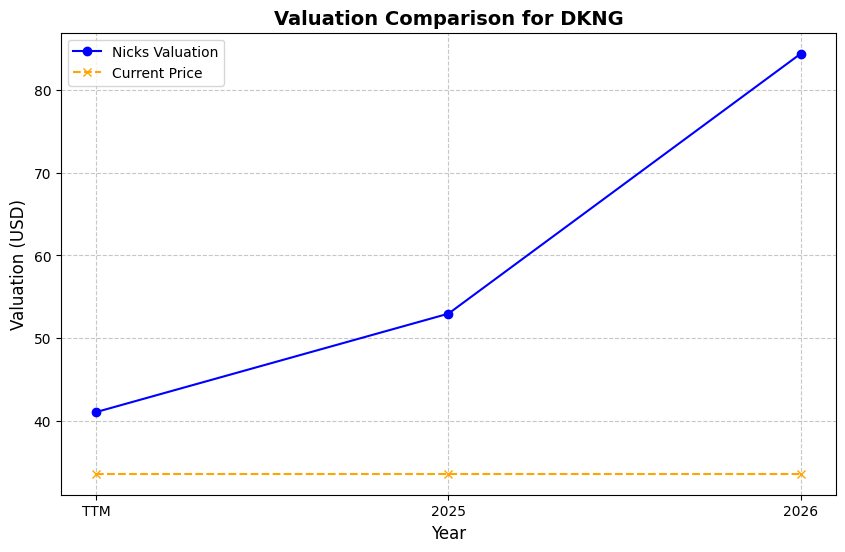
Valuation
| Share Price | Treasury Yield | Estimates | Fair Value (P/E) | Fair Value (P/S) | Current P/S | Current P/E |
|---|---|---|---|---|---|---|
| $24.49 | 4.5% | Nicks Growth: 20% Nick's Expected Margin: 10% |
Nicks: 42 Finviz: 6 |
Nick's: 4.242 | 1.9 | 272.1 |
| Basis | Year | Nicks Valuation | Nicks vs Share Price | Finviz Valuation | Finviz vs Share Price |
|---|---|---|---|---|---|
| $0.09 EPS | TTM | $3.82 | -84.4% | $0.57 | -97.7% |
| $1.07 EPS | 2026 | $45.54 | 85.9% | $6.81 | -72.2% |
| $1.71 EPS | 2027 | $72.62 | 196.5% | $10.85 | -55.7% |
Implied Growth
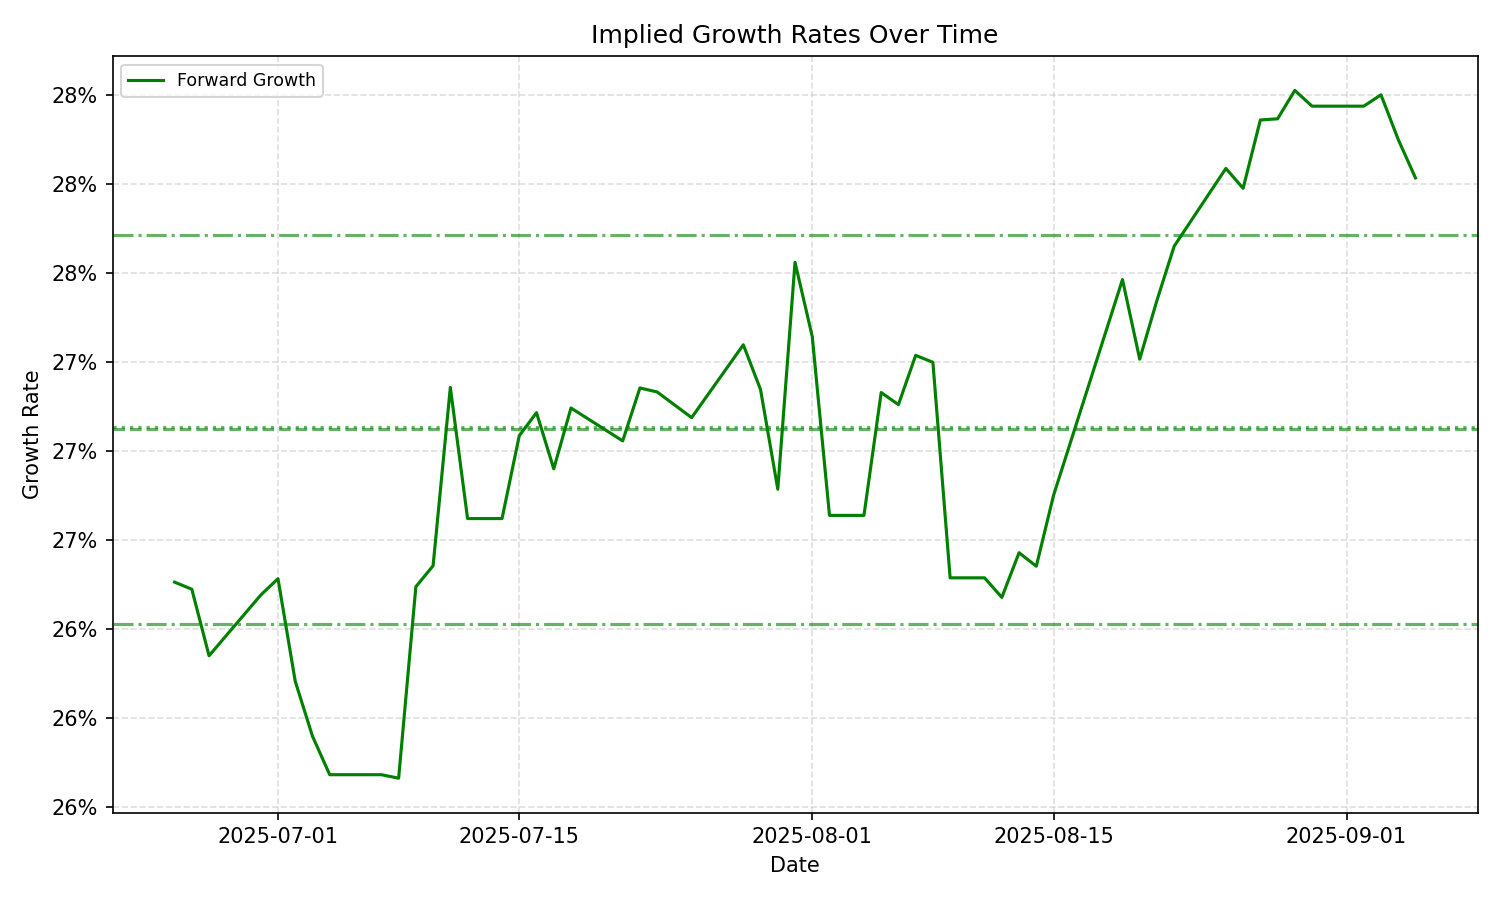
| Average | Median | Std Dev | Current | Percentile | ||||||
|---|---|---|---|---|---|---|---|---|---|---|
| TTM | Forward | TTM | Forward | TTM | Forward | TTM | Forward | TTM | Forward | |
| Timeframe | ||||||||||
| 1 Year | 43.95% | 17.59% | 44.01% | 22.12% | 0.32% | 8.82% | 43.62% | 8.12% | 20.0% | 26.6% |
| 3 Years | 43.95% | 17.59% | 44.01% | 22.12% | 0.32% | 8.82% | 43.62% | 8.12% | 20.0% | 26.6% |
| 5 Years | 43.95% | 17.59% | 44.01% | 22.12% | 0.32% | 8.82% | 43.62% | 8.12% | 20.0% | 26.6% |
| 10 Years | 43.95% | 17.59% | 44.01% | 22.12% | 0.32% | 8.82% | 43.62% | 8.12% | 20.0% | 26.6% |