Trump Media & Technology Group — DJT
| Close Price | Market Cap | P/E Ratio | Forward P/E Ratio | Implied Growth* | Implied Forward Growth* | Dividend | P/B Ratio |
|---|---|---|---|---|---|---|---|
| $8.38 | $2.32B | - | - | N/A | - | - | 1.9 |
Latest Headlines
- · Does Trump Media & Technology Group (DJT) Now Reflect Its Value After A 69% One Year Fall?
- · Weekly Wrap: Bitcoin Treads Water As Stocks Rally
- · Trump Media Moves To Sell Bitcoin As Losses Reach $455 Million
- · Eric Swider Addresses Trump Media Board Departure, Turns Full Attention to New Venture, Rubidex, a Secure Distributed Intelligence Platform
- · President Trump’s Truth Social Withdraws Bitcoin ETF Application
- · Trump Media Posts $406M Loss As Unrealized Losses In Crypto Investments Weigh On Results
Revenue & Net Income
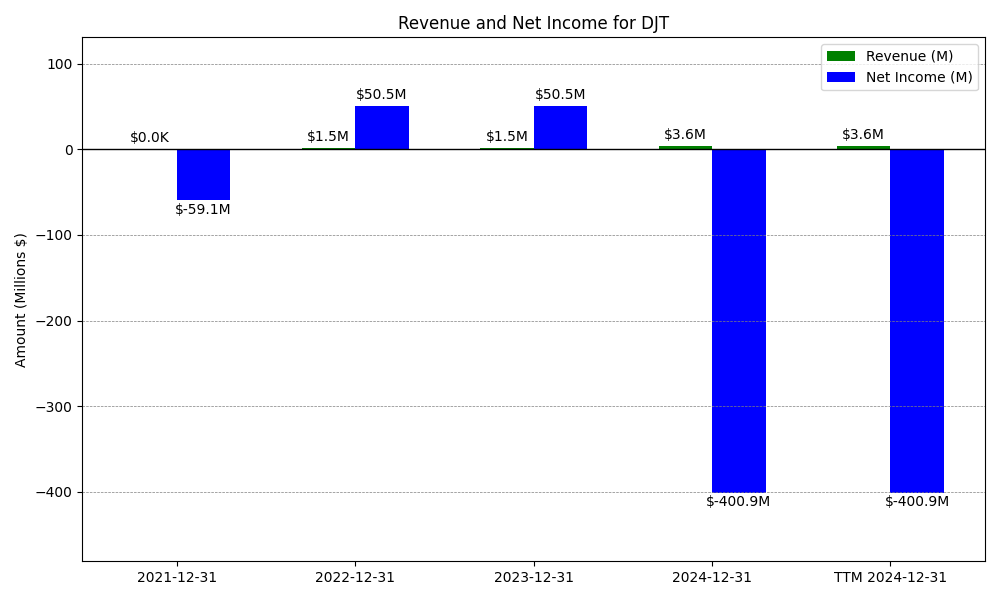
| Date | Revenue | Net_Income | EPS | Last_Updated | Revenue_Change | Net_Income_Change | EPS_Change | |
|---|---|---|---|---|---|---|---|---|
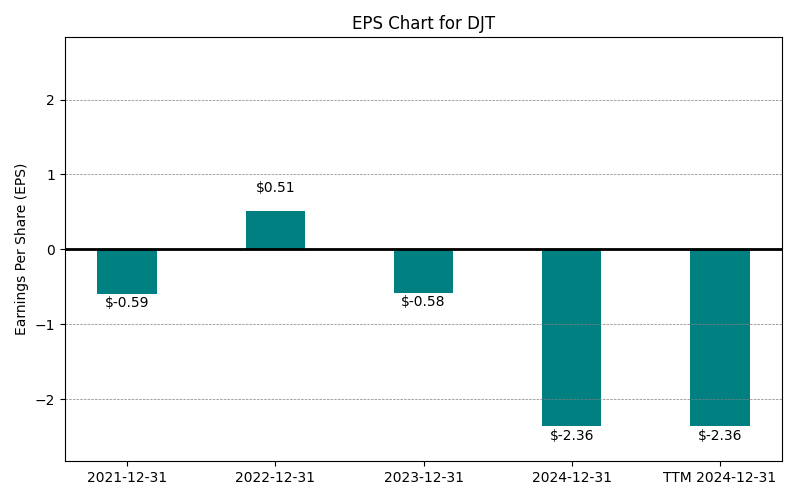
| 0 | 2021-12-31 | $0M | $-59M | $-0.43 | 2026-03-09 08:37:03 | N/A | N/A | N/A |
| 1 | 2022-12-31 | $1M | $51M | $0.37 | 2026-05-26 09:07:35 | inf% | -185.5% | -185.5% |
| 2 | 2023-12-31 | $4M | $-58M | $-0.43 | 2026-05-26 09:07:35 | 180.9% | -215.2% | -215.2% |
| 3 | 2024-12-31 | $4M | $-401M | $-2.36 | 2026-05-26 09:07:35 | -12.4% | 588.9% | 454.4% |
| 4 | 2025-12-31 | $4M | $-712M | $-2.80 | 2026-05-26 09:07:35 | 1.8% | 77.6% | 18.6% |
| 5 | TTM 2026-03-31 | $4M | $-1,086M | $-4.13 | 2026-05-19 09:06:47 | 1.4% | 52.5% | 47.5% |
EPS
Forecasts


Y/Y % Change


No data available
Forward Estimate History
How the next-FY EPS and revenue estimates have drifted over time. One line per fiscal year – past lines end when that FY became current.

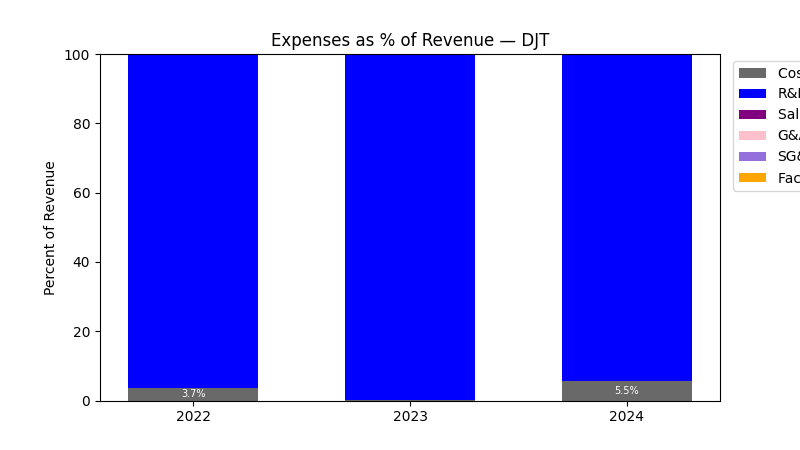
Expenses
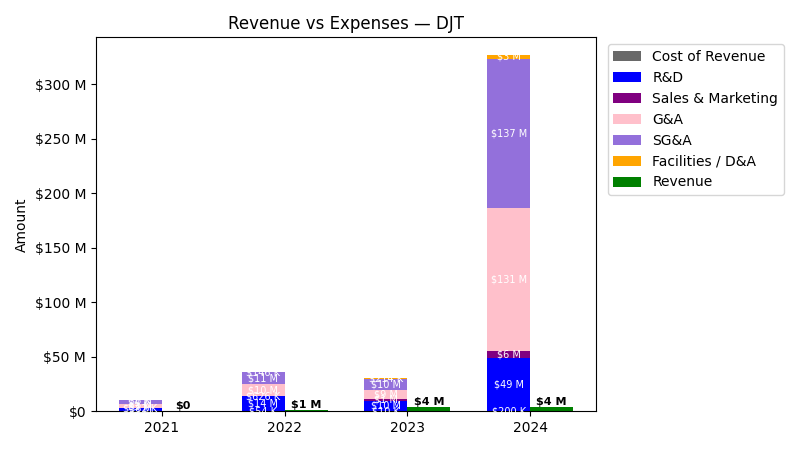
| Year | Revenue ($) | R&D ($) | Sales & Marketing ($) | G&A ($) | SG&A ($) | Facilities / D&A ($) |
|---|---|---|---|---|---|---|
| 2022 | $1.5M | $13.6M | $625.9K | $10.3M | $11.0M | $145.9K |
| 2023 | $4.1M | $9.7M | $1.3M | $8.9M | $10.2M | $214.2K |
| 2024 | $3.6M | $49.1M | $6.4M | $130.6M | $137.0M | $3.4M |
| 2025 | $3.7M | $42.8M | $2.5M | $119.1M | $121.6M | $8.3M |
| TTM | $3.7M | $38.6M | $2.7M | $131.9M | $134.6M | $8.4M |
| Year | Revenue Change (%) | R&D Change (%) | Sales & Marketing Change (%) | G&A Change (%) | SG&A Change (%) | Facilities / D&A Change (%) |
|---|---|---|---|---|---|---|
| 2023 | 180.93 | -28.73 | 104.44 | -14.18 | -7.41 | 46.81 |
| 2024 | -12.40 | 405.41 | 398.88 | 1371.13 | 1248.66 | 1465.27 |
| 2025 | 1.76 | -12.89 | -60.84 | -8.79 | -11.22 | 148.51 |
| TTM | 1.36 | -9.73 | 7.75 | 10.71 | 10.65 | 1.32 |
No unmapped expenses.
Segment Performance
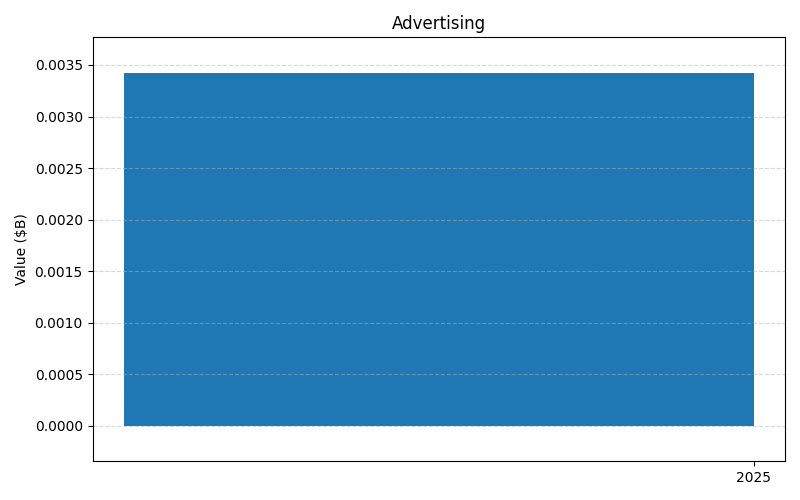
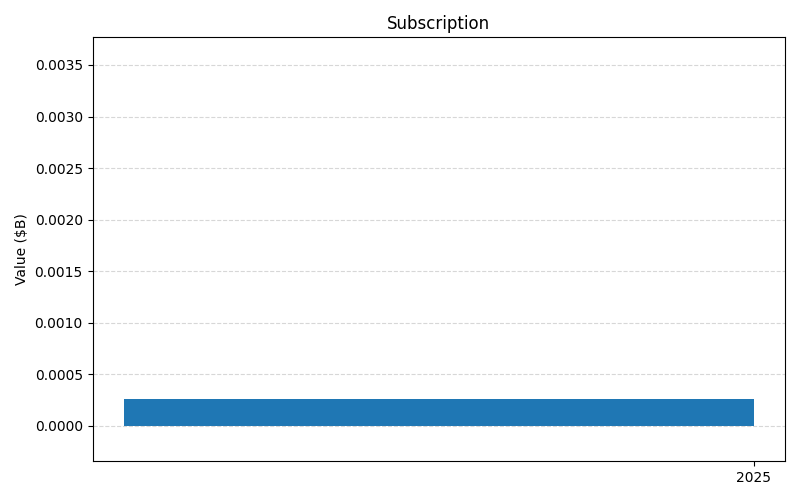
SEGMENTS v2025-09-09 · 2026-05-26 09:07 UTC — Units: $M. Rows list fiscal years (last 3 + TTM) with revenue for each segment; the final row shows the TTM revenue mix (operating income columns display “—” where mix is not applicable).
| Year | Advertising Rev | Subscription Rev | Total Rev |
|---|---|---|---|
| 2025 | 3.43M | 0.26M | 3.68M |
Balance Sheet
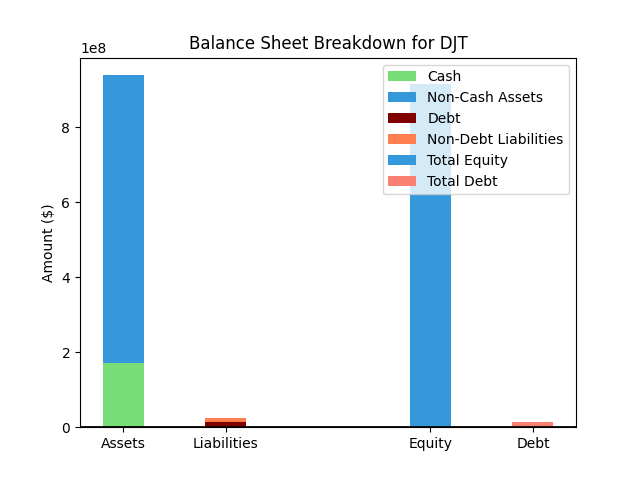
| Metric | Value | |
|---|---|---|
| 0 | Total Assets | $3,265M |
| 1 | Cash | $166M |
| 2 | Total Liabilities | $987M |
| 3 | Total Debt | $954M |
| 4 | Total Equity | $2,278M |
| 5 | Debt to Equity Ratio | 0.42 |
EPS & Dividend

Valuation

No data available
No data available
Implied Growth
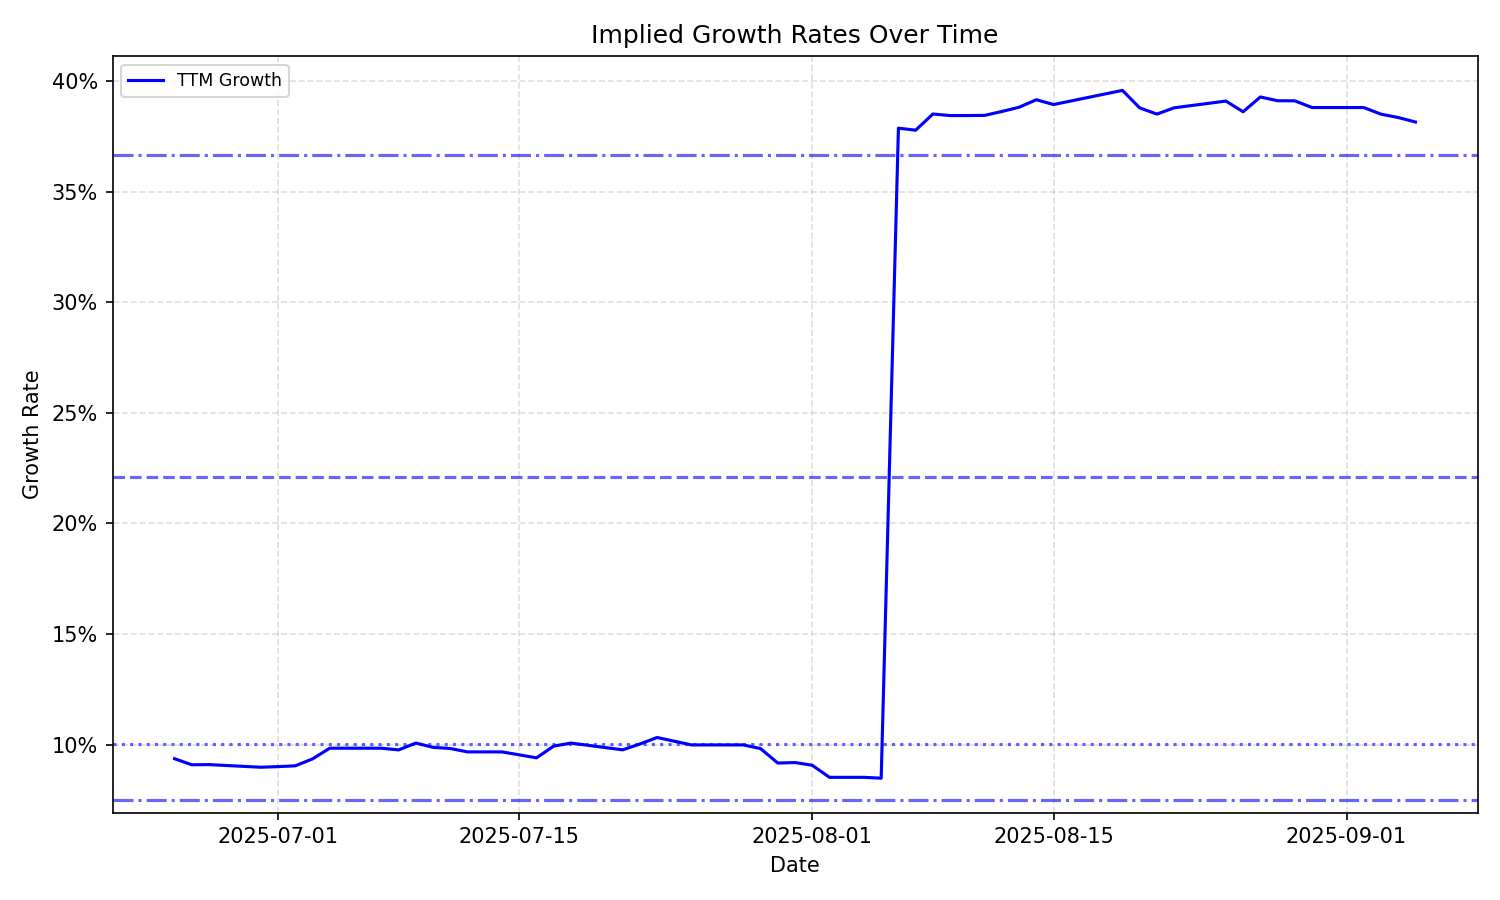
| Average | Median | Std Dev | Current | Percentile | ||||||
|---|---|---|---|---|---|---|---|---|---|---|
| TTM | Forward | TTM | Forward | TTM | Forward | TTM | Forward | TTM | Forward | |
| Timeframe | ||||||||||
| 1 Year | 29.26% | – | 37.78% | – | 13.27% | – | 35.03% | – | 31.8% | – |
| 3 Years | 29.26% | – | 37.78% | – | 13.27% | – | 35.03% | – | 31.8% | – |
| 5 Years | 29.26% | – | 37.78% | – | 13.27% | – | 35.03% | – | 31.8% | – |
| 10 Years | 29.26% | – | 37.78% | – | 13.27% | – | 35.03% | – | 31.8% | – |