Walt Disney Company (The) — DIS
| Close Price | Market Cap | P/E Ratio | Forward P/E Ratio | Implied Growth* | Implied Forward Growth* | Dividend | P/B Ratio |
|---|---|---|---|---|---|---|---|
| $101.83 | $176.83B | 16.3 | 13.6 | 9.5% | 7.6% | $1.50 1.5% | 1.7 |
Latest Headlines
- · Is Walt Disney Stock Underperforming the Nasdaq?
- · If Spider-Man Wins 2026’s Box Office Crown, These Stocks Win Too
- · 3 Reasons to Buy Disney Stock in June
- · Netflix's Ad Business Expansion Continues: More Upside Ahead?
- · Disney and Philips bring together beloved storytelling and innovative technology to support kids undergoing MRI exams
- · Disney World will revamp one of Walt Disney's most beloved rides — what to expect from the new Carousel of Progress
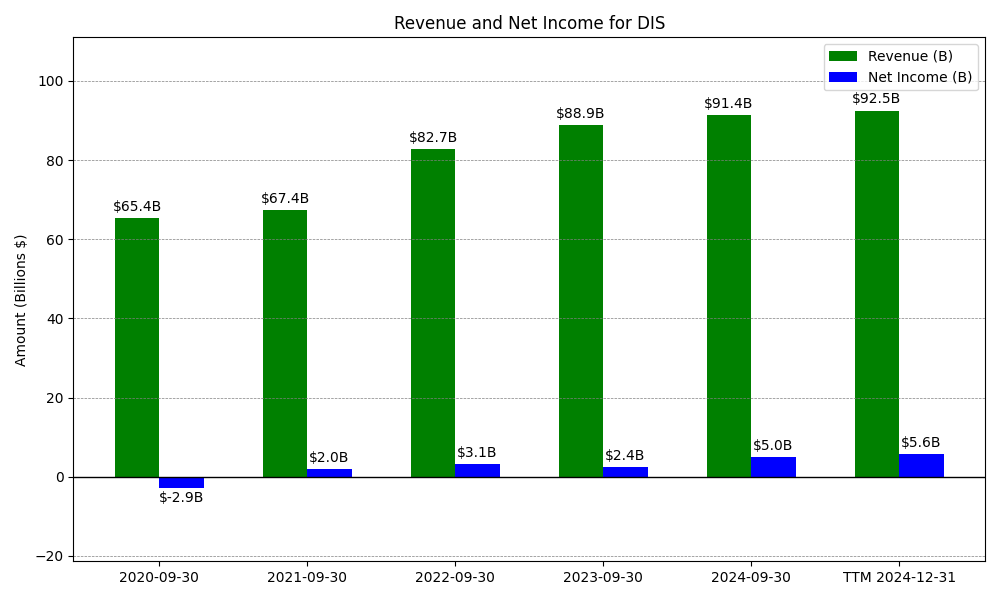
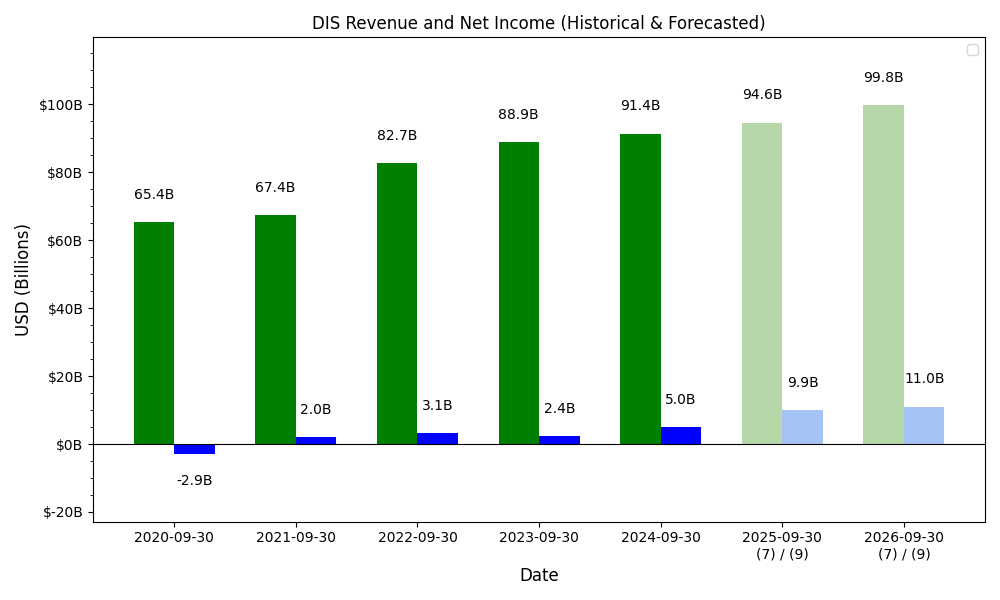
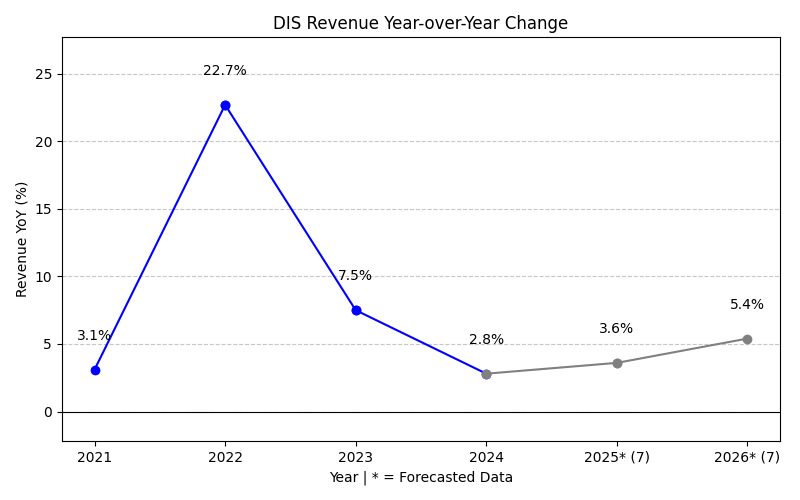
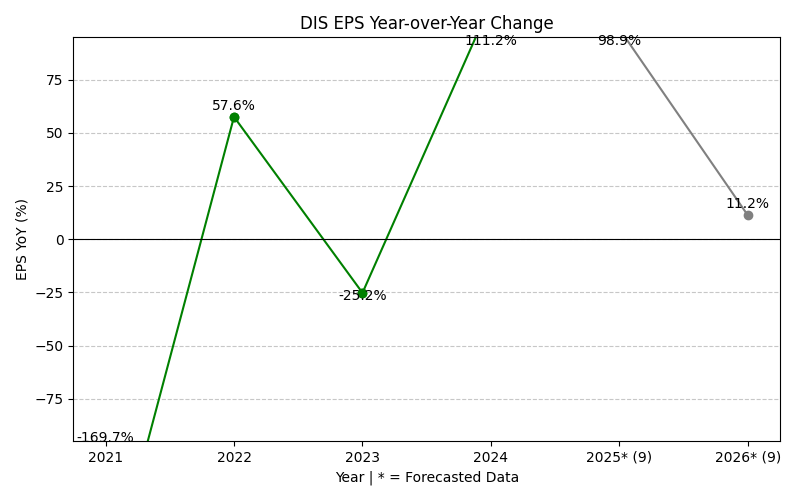
Revenue & Net Income
| Date | Revenue | Net_Income | EPS | Last_Updated | Revenue_Change | Net_Income_Change | EPS_Change | |
|---|---|---|---|---|---|---|---|---|
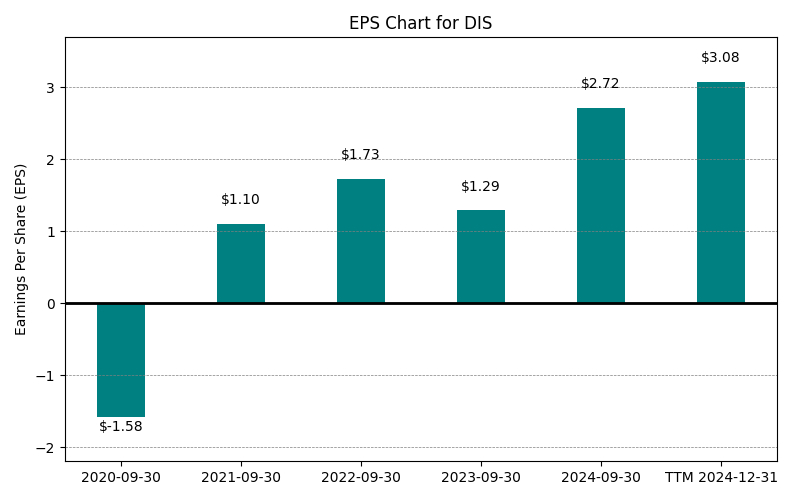
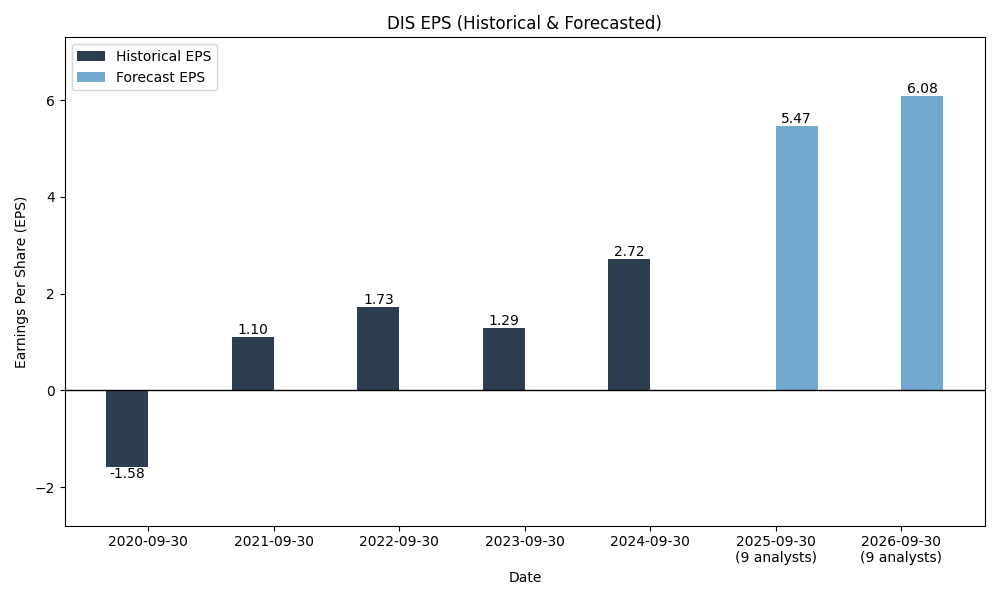
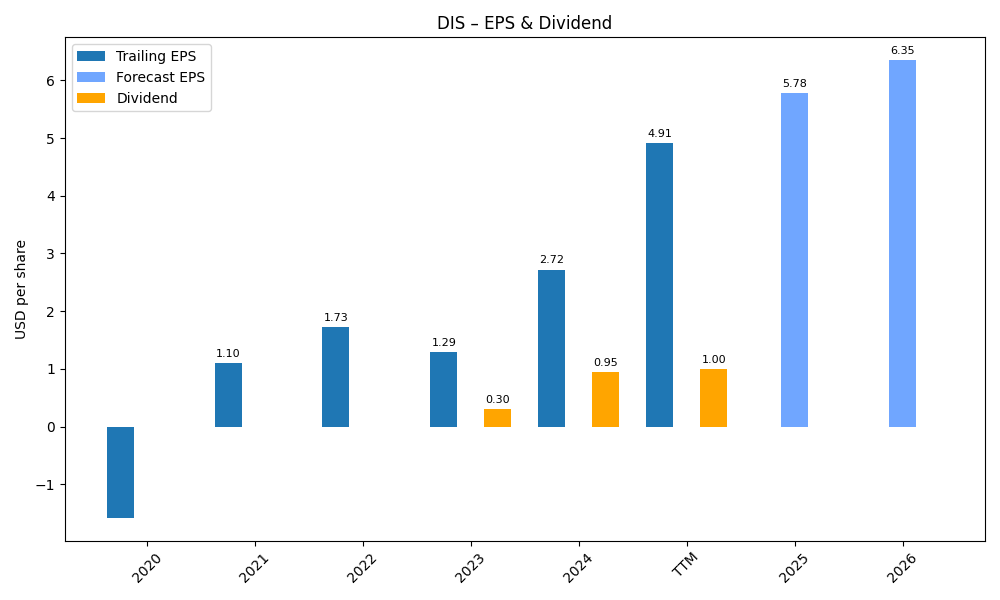
| 0 | 2020-09-30 | $65,388M | $-2,864M | $-1.58 | 2024-02-04 04:18:29 | N/A | N/A | N/A |
| 1 | 2021-09-30 | $67,418M | $1,995M | $1.10 | 2024-02-04 04:18:29 | 3.1% | -169.7% | -169.6% |
| 2 | 2022-09-30 | $82,722M | $3,145M | $1.73 | 2026-05-29 09:07:23 | 22.7% | 57.6% | 57.3% |
| 3 | 2023-09-30 | $88,898M | $2,354M | $1.29 | 2026-05-29 09:07:23 | 7.5% | -25.2% | -25.4% |
| 4 | 2024-09-30 | $91,361M | $4,972M | $2.72 | 2026-05-29 09:07:23 | 2.8% | 111.2% | 110.9% |
| 5 | 2025-09-30 | $94,425M | $12,404M | $6.88 | 2026-05-29 09:07:23 | 3.4% | 149.5% | 152.9% |
| 6 | TTM 2026-03-31 | $97,263M | $11,224M | $6.25 | 2026-05-08 08:32:33 | 3.0% | -9.5% | -9.2% |
EPS
Forecasts
Y/Y % Change
DIS Year-over-Year Growth
| 2020 | 2021 | 2022 | 2023 | 2024 | 2025 | 2026 | 2027 | Average | |
|---|---|---|---|---|---|---|---|---|---|
| Revenue Growth (%) | 3.1% | 22.7% | 7.5% | 2.8% | 3.4% | 7.6% | 4.3% | 7.3% | |
| Revenue Analysts (#) | 0 | 0 | 0 | 0 | 0 | 0 | 27 | 27 | |
| EPS Growth (%) | -169.7% | 57.6% | -25.2% | 111.2% | 149.5% | -4.6% | 9.9% | 18.4% | |
| EPS Analysts (#) | 0 | 0 | 0 | 0 | 0 | 0 | 26 | 26 |
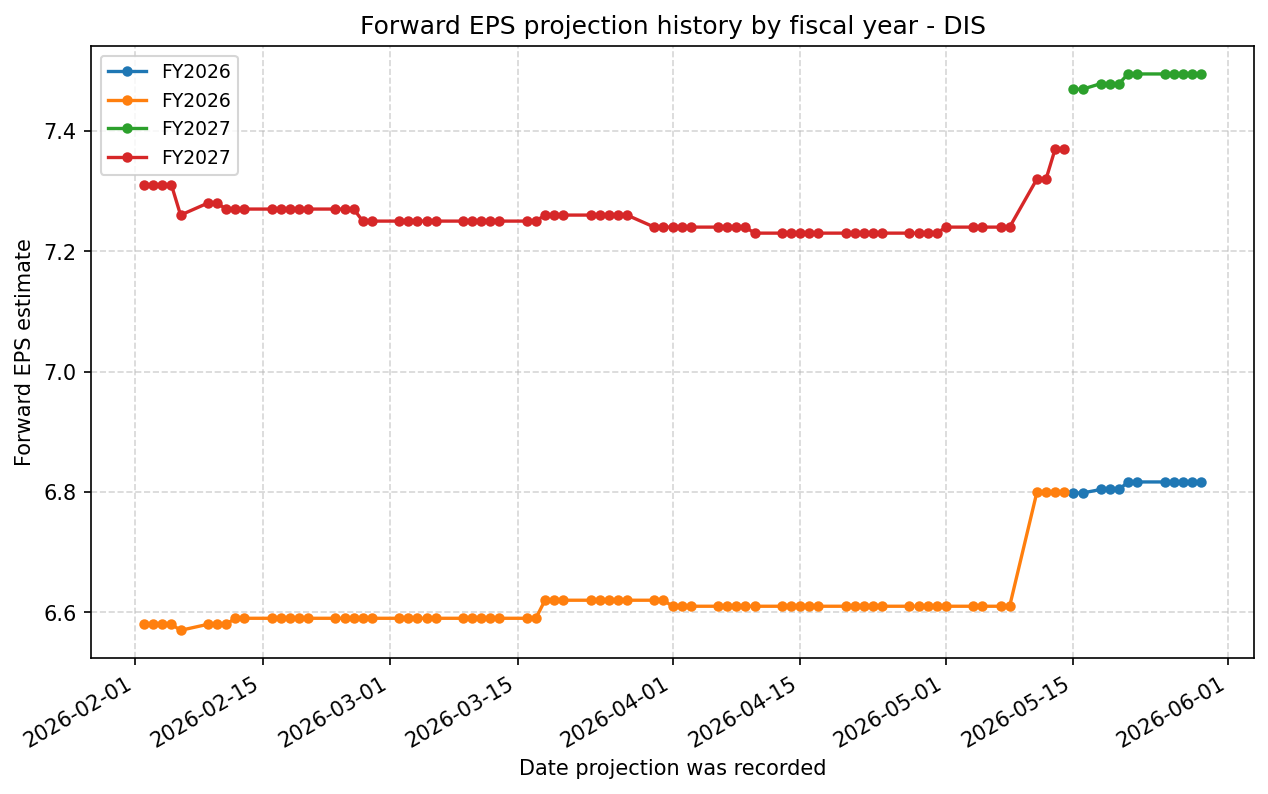
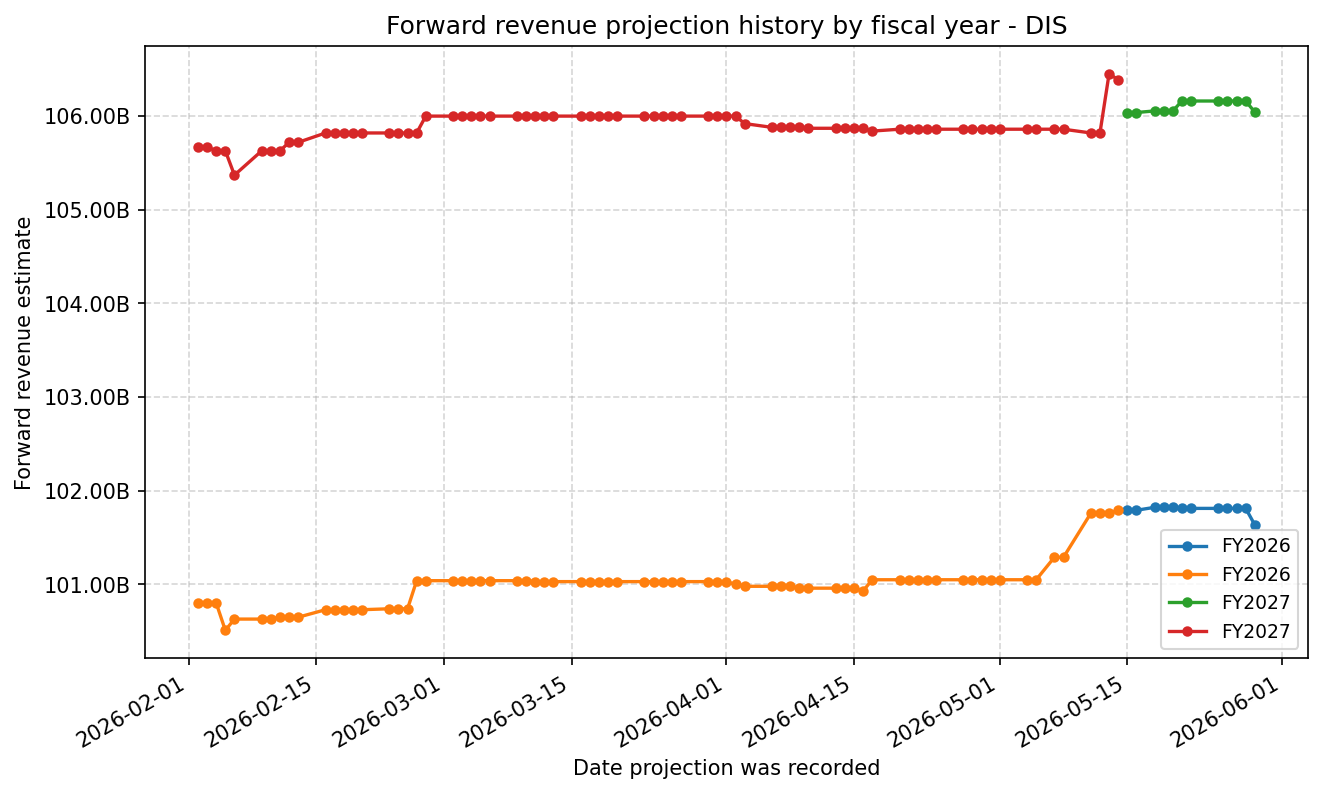
Forward Estimate History
How the next-FY EPS and revenue estimates have drifted over time. One line per fiscal year – past lines end when that FY became current.
Expenses
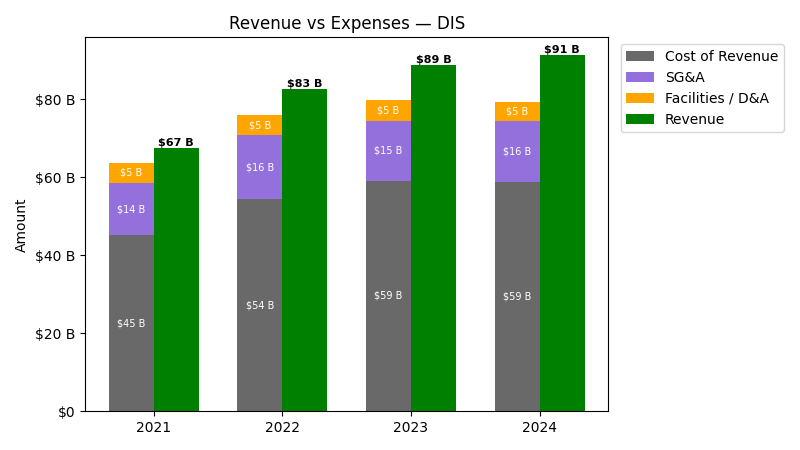
| Year | Revenue ($) | Cost of Revenue ($) | SG&A ($) | Facilities / D&A ($) |
|---|---|---|---|---|
| 2022 | $82.7B | $49.2B | $16.4B | $5.2B |
| 2023 | $88.9B | $53.8B | $15.3B | $5.4B |
| 2024 | $91.4B | $53.7B | $15.8B | $5.0B |
| 2025 | $94.4B | $53.4B | $16.5B | $5.3B |
| TTM | $97.3B | $55.7B | $16.8B | $5.4B |
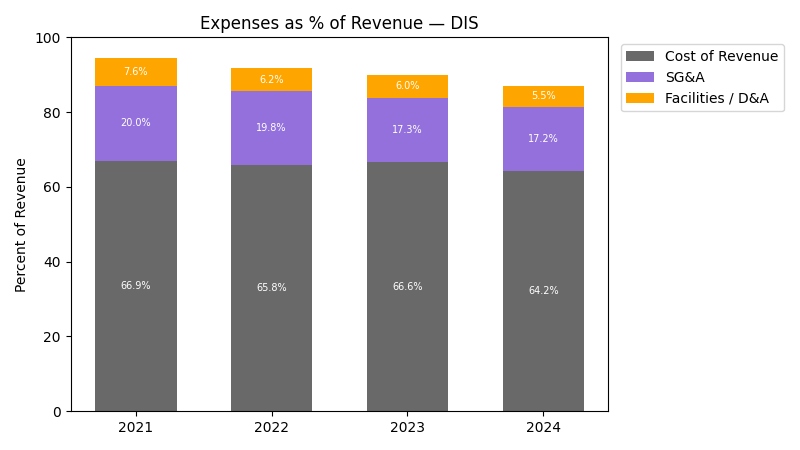
| Year | Revenue Change (%) | Cost of Revenue Change (%) | SG&A Change (%) | Facilities / D&A Change (%) |
|---|---|---|---|---|
| 2023 | 7.47 | 9.33 | -6.42 | 3.99 |
| 2024 | 2.77 | -0.23 | 2.76 | -7.06 |
| 2025 | 3.35 | -0.50 | 4.71 | 6.73 |
| TTM | 3.01 | 4.18 | 1.72 | 2.27 |
No unmapped expenses.
Segment Performance
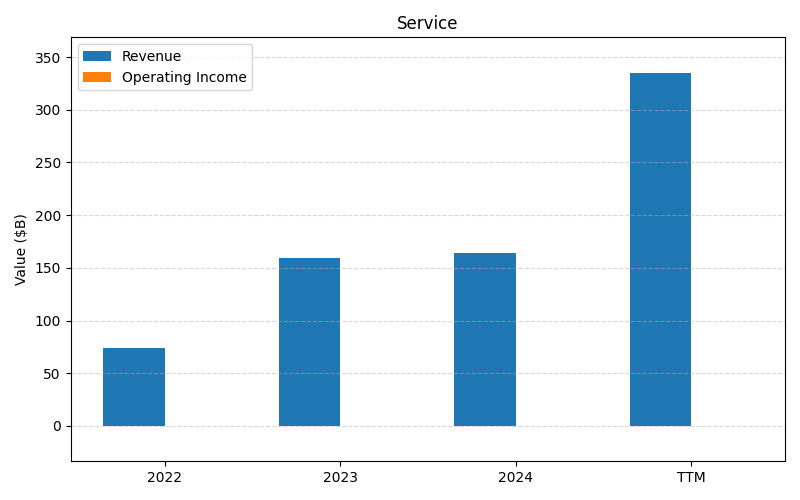
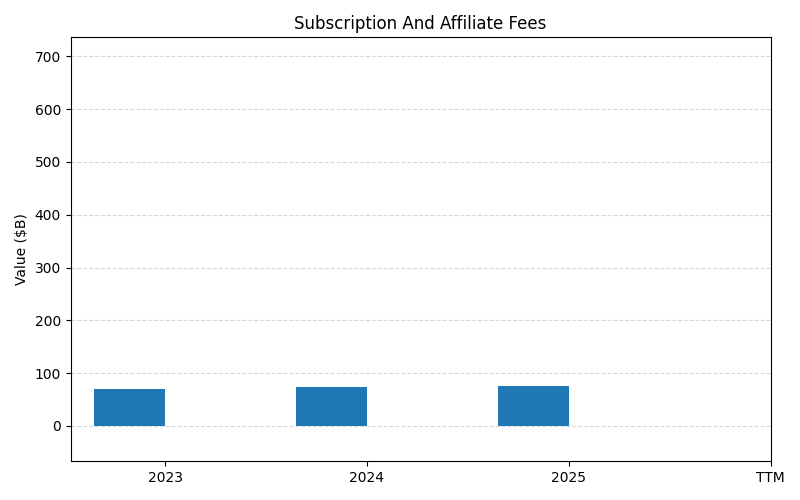
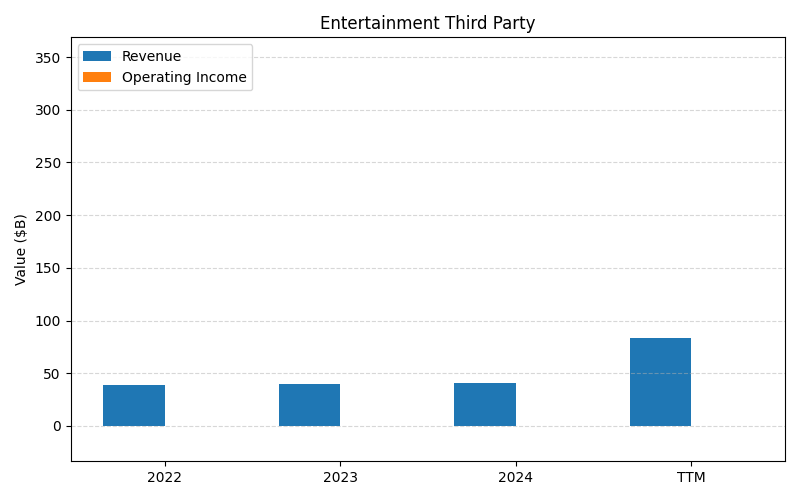
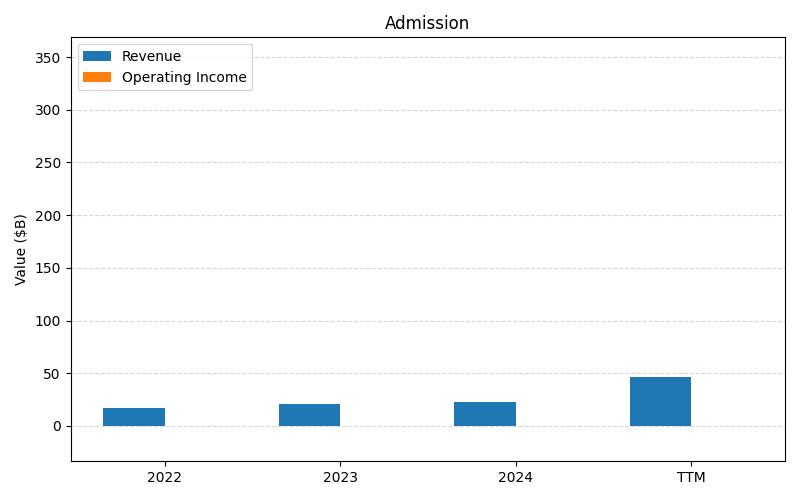
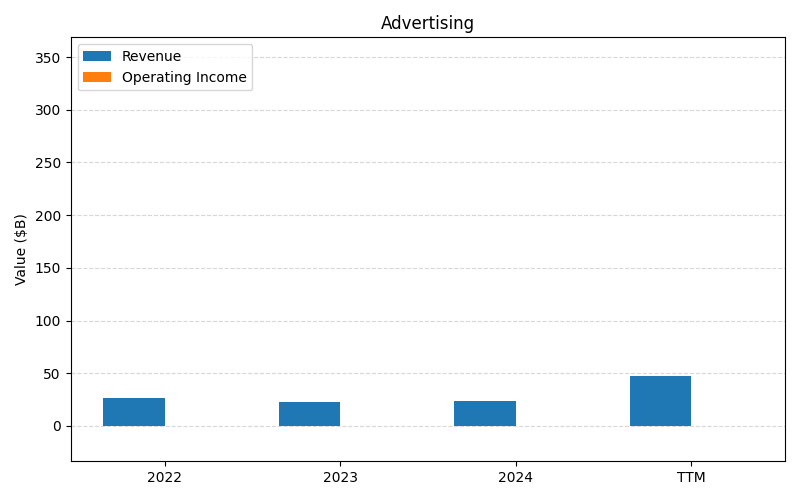
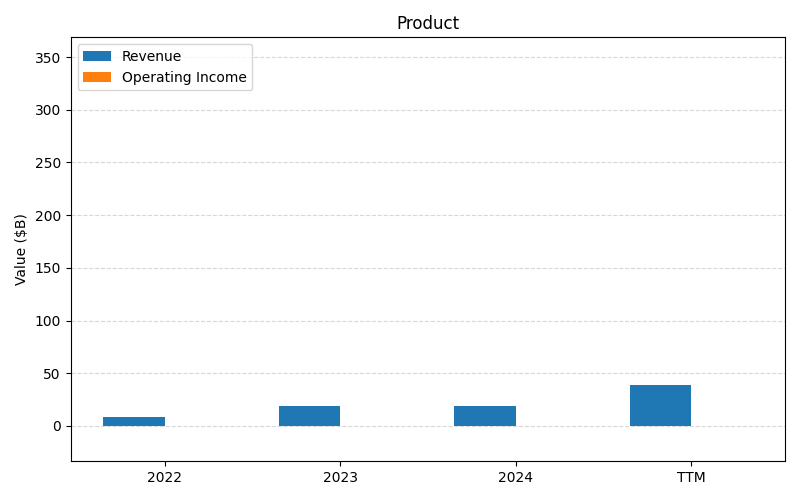
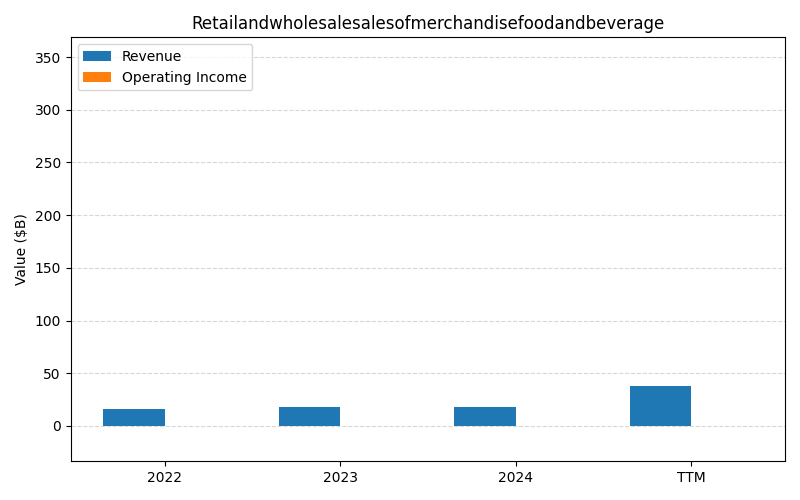
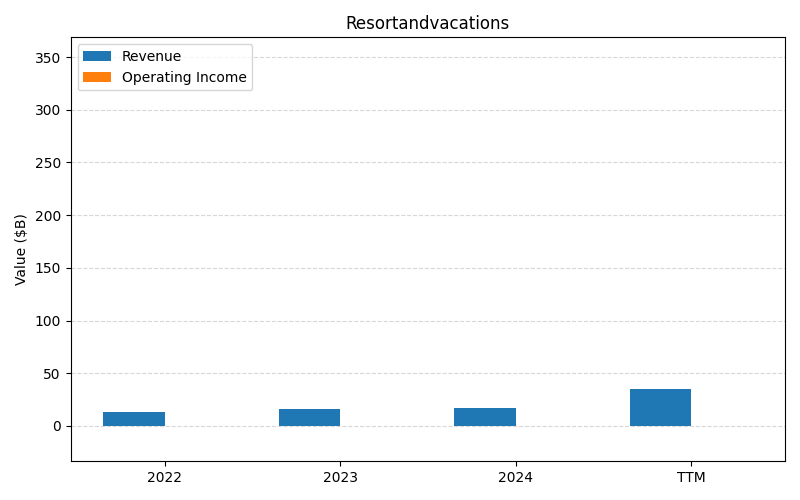
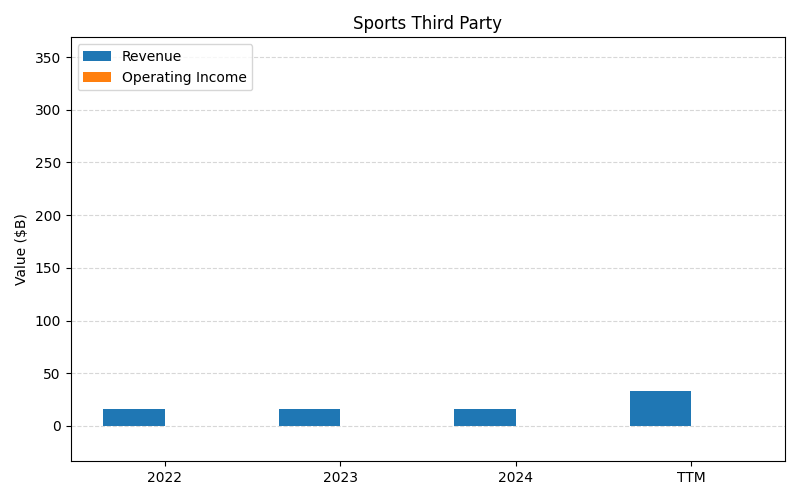
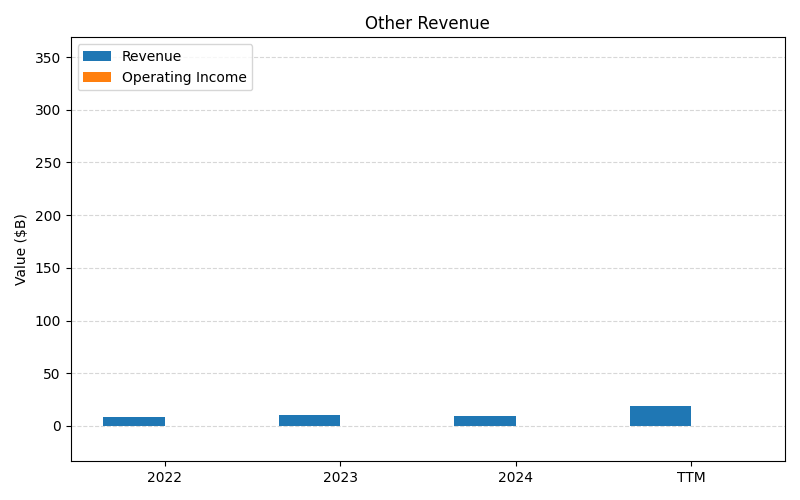
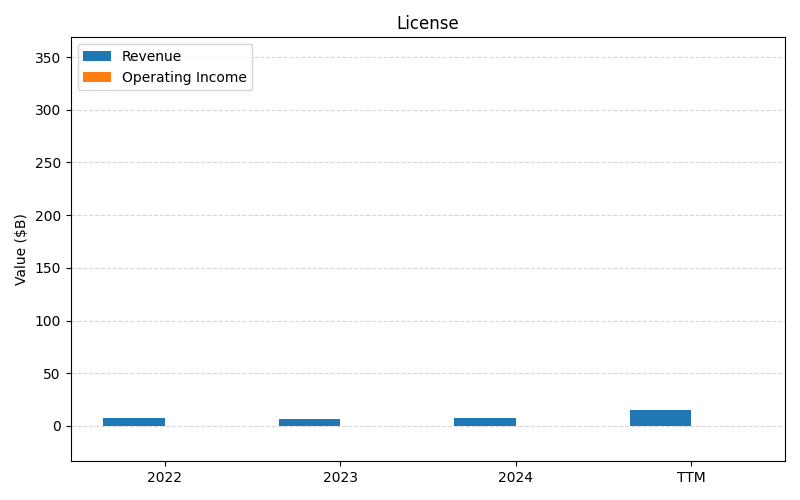
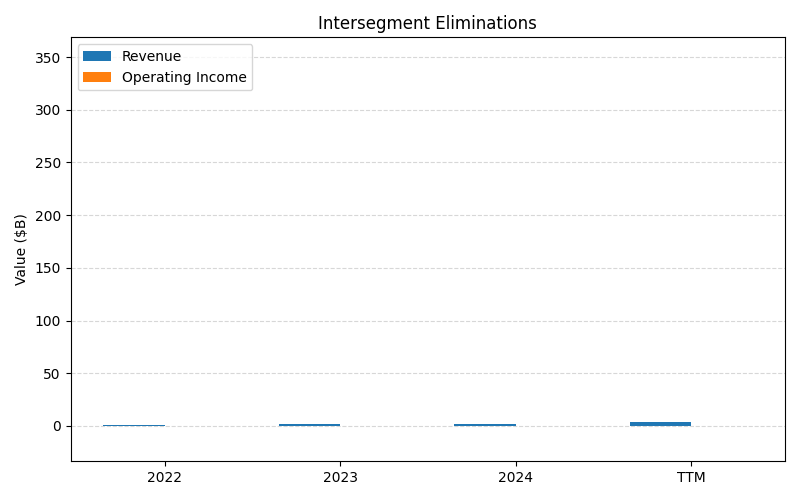
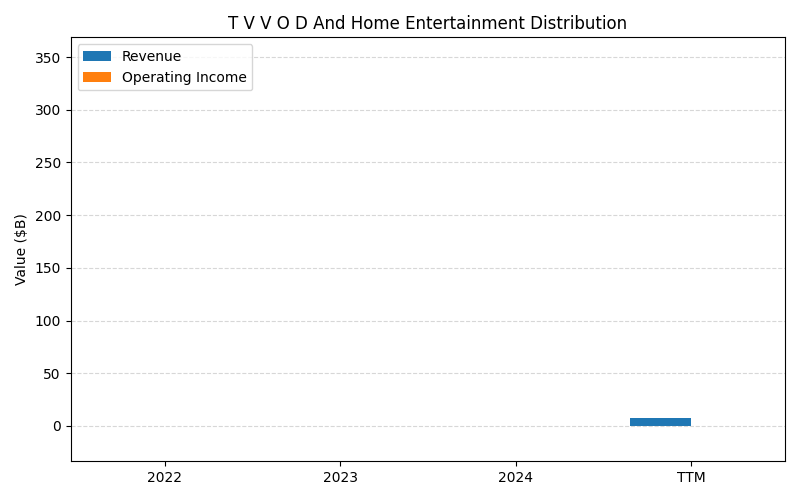
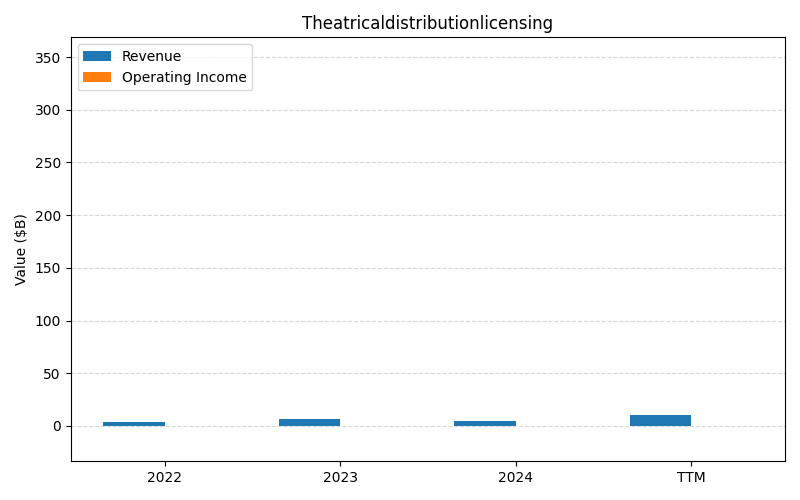
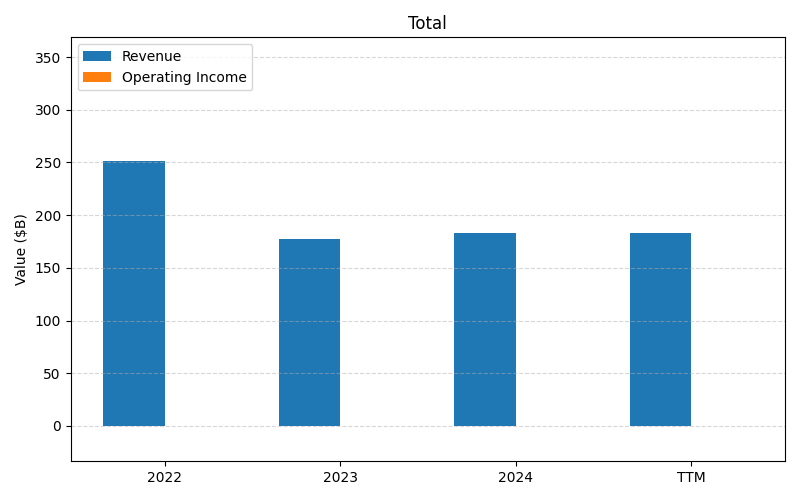
SEGMENTS v2025-09-09 · 2026-05-29 09:07 UTC — Units: $B. Rows list fiscal years (last 3 + TTM) with revenue for each segment; the final row shows the TTM revenue mix (operating income columns display “—” where mix is not applicable).
| Year | Services Rev | Subscription And Affiliate Fees Rev | Entertainment Third Party Rev | Admission Rev | Advertising Rev | Prod Rev | Retailandwholesalesalesofmerchandisefoodandbeverage Rev | Resortandvacations Rev | Sports Third Party Rev | Other Revenue Rev | License Rev | Intersegment Eliminations Rev | T V V O D And Home Entertainment Distribution Rev | Theatricaldistributionlicensing Rev | Total Rev | Total Rev |
|---|---|---|---|---|---|---|---|---|---|---|---|---|---|---|---|---|
| 2023 | 79.6B | 69.6B | 40.3B | 20.8B | 23B | 9.34B | 17.8B | 15.9B | 16.1B | 10.1B | 6.26B | 1.40B | 7.85B | 6.35B | 413.3B | 413.3B |
| 2024 | 163.7B | 73.1B | 40.8B | 22.3B | 23.8B | 19B | 18.4B | 16.8B | 16.4B | 9.52B | 7.57B | 1.59B | 6.71B | 4.53B | 515.6B | 515.6B |
| 2025 | 169.2B | 75.6B | 42B | 23.4B | 22.2B | 19.7B | 19.3B | 18.4B | 16.3B | 9.44B | 7.76B | 1.87B | 7.55B | 5.18B | 532.3B | 532.3B |
| TTM | 599.1B | 268B | 149.2B | 82.6B | 81.2B | 68.9B | 67.4B | 64.1B | 58.3B | 33.3B | 26.7B | 6.71B | – | – | 1505.6B | 1505.6B |
| % of Total (TTM) | 39.8% | 17.8% | 9.9% | 5.5% | 5.4% | 4.6% | 4.5% | 4.3% | 3.9% | 2.2% | 1.8% | 0.4% | – | – | 100% | 100% |
Segment Performance (Axis 2)
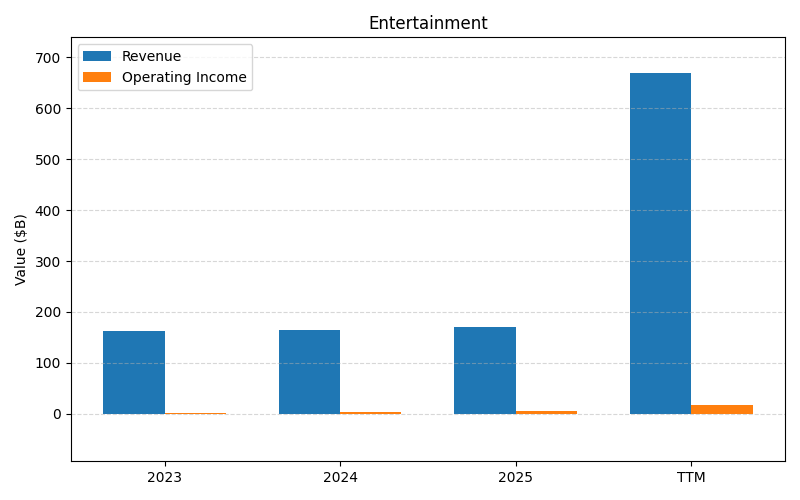
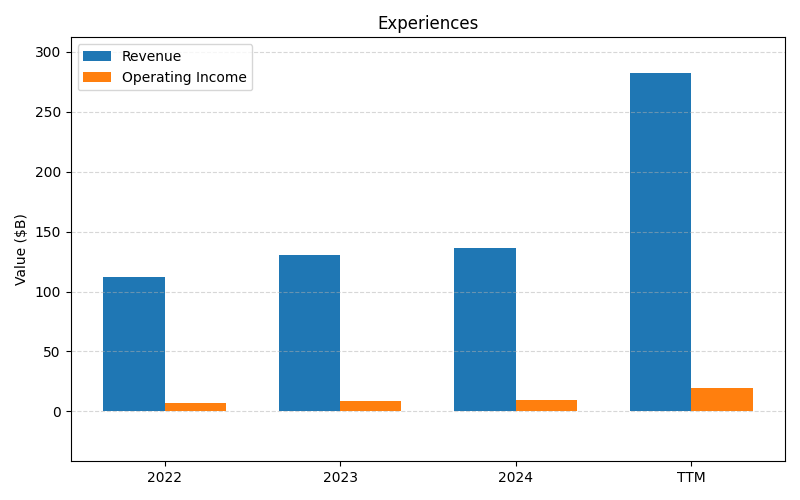
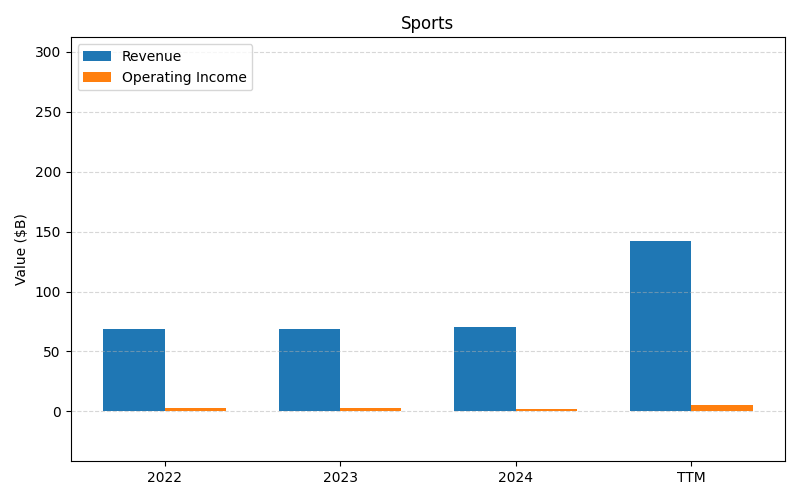
SEGMENTS v2025-09-09 · 2026-05-29 09:07 UTC — Units: $B. Rows list fiscal years (last 3 + TTM) with revenue and operating income for each segment; the final row shows the TTM revenue mix (operating income columns display “—” where mix is not applicable).
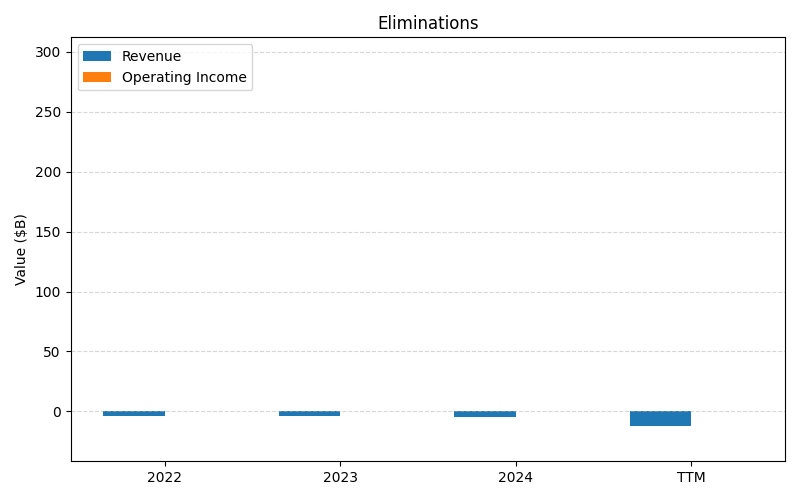
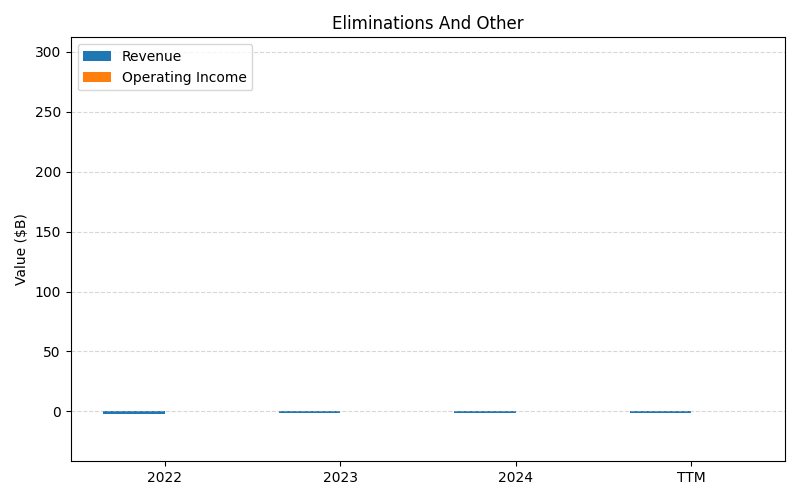
| Year | Entertainment Rev | Entertainment OI | Experiences Rev | Experiences OI | Sports Rev | Sports OI | Eliminations Rev | Eliminations OI | Eliminations And Other Rev | Eliminations And Other OI | Total Rev | Total OI |
|---|---|---|---|---|---|---|---|---|---|---|---|---|
| 2023 | 162.5B | 1.44B | 130.2B | 8.95B | 68.4B | 2.46B | -4.19B | – | -1.40B | – | 355.6B | 12.9B |
| 2024 | 164.7B | 3.92B | 136.6B | 9.27B | 70.5B | 2.41B | -4.79B | – | -1.59B | – | 365.4B | 15.6B |
| 2025 | 169.9B | 4.67B | 144.6B | 9.99B | 70.7B | 2.88B | -5.61B | – | -1.87B | – | 377.7B | 17.6B |
| TTM | 603.7B | 16.6B | 505.9B | 35.9B | 253.3B | 8.40B | -23.4B | 0.00B | – | – | 1339.6B | 60.9B |
| % of Total (TTM) | 45.1% | — | 37.8% | — | 18.9% | — | -1.7% | — | – | — | 100% | — |
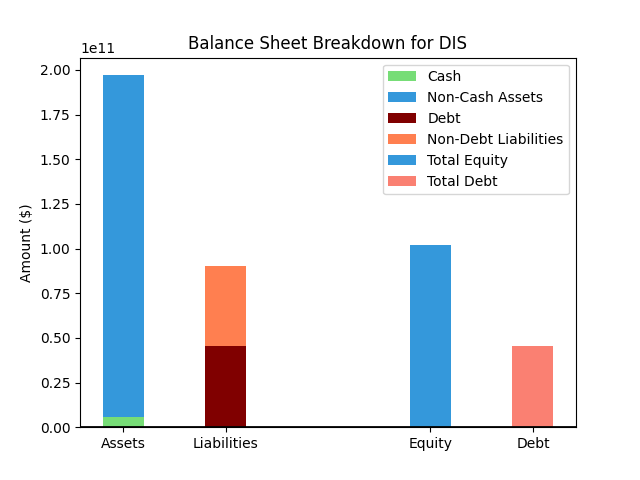
Balance Sheet
| Metric | Value | |
|---|---|---|
| 0 | Total Assets | $205,217M |
| 1 | Cash | $5,682M |
| 2 | Total Liabilities | $89,905M |
| 3 | Total Debt | $47,358M |
| 4 | Total Equity | $108,708M |
| 5 | Debt to Equity Ratio | 0.44 |
EPS & Dividend
Valuation
| Share Price | Treasury Yield | Estimates | Fair Value (P/E) | Fair Value (P/S) | Current P/S | Current P/E |
|---|---|---|---|---|---|---|
| $101.83 | 4.5% | Nicks Growth: 6% Nick's Expected Margin: 3% FINVIZ Growth: 12% |
Nicks: 12 Finviz: 21 |
Nick's: 0.350 | 1.8 | 16.3 |
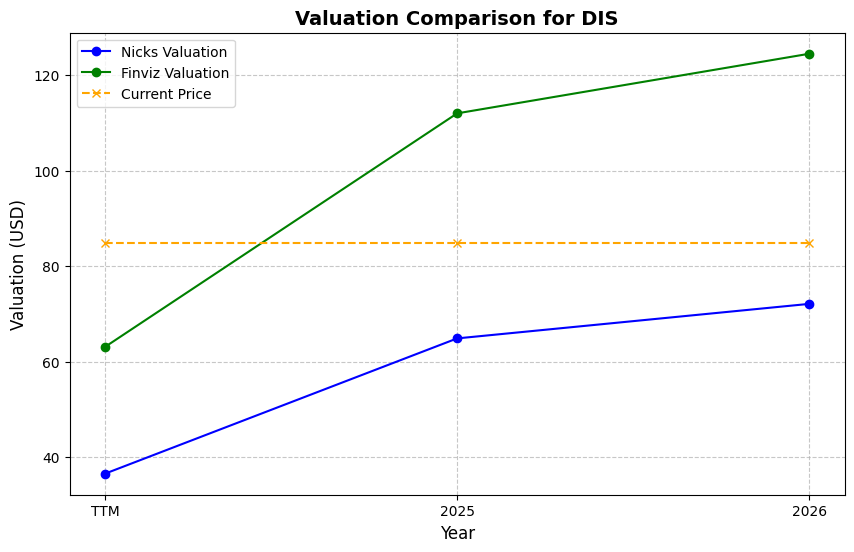
| Basis | Year | Nicks Valuation | Nicks vs Share Price | Finviz Valuation | Finviz vs Share Price |
|---|---|---|---|---|---|
| $6.25 EPS | TTM | $72.87 | -28.4% | $131.68 | 29.3% |
| $6.82 EPS | 2026 | $79.48 | -22.0% | $143.62 | 41.0% |
| $7.49 EPS | 2027 | $87.38 | -14.2% | $157.90 | 55.1% |
Implied Growth
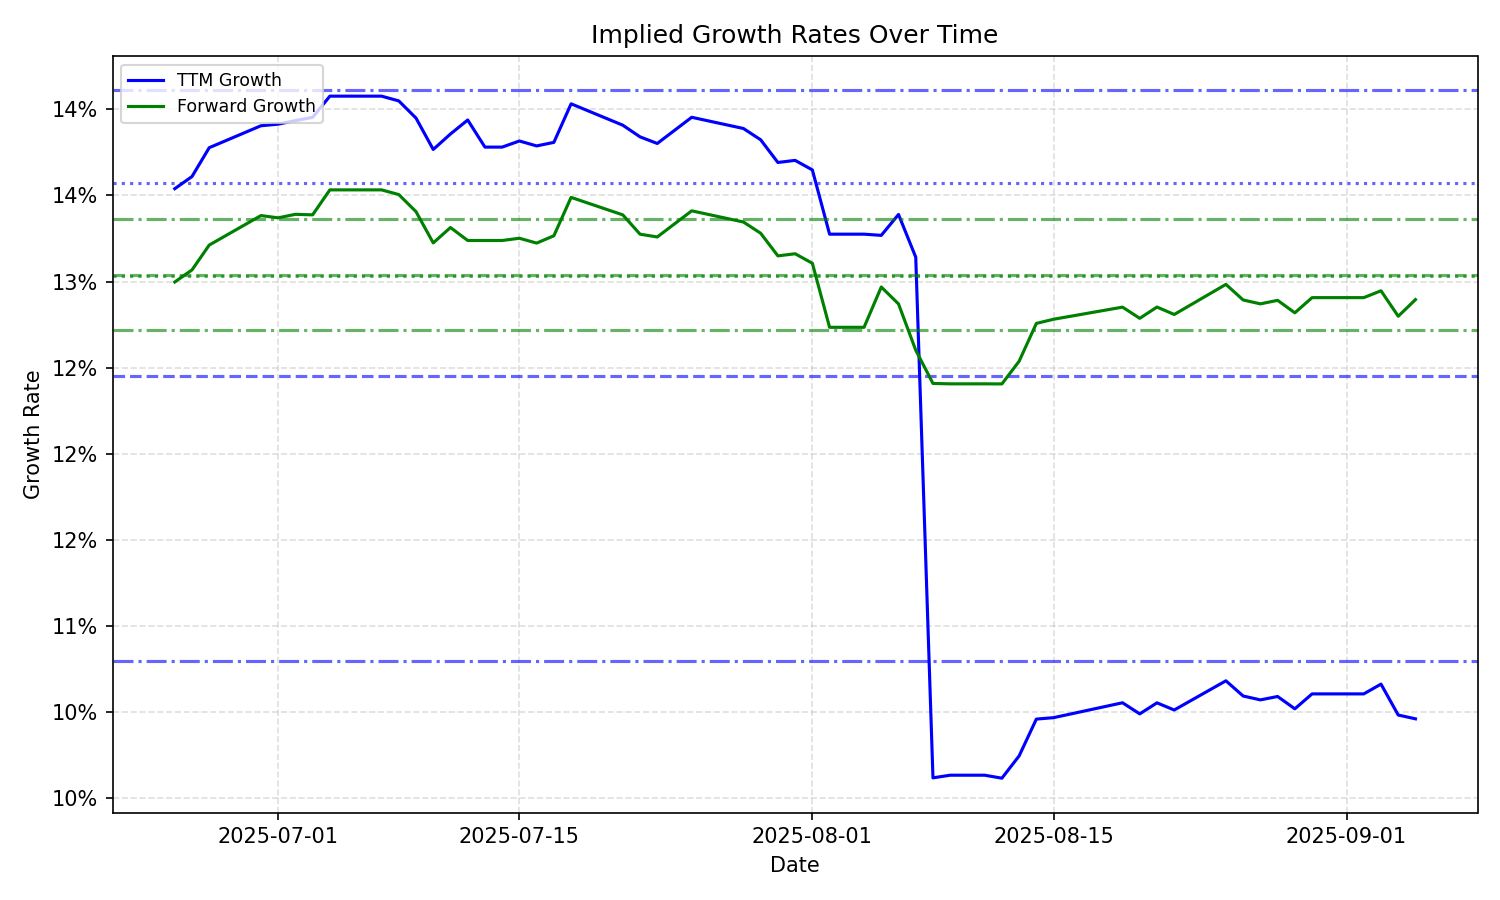
| Average | Median | Std Dev | Current | Percentile | ||||||
|---|---|---|---|---|---|---|---|---|---|---|
| TTM | Forward | TTM | Forward | TTM | Forward | TTM | Forward | TTM | Forward | |
| Timeframe | ||||||||||
| 1 Year | 10.65% | 11.82% | 10.08% | 12.37% | 1.80% | 1.67% | 9.65% | 7.76% | 24.0% | 1.3% |
| 3 Years | 10.65% | 11.82% | 10.08% | 12.37% | 1.80% | 1.67% | 9.65% | 7.76% | 24.0% | 1.3% |
| 5 Years | 10.65% | 11.82% | 10.08% | 12.37% | 1.80% | 1.67% | 9.65% | 7.76% | 24.0% | 1.3% |
| 10 Years | 10.65% | 11.82% | 10.08% | 12.37% | 1.80% | 1.67% | 9.65% | 7.76% | 24.0% | 1.3% |