Delta Air Lines, Inc. — DAL
| Close Price | Market Cap | P/E Ratio | Forward P/E Ratio | Implied Growth* | Implied Forward Growth* | Dividend | P/B Ratio |
|---|---|---|---|---|---|---|---|
| $82.48 | $54.19B | 12.0 | 10.2 | 6.3% | 4.7% | $0.75 0.9% | 2.6 |
Latest Headlines
- · Another airline cancels flights until August, refunds available
- · Delta Airlines Touts Amazon.com, Inc. (AMZN)’s in-Flight Wi-Fi Capabilities amid Starlink Tussle
- · 2 Warren Buffett-Inspired Fund Managers Disagree on Amazon Stock, and Why I’m Staying on the Sidelines Here
- · Delta (DAL) Stock Is Up, What You Need To Know
- · Stocks Settle Mixed on Conflicting US-Iran Signals
- · Greg Abel Is Trying to Break Berkshire Hathaway’s Losing Streak on Airlines with New Delta Stock Bet
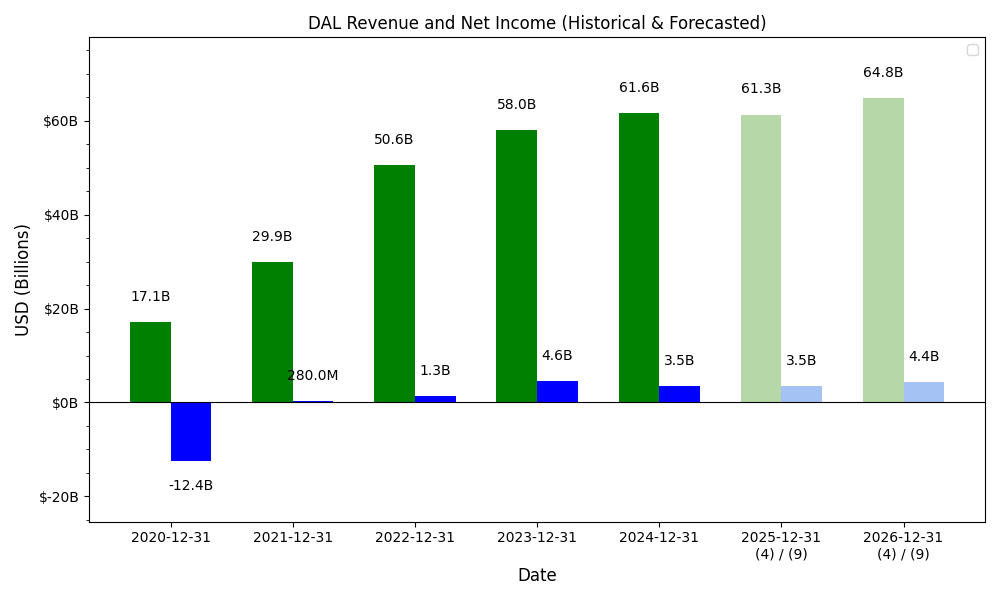
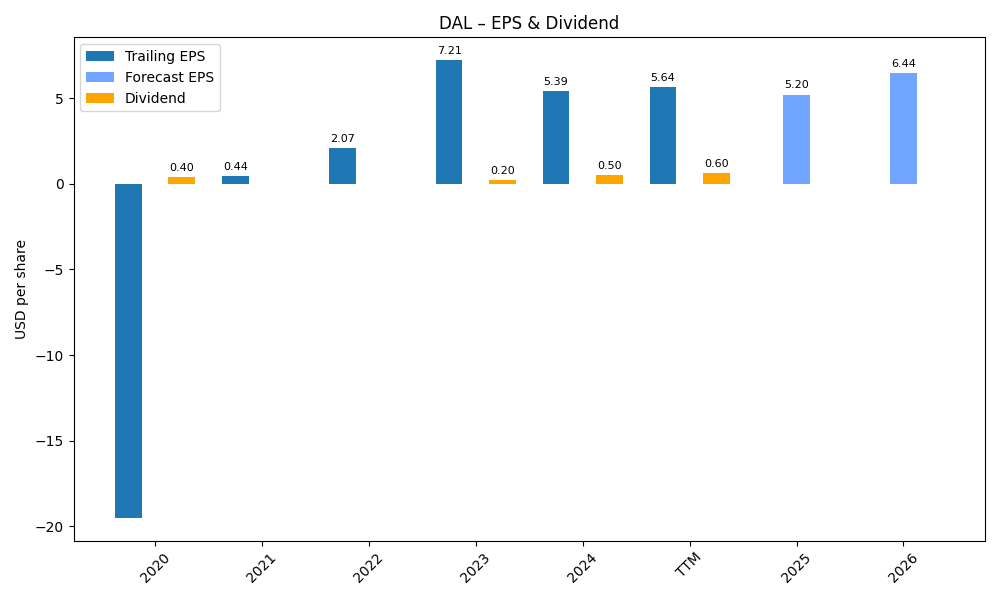
Revenue & Net Income
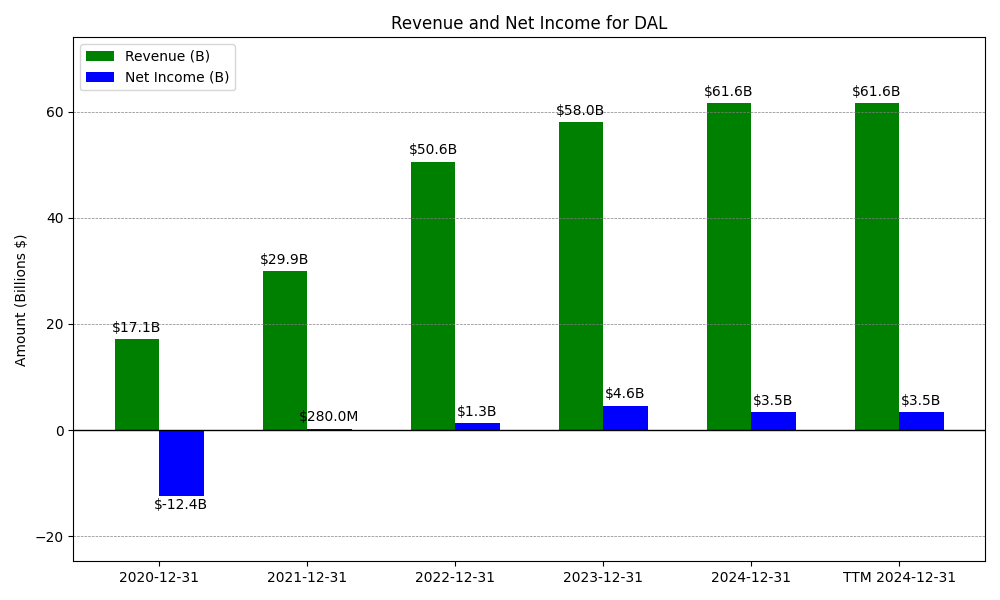
| Date | Revenue | Net_Income | EPS | Last_Updated | Revenue_Change | Net_Income_Change | EPS_Change | |
|---|---|---|---|---|---|---|---|---|
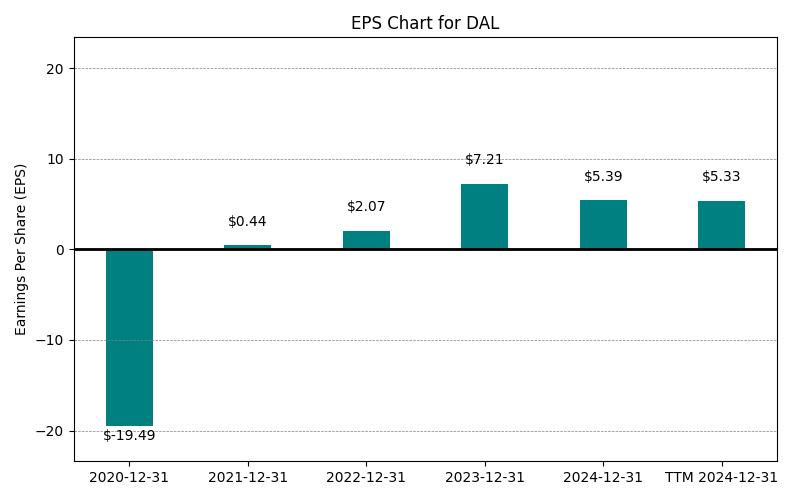
| 0 | 2020-12-31 | $17,095M | $-12,385M | $-19.49 | 2024-02-08 22:12:04 | N/A | N/A | N/A |
| 1 | 2021-12-31 | $29,899M | $280M | $0.44 | 2026-02-13 08:36:11 | 74.9% | -102.3% | -102.3% |
| 2 | 2022-12-31 | $50,582M | $1,318M | $2.07 | 2026-05-29 09:07:16 | 69.2% | 370.7% | 370.5% |
| 3 | 2023-12-31 | $58,048M | $4,609M | $7.21 | 2026-05-29 09:07:16 | 14.8% | 249.7% | 248.3% |
| 4 | 2024-12-31 | $61,643M | $3,457M | $5.39 | 2026-05-29 09:07:16 | 6.2% | -25.0% | -25.2% |
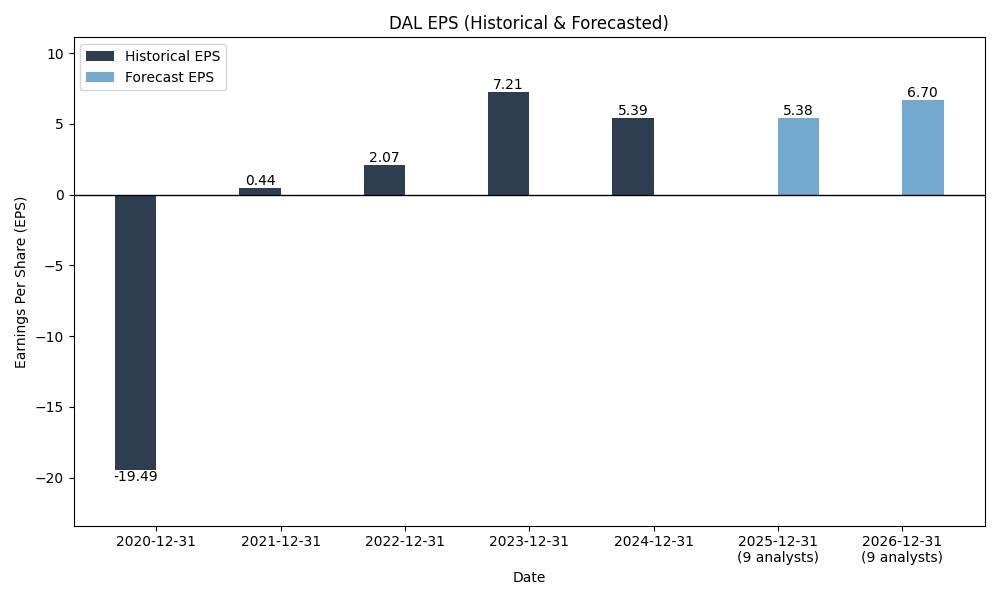
| 5 | 2025-12-31 | $63,364M | $5,005M | $7.72 | 2026-05-29 09:07:16 | 2.8% | 44.8% | 43.2% |
| 6 | TTM 2026-03-31 | $65,178M | $4,477M | $6.85 | 2026-04-13 08:42:25 | 2.9% | -10.5% | -11.3% |
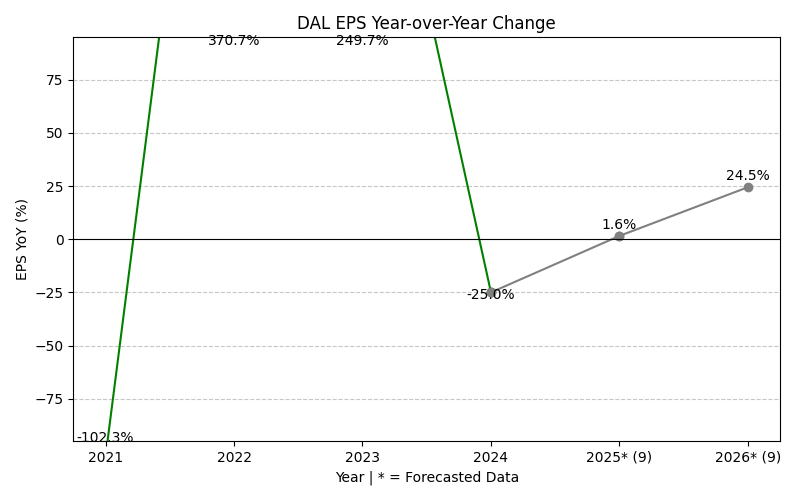
EPS
Forecasts
Y/Y % Change
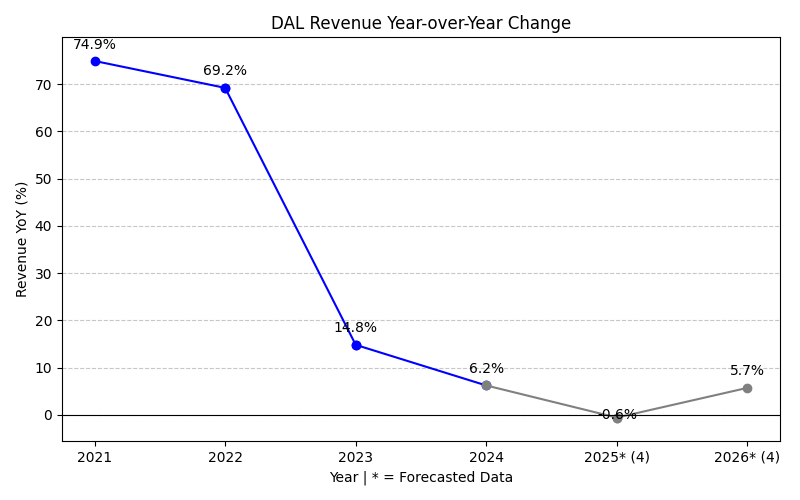
DAL Year-over-Year Growth
| 2020 | 2021 | 2022 | 2023 | 2024 | 2025 | 2026 | 2027 | Average | |
|---|---|---|---|---|---|---|---|---|---|
| Revenue Growth (%) | 74.9% | 69.2% | 14.8% | 6.2% | 2.8% | 11.1% | 2.7% | 26.0% | |
| Revenue Analysts (#) | 0 | 0 | 0 | 0 | 0 | 0 | 10 | 10 | |
| EPS Growth (%) | -102.3% | 370.7% | 249.7% | -25.0% | 44.8% | -27.1% | 44.2% | 79.3% | |
| EPS Analysts (#) | 0 | 0 | 0 | 0 | 0 | 0 | 22 | 8 |
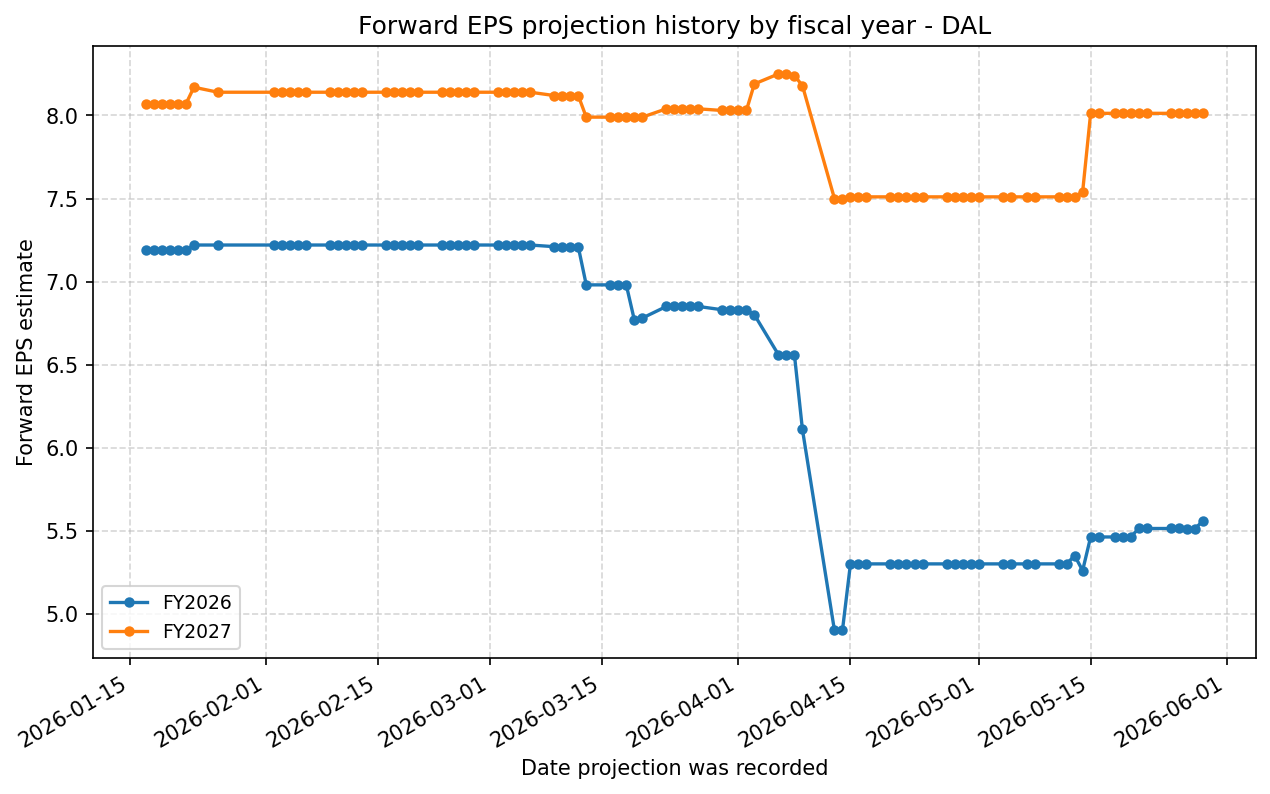
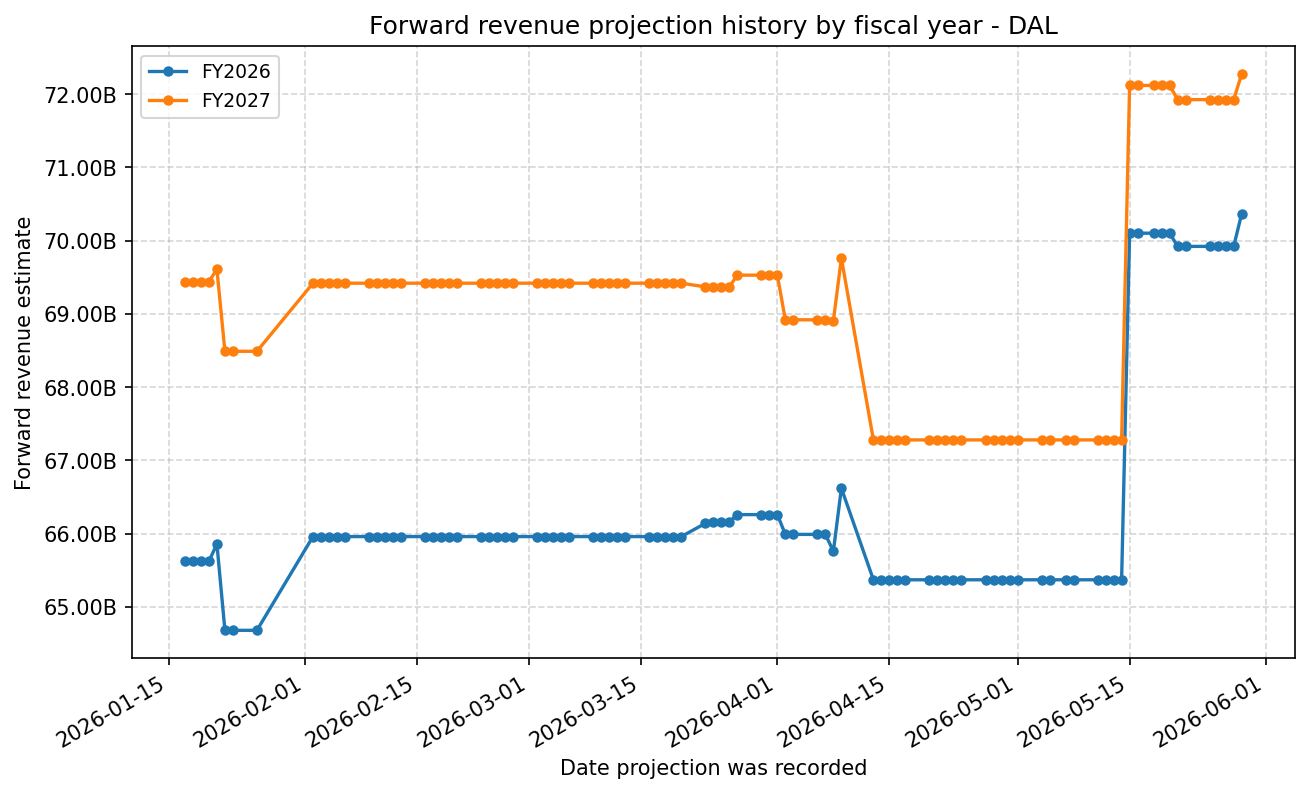
Forward Estimate History
How the next-FY EPS and revenue estimates have drifted over time. One line per fiscal year – past lines end when that FY became current.
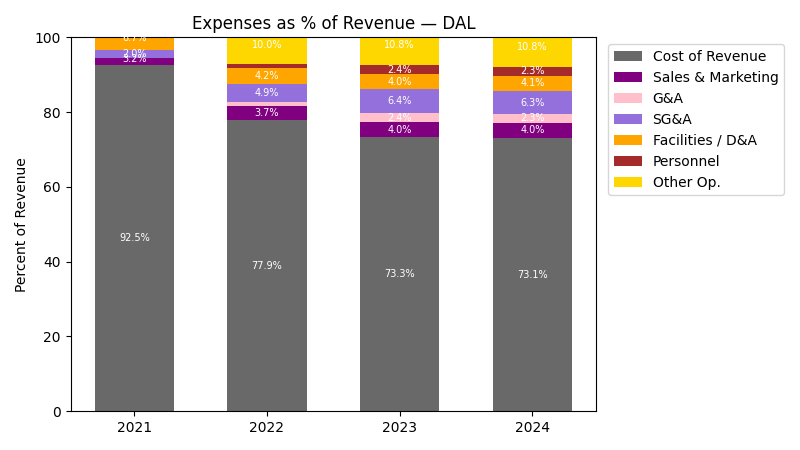
Expenses
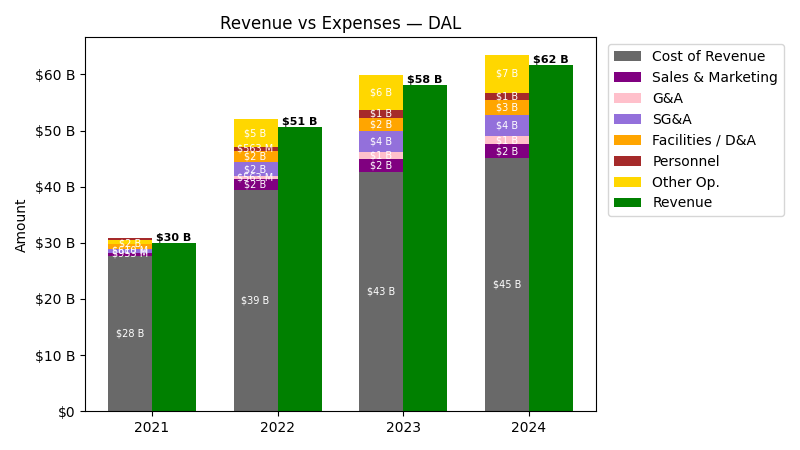
| Year | Revenue ($) | Cost of Revenue ($) | Sales & Marketing ($) | G&A ($) | SG&A ($) | Facilities / D&A ($) | Personnel ($) |
|---|---|---|---|---|---|---|---|
| 2022 | $50.6B | $37.9B | $1.9B | $-292.0M | $1.9B | $2.1B | $-292.0M |
| 2023 | $58.0B | $41.6B | $2.3B | $244.0M | $2.3B | $2.3B | $244.0M |
| 2024 | $61.6B | $44.0B | $2.5B | $1.4B | $2.5B | $2.5B | $1.4B |
| 2025 | $63.4B | $45.6B | $2.5B | $0.0 | $2.5B | $2.4B | $0.0 |
| TTM | $65.2B | $45.6B | $2.5B | $862.0M | $2.5B | $4.2B | $862.0M |
| Year | Revenue Change (%) | Cost of Revenue Change (%) | Sales & Marketing Change (%) | G&A Change (%) | SG&A Change (%) | Facilities / D&A Change (%) | Personnel Change (%) |
|---|---|---|---|---|---|---|---|
| 2023 | 14.76 | 9.75 | 23.43 | -183.56 | 23.43 | 11.11 | -183.56 |
| 2024 | 6.19 | 5.75 | 6.47 | 469.26 | 6.47 | 7.35 | 469.26 |
| 2025 | 2.79 | 3.75 | 0.00 | -100.00 | 0.00 | -2.79 | -100.00 |
| TTM | 2.86 | 0.05 | 1.57 | inf | 1.57 | 70.90 | inf |
No unmapped expenses.
Segment Performance
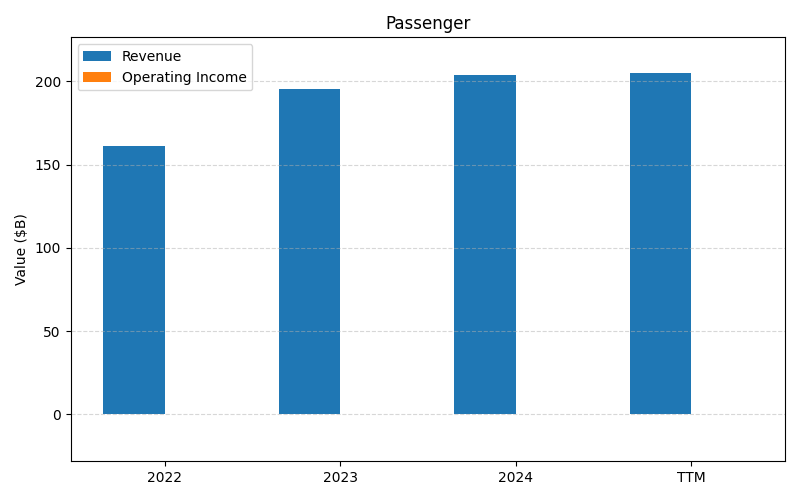
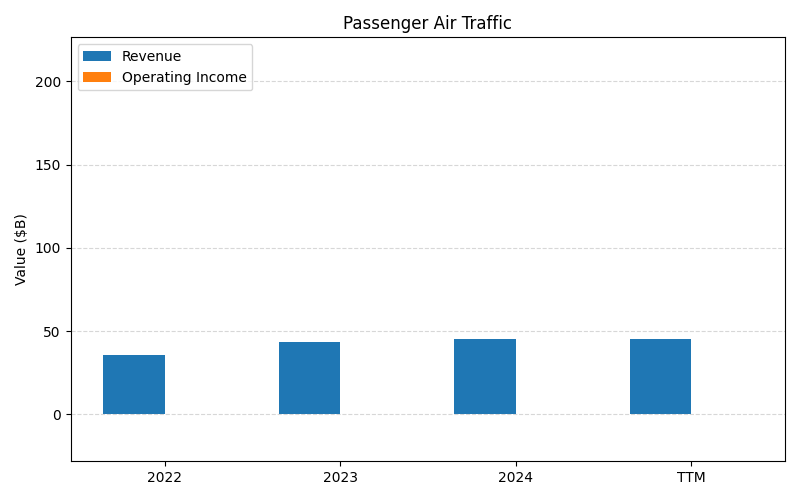
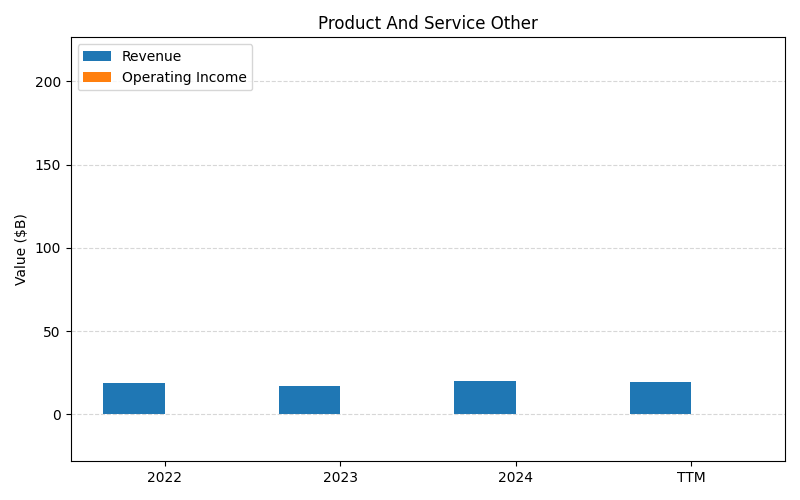
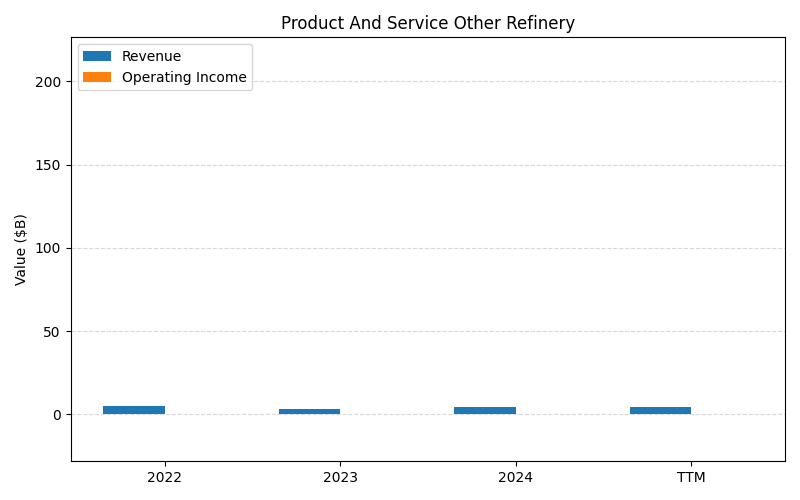
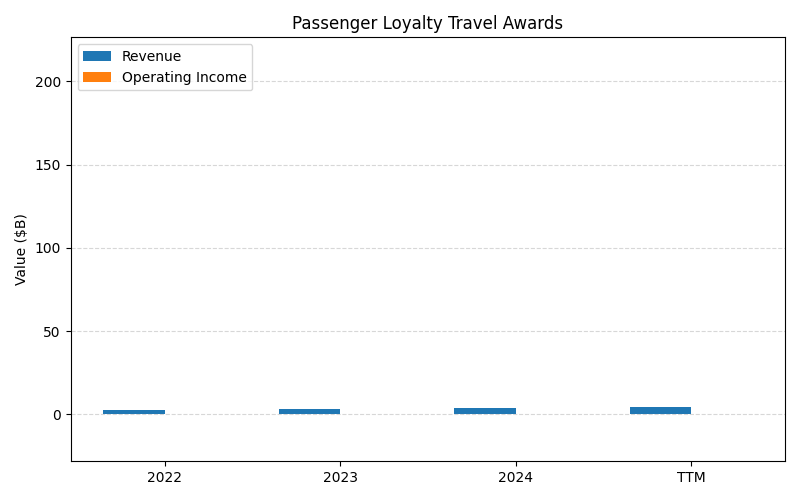
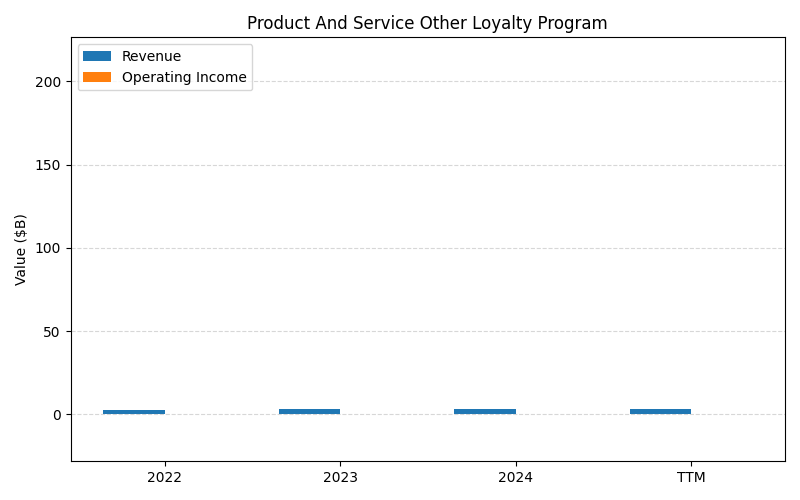
SEGMENTS v2025-09-09 · 2026-05-29 09:07 UTC — Units: $B. Rows list fiscal years (last 3 + TTM) with revenue for each segment; the final row shows the TTM revenue mix (operating income columns display “—” where mix is not applicable).
| Year | Passenger Rev | Passenger Air Traffic Rev | Product And Service Other Rev | Product And Service Other Refinery Rev | Passenger Loyalty Travel Awards Rev | Product And Service Other Loyalty Program Rev | Passenger Travel Related Services Rev | Product And Service Other Miscellaneous Rev | Product And Service Other Ancillary Businesses Rev | Cargo And Freight Rev | Sales To Airline Rev | Exchanged Products Rev | Product And Service Other M R O Business Rev | Sales Of Refined Products To Third Parties Rev | Total Rev |
|---|---|---|---|---|---|---|---|---|---|---|---|---|---|---|---|
| 2023 | 195.6B | 43.6B | 16.8B | 3.38B | 3.46B | 3.09B | 1.85B | 1.10B | 0.84B | 0.72B | -1.53B | -4.75B | – | -0.30B | 263.9B |
| 2024 | 203.6B | 45.1B | 19.9B | 4.64B | 3.84B | 3.30B | 1.96B | 1.22B | 0.77B | 0.82B | -1.42B | -2.97B | 0.66B | -0.23B | 281.1B |
| 2025 | 207.1B | 45.5B | 21.4B | 5.08B | 4.24B | 3.36B | 2.04B | 1.32B | 0.94B | 0.90B | -1.15B | -1.16B | 0.82B | -0.15B | 290.2B |
| TTM | 505.8B | 111.4B | 52.6B | 12.4B | 10B | 8.96B | 4.98B | 2.66B | 2.24B | 2.16B | -3.21B | – | – | – | 710.1B |
| % of Total (TTM) | 71.2% | 15.7% | 7.4% | 1.8% | 1.4% | 1.3% | 0.7% | 0.4% | 0.3% | 0.3% | -0.5% | – | – | – | 100% |
Segment Performance (Axis 2)
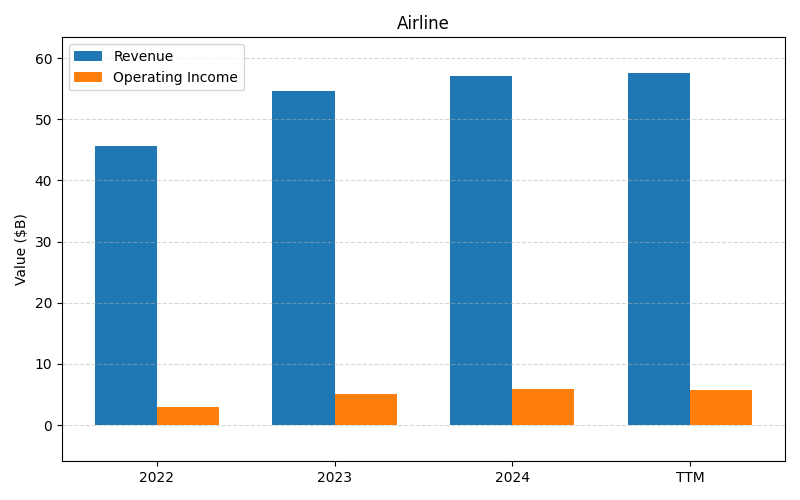
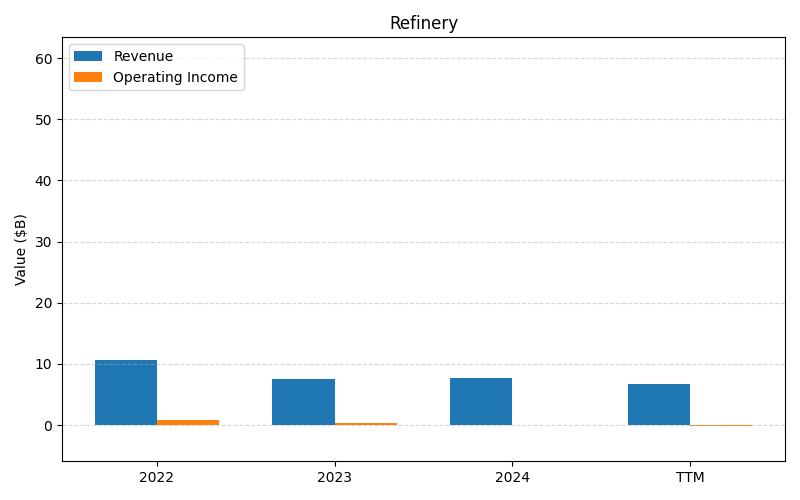
SEGMENTS v2025-09-09 · 2026-05-29 09:07 UTC — Units: $B. Rows list fiscal years (last 3 + TTM) with revenue and operating income for each segment; the final row shows the TTM revenue mix (operating income columns display “—” where mix is not applicable).
| Year | Airline Rev | Airline OI | Refinery Rev | Refinery OI | Total Rev | Total OI |
|---|---|---|---|---|---|---|
| 2023 | 54.7B | 5.14B | 7.57B | 0.39B | 62.2B | 5.52B |
| 2024 | 57B | 5.96B | 7.77B | 0.04B | 64.8B | 6.00B |
| 2025 | 58.3B | 5.67B | 6.96B | 0.16B | 65.2B | 5.82B |
| TTM | 142.5B | 12.7B | 18.5B | 0.15B | 160.9B | 12.9B |
| % of Total (TTM) | 88.5% | — | 11.5% | — | 100% | — |
Balance Sheet
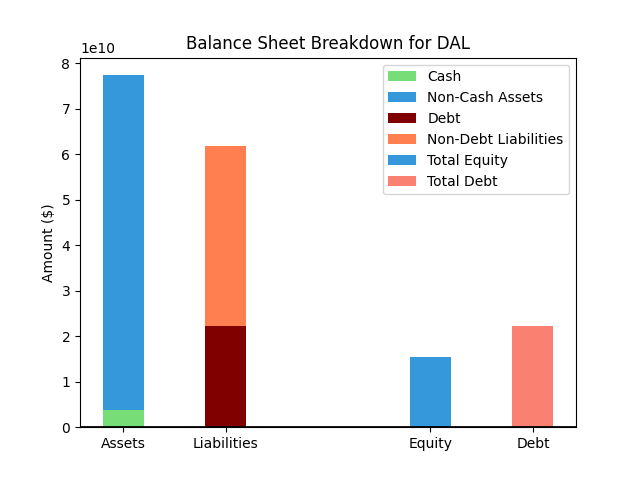
| Metric | Value | |
|---|---|---|
| 0 | Total Assets | $84,431M |
| 1 | Cash | $5,053M |
| 2 | Total Liabilities | $64,055M |
| 3 | Total Debt | $20,299M |
| 4 | Total Equity | $20,376M |
| 5 | Debt to Equity Ratio | 1.00 |
EPS & Dividend
Valuation
| Share Price | Treasury Yield | Estimates | Fair Value (P/E) | Fair Value (P/S) | Current P/S | Current P/E |
|---|---|---|---|---|---|---|
| $82.48 | 4.5% | Nicks Growth: 3% Nick's Expected Margin: 8% FINVIZ Growth: 17% |
Nicks: 9 Finviz: 33 |
Nick's: 0.691 | 0.8 | 12.0 |
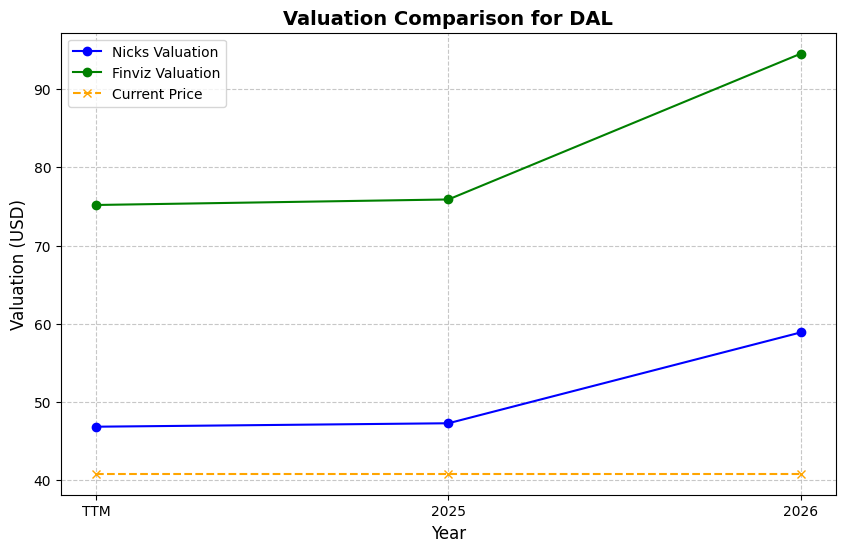
| Basis | Year | Nicks Valuation | Nicks vs Share Price | Finviz Valuation | Finviz vs Share Price |
|---|---|---|---|---|---|
| $6.85 EPS | TTM | $59.17 | -28.3% | $223.57 | 171.1% |
| $5.56 EPS | 2026 | $48.00 | -41.8% | $181.37 | 119.9% |
| $8.01 EPS | 2027 | $69.22 | -16.1% | $261.53 | 217.1% |
Implied Growth
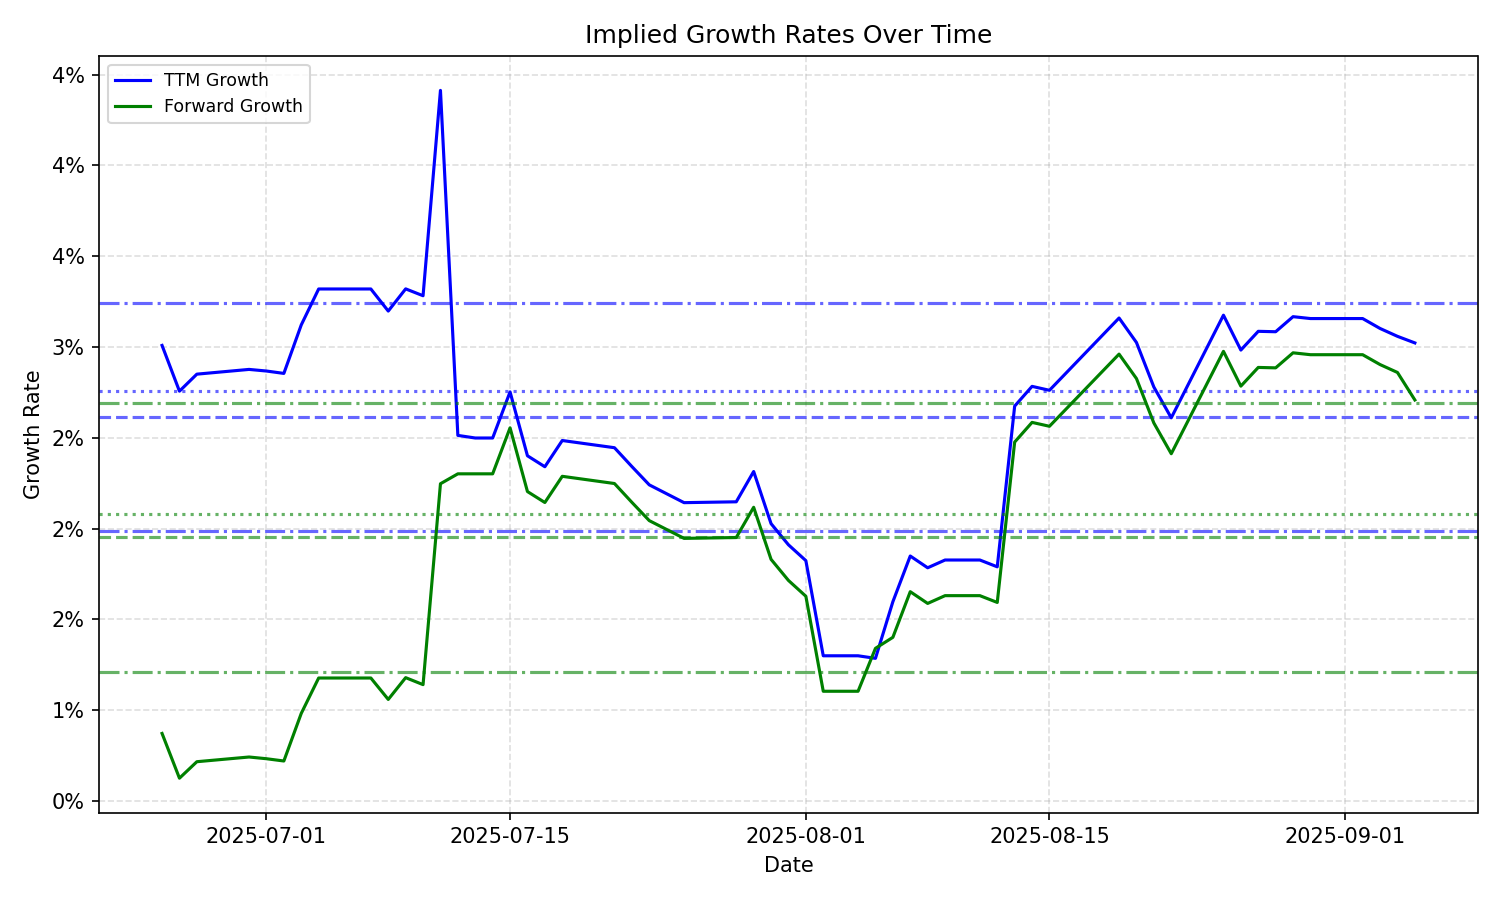
| Average | Median | Std Dev | Current | Percentile | ||||||
|---|---|---|---|---|---|---|---|---|---|---|
| TTM | Forward | TTM | Forward | TTM | Forward | TTM | Forward | TTM | Forward | |
| Timeframe | ||||||||||
| 1 Year | 3.07% | 2.49% | 2.92% | 2.41% | 0.99% | 0.82% | 6.33% | 4.69% | 100.0% | 100.0% |
| 3 Years | 3.07% | 2.49% | 2.92% | 2.41% | 0.99% | 0.82% | 6.33% | 4.69% | 100.0% | 100.0% |
| 5 Years | 3.07% | 2.49% | 2.92% | 2.41% | 0.99% | 0.82% | 6.33% | 4.69% | 100.0% | 100.0% |
| 10 Years | 3.07% | 2.49% | 2.92% | 2.41% | 0.99% | 0.82% | 6.33% | 4.69% | 100.0% | 100.0% |