Citigroup, Inc. — C
| Close Price | Market Cap | P/E Ratio | Forward P/E Ratio | Implied Growth* | Implied Forward Growth* | Dividend | P/B Ratio |
|---|---|---|---|---|---|---|---|
| $125.90 | $214.73B | 15.6 | 10.0 | 9.0% | 4.5% | $2.40 1.9% | 1.1 |
Latest Headlines
- · Citi, JPM Reportedly In Talks To Join OpenAI IPO Bank Lineup
- · 3 Aerospace Stocks Ready to Ride the Aftermarket Rebound
- · SpaceX Said to Cut IPO Value Goal to at Least $1.8 Trillion
- · GSK hepatitis B drug a long-term opportunity but US bank holds back from upgrading
- · Citi Bank Sends Strong Message on Big Tech Stocks
- · The Zacks Analyst Blog Highlights Citigroup, TotalEnergies, AppLovin, The Eastern and Acorn Energy
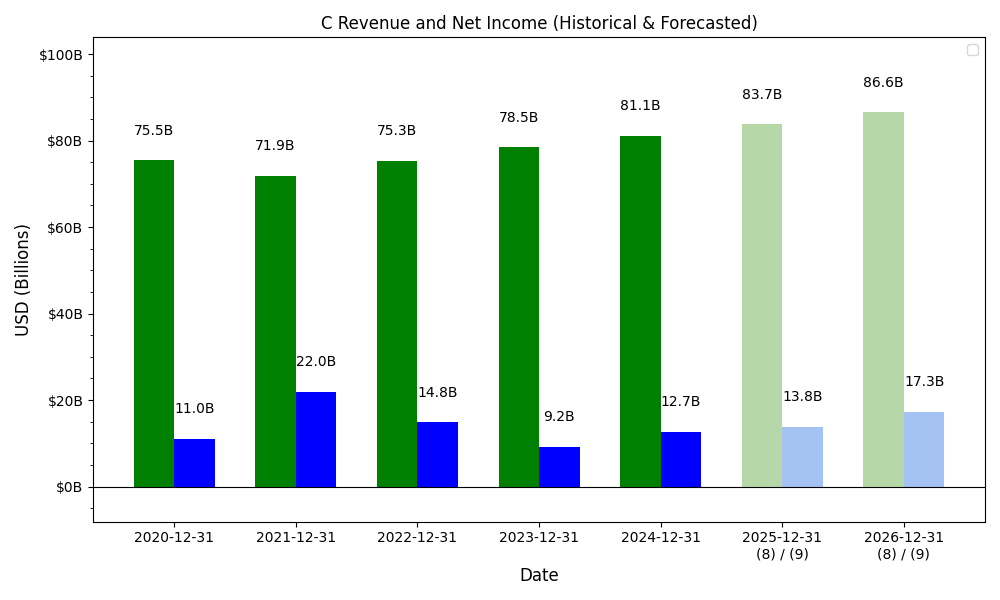
Revenue & Net Income
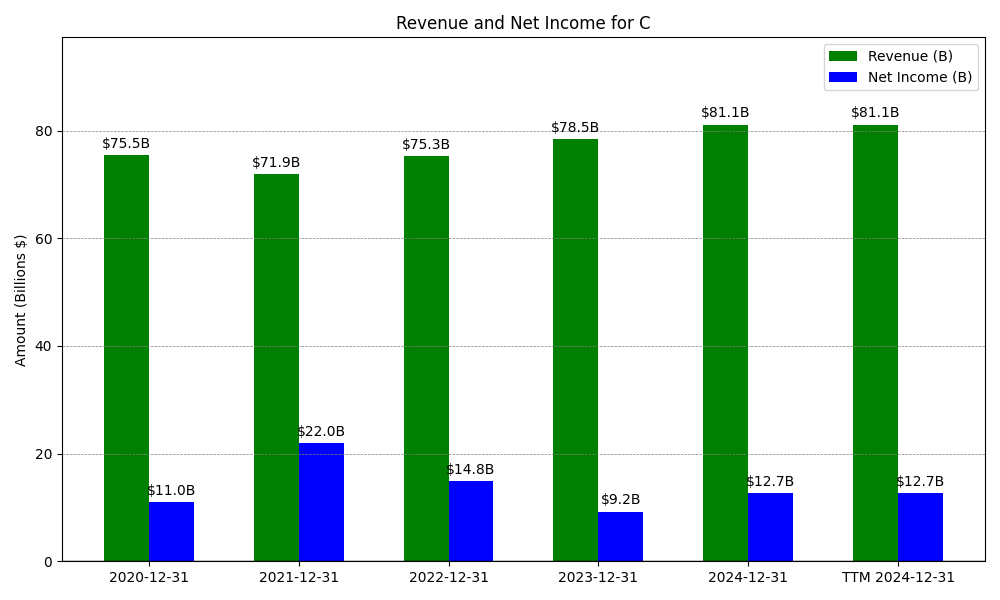
| Date | Revenue | Net_Income | EPS | Last_Updated | Revenue_Change | Net_Income_Change | EPS_Change | |
|---|---|---|---|---|---|---|---|---|
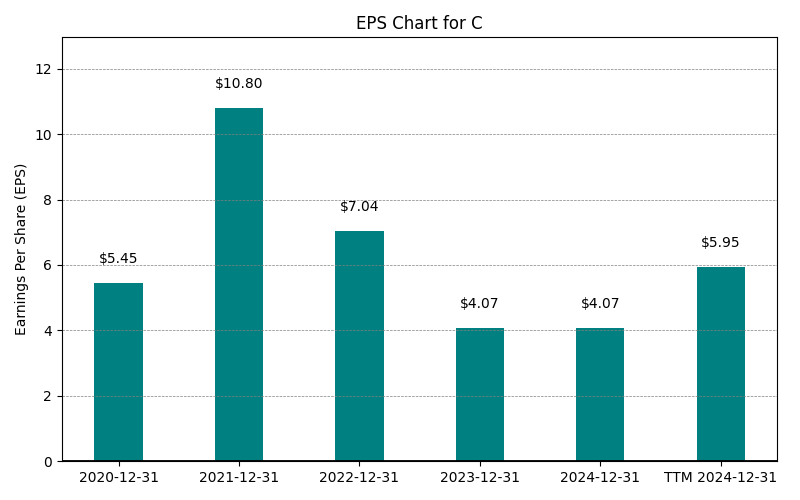
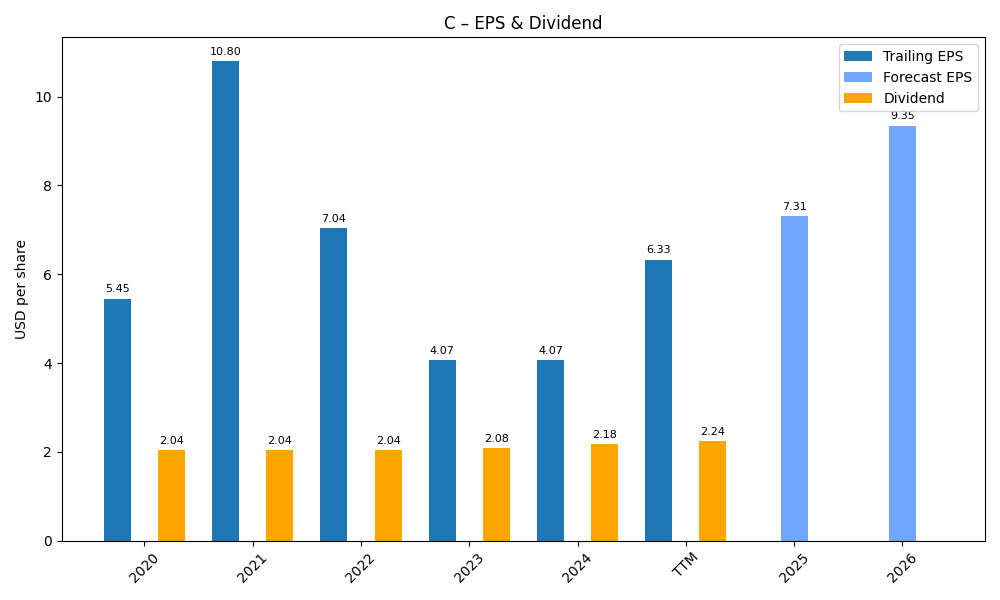
| 0 | 2020-12-31 | $75,494M | $11,047M | $5.45 | 2024-02-09 04:06:54 | N/A | N/A | N/A |
| 1 | 2021-12-31 | $71,887M | $21,952M | $7.04 | 2026-03-02 08:36:10 | -4.8% | 98.7% | 29.1% |
| 2 | 2022-12-31 | $74,480M | $14,845M | $7.04 | 2026-05-29 09:06:03 | 3.6% | -32.4% | 0.0% |
| 3 | 2023-12-31 | $78,090M | $9,228M | $4.07 | 2026-05-29 09:06:03 | 4.8% | -37.8% | -42.2% |
| 4 | 2024-12-31 | $80,672M | $12,682M | $6.03 | 2026-05-29 09:06:03 | 3.3% | 37.4% | 48.2% |
| 5 | 2025-12-31 | $85,213M | $14,306M | $7.11 | 2026-05-29 09:06:03 | 5.6% | 12.8% | 18.0% |
| 6 | TTM 2026-03-31 | $88,089M | $16,027M | $8.09 | 2026-04-16 08:33:39 | 3.4% | 12.0% | 13.8% |
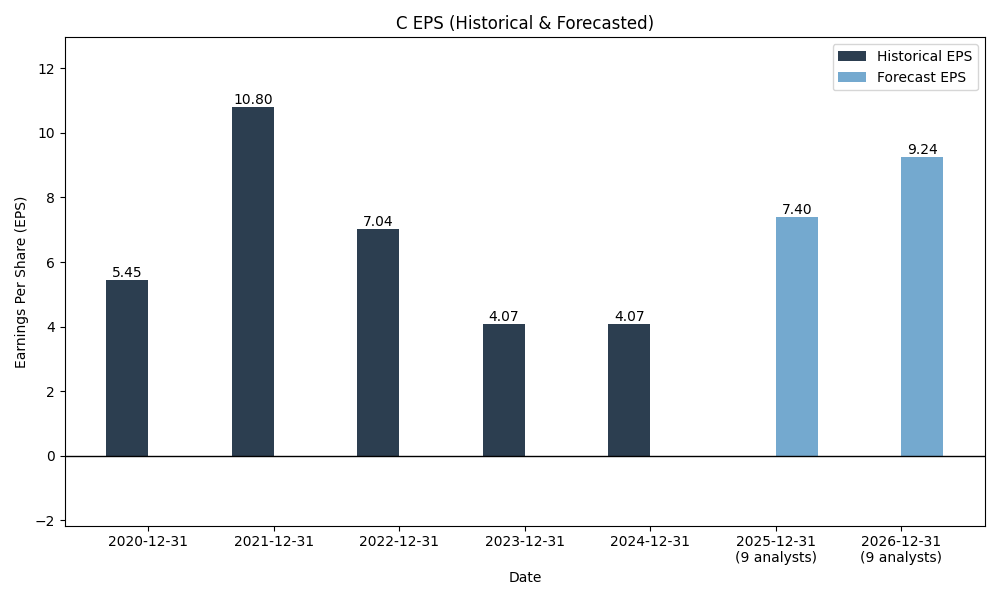
EPS
Forecasts
Y/Y % Change
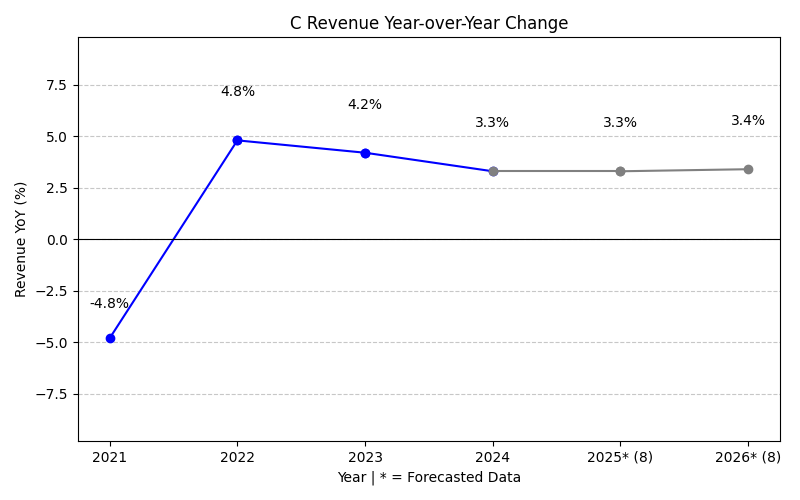
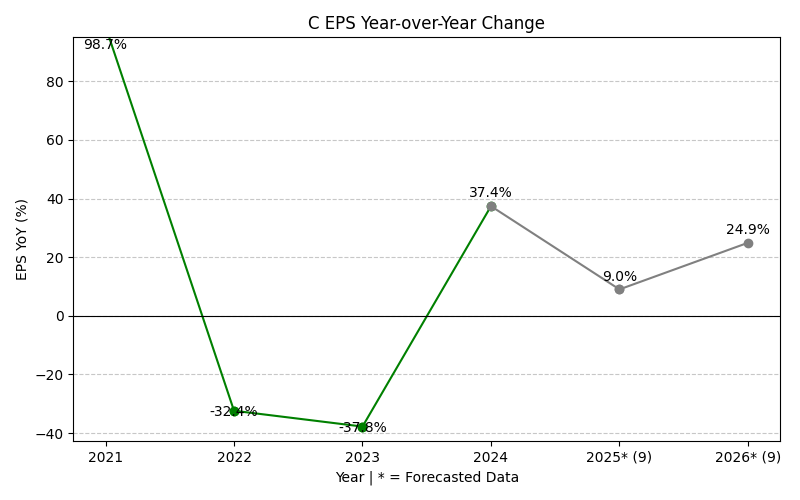
C Year-over-Year Growth
| 2020 | 2021 | 2022 | 2023 | 2024 | 2025 | 2026 | 2027 | Average | |
|---|---|---|---|---|---|---|---|---|---|
| Revenue Growth (%) | -4.8% | 3.6% | 4.8% | 3.3% | 5.6% | 9.7% | 3.6% | 3.7% | |
| Revenue Analysts (#) | 0 | 0 | 0 | 0 | 0 | 0 | 17 | 17 | |
| EPS Growth (%) | 98.7% | -32.4% | -37.8% | 37.4% | 12.8% | 29.3% | 15.5% | 17.6% | |
| EPS Analysts (#) | 0 | 0 | 0 | 0 | 0 | 0 | 13 | 13 |
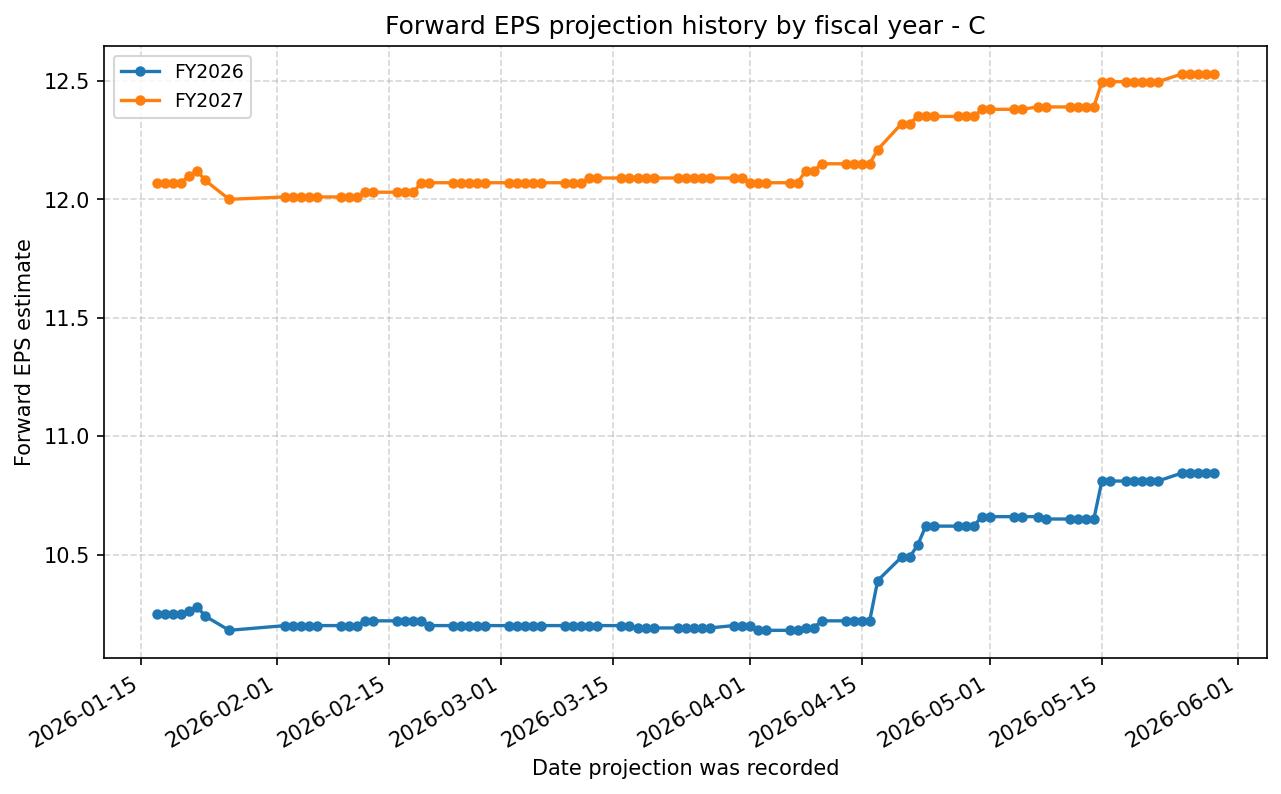
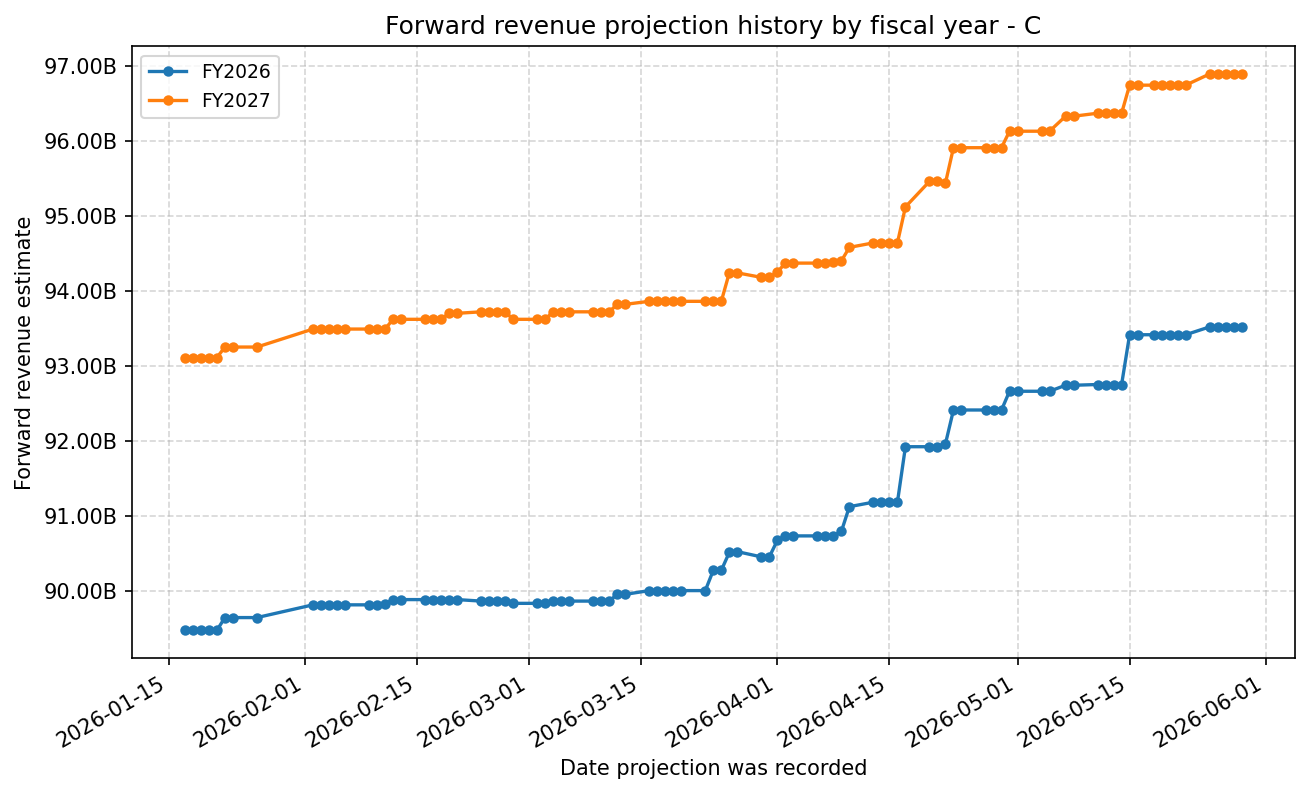
Forward Estimate History
How the next-FY EPS and revenue estimates have drifted over time. One line per fiscal year – past lines end when that FY became current.
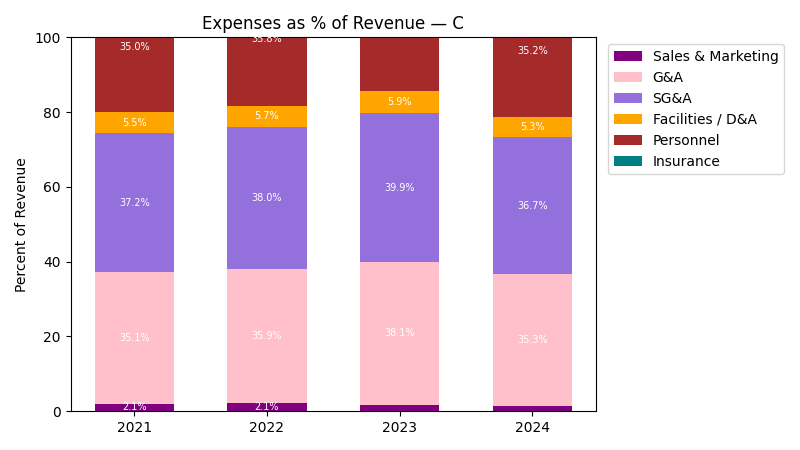
Expenses
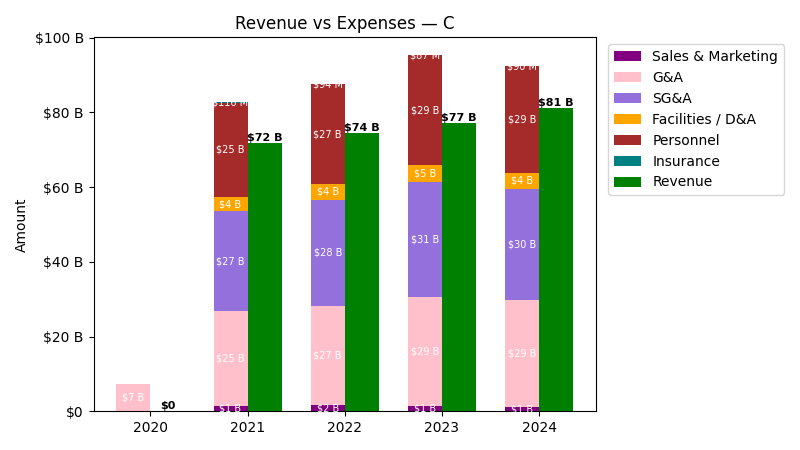
| Year | Revenue ($) | Sales & Marketing ($) | G&A ($) | SG&A ($) | Facilities / D&A ($) | Personnel ($) | Insurance / Claims ($) |
|---|---|---|---|---|---|---|---|
| 2021 | $71.9B | $1.5B | $25.2B | $26.7B | $4.0B | $25.1B | $116.0M |
| 2022 | $74.5B | $1.6B | $26.7B | $28.3B | $4.3B | $26.7B | $94.0M |
| 2023 | $78.1B | $1.4B | $29.3B | $30.7B | $4.6B | $29.2B | $87.0M |
| 2024 | $80.7B | $1.1B | $28.6B | $29.7B | $4.3B | $28.5B | $90.0M |
| 2025 | $85.2B | $1.1B | $29.7B | $30.8B | $4.4B | $29.6B | $87.0M |
| TTM | $88.1B | $1.1B | $30.6B | $31.7B | $4.4B | $30.6B | $80.0M |
| Year | Revenue Change (%) | Sales & Marketing Change (%) | G&A Change (%) | SG&A Change (%) | Facilities / D&A Change (%) | Personnel Change (%) | Insurance / Claims Change (%) |
|---|---|---|---|---|---|---|---|
| 2022 | 3.61 | 4.43 | 5.94 | 5.85 | 7.52 | 6.05 | -18.97 |
| 2023 | 4.85 | -10.48 | 9.61 | 8.50 | 6.99 | 9.67 | -7.45 |
| 2024 | 3.31 | -20.10 | -2.34 | -3.15 | -5.46 | -2.36 | 3.45 |
| 2025 | 5.63 | -1.44 | 3.82 | 3.62 | 1.44 | 3.84 | -3.33 |
| TTM | 3.38 | -1.55 | 3.06 | 2.90 | 1.49 | 3.10 | -8.05 |
No unmapped expenses.
Segment Performance
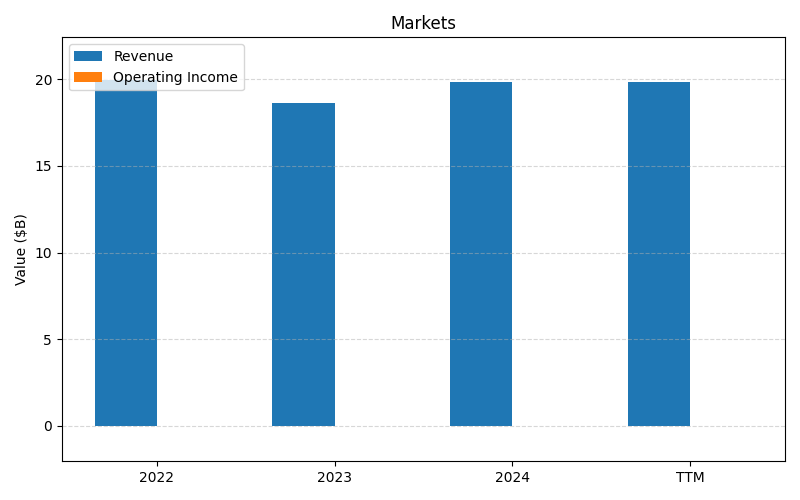
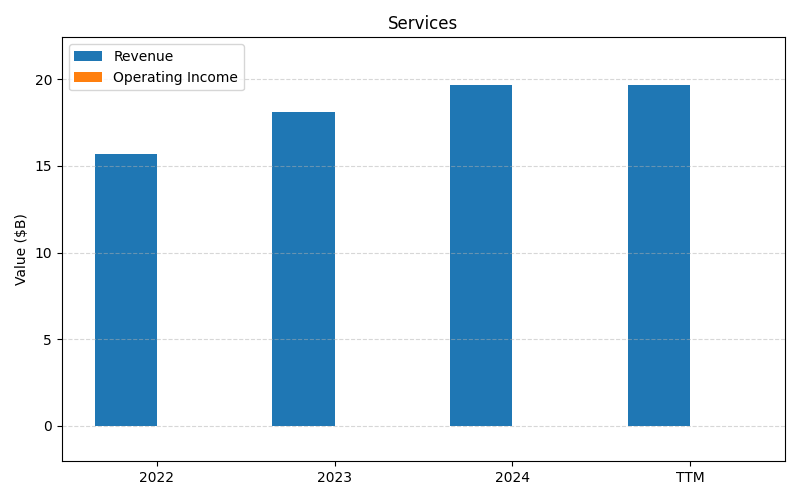
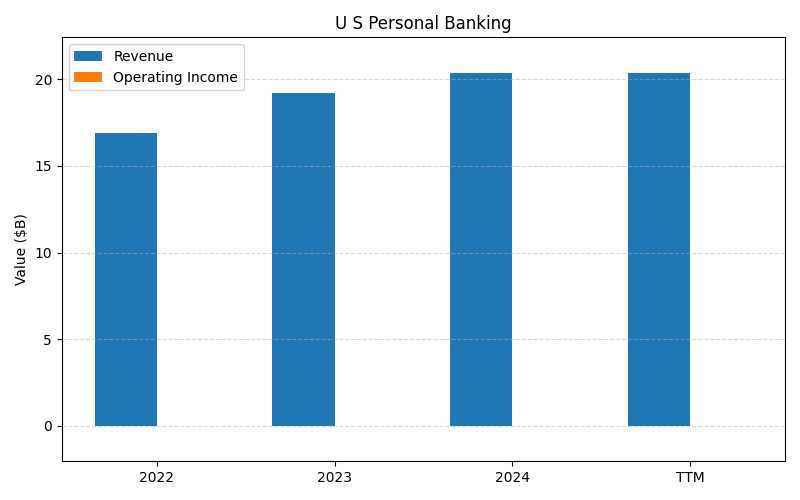
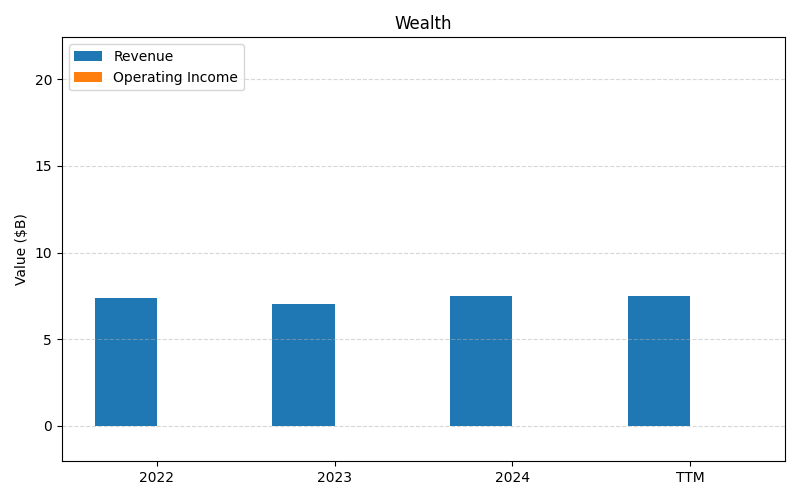
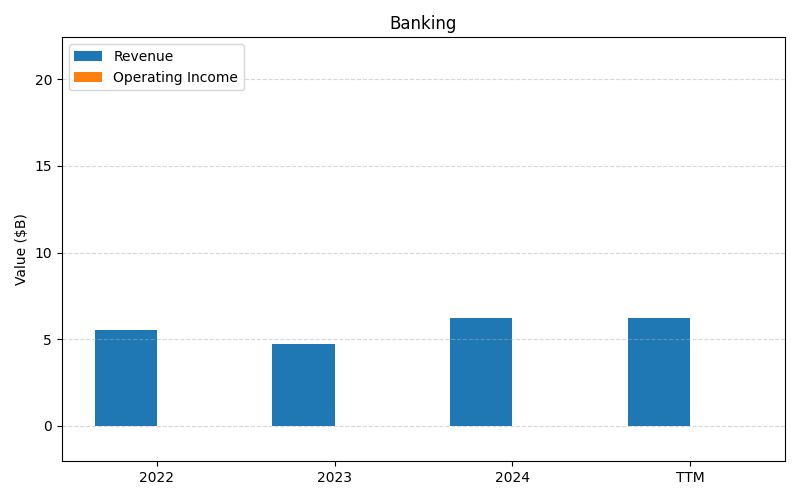
SEGMENTS v2025-09-09 · 2026-05-29 09:06 UTC — Units: $B. Rows list fiscal years (last 3 + TTM) with revenue for each segment; the final row shows the TTM revenue mix (operating income columns display “—” where mix is not applicable).
| Year | Markets Rev | Services Rev | U S Personal Banking Rev | Wealth Rev | Banking Rev | Total Rev |
|---|---|---|---|---|---|---|
| 2023 | 18.6B | 18.1B | 18.9B | 7.00B | 4.71B | 67.3B |
| 2024 | 19.8B | 19.6B | 20.1B | 7.48B | 6.20B | 73.2B |
| 2025 | 22B | 21.3B | 21B | 8.56B | 8.21B | 81B |
Balance Sheet
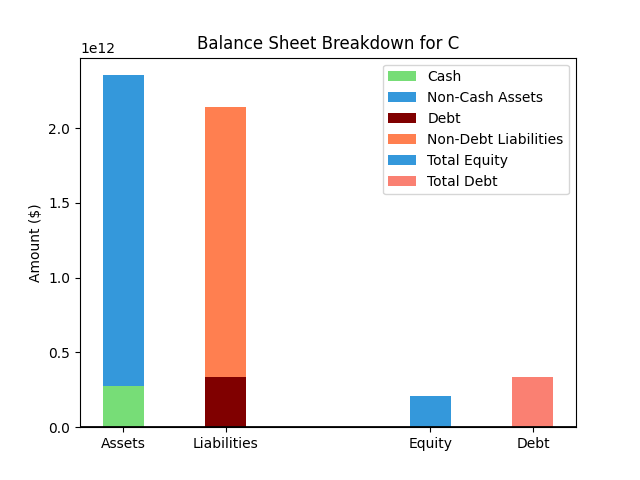
| Metric | Value | |
|---|---|---|
| 0 | Total Assets | $2,777,687M |
| 1 | Cash | $385,722M |
| 2 | Total Liabilities | $2,565,115M |
| 3 | Total Debt | $379,622M |
| 4 | Total Equity | $210,959M |
| 5 | Debt to Equity Ratio | 1.80 |
EPS & Dividend
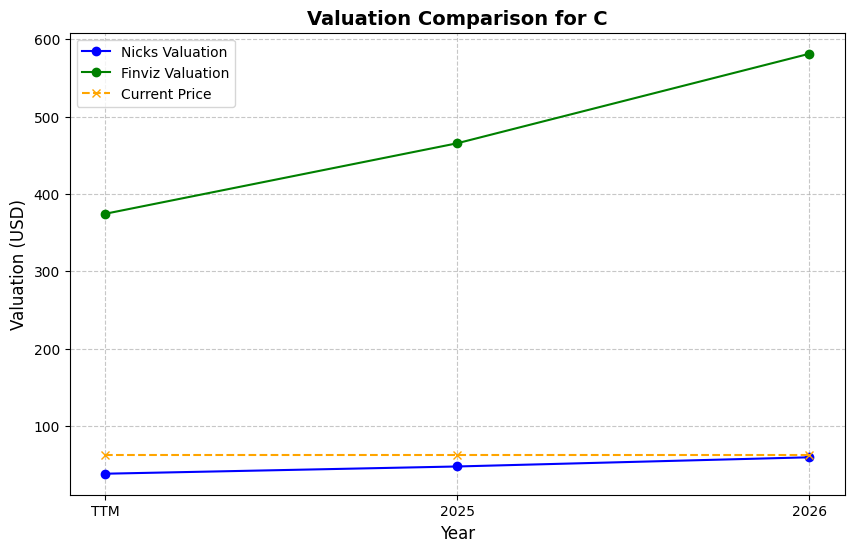
Valuation
| Share Price | Treasury Yield | Estimates | Fair Value (P/E) | Fair Value (P/S) | Current P/S | Current P/E |
|---|---|---|---|---|---|---|
| $125.90 | 4.5% | Nicks Growth: 0% Nick's Expected Margin: 20% FINVIZ Growth: 28% |
Nicks: 6 Finviz: 81 |
Nick's: 1.268 | 2.4 | 15.6 |
| Basis | Year | Nicks Valuation | Nicks vs Share Price | Finviz Valuation | Finviz vs Share Price |
|---|---|---|---|---|---|
| $8.09 EPS | TTM | $51.30 | -59.3% | $658.46 | 423.0% |
| $10.84 EPS | 2026 | $68.76 | -45.4% | $882.63 | 601.1% |
| $12.53 EPS | 2027 | $79.45 | -36.9% | $1019.78 | 710.0% |
Implied Growth
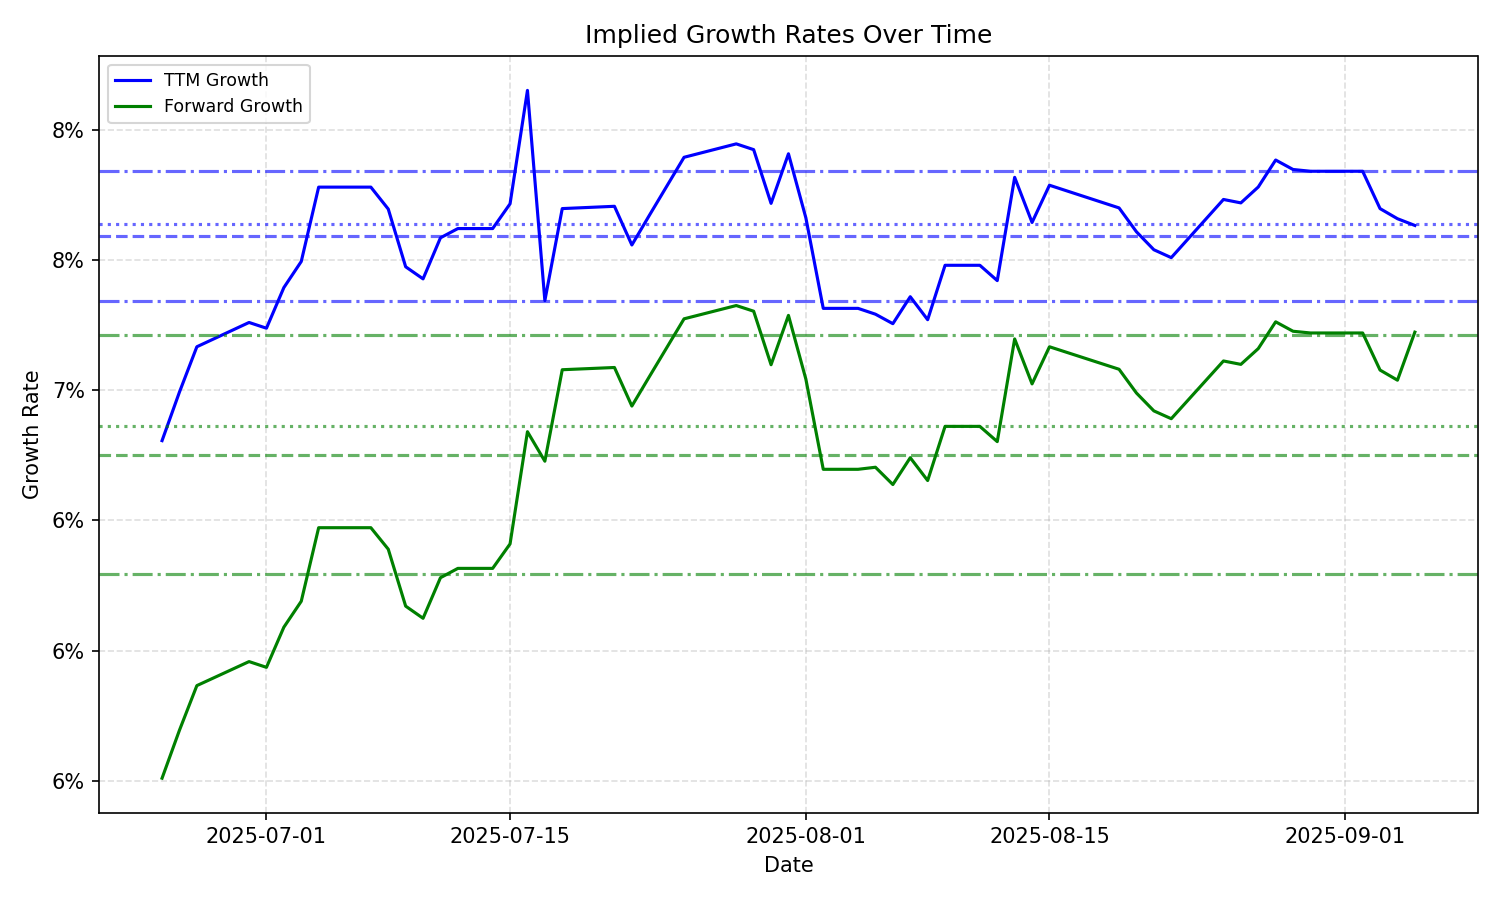
| Average | Median | Std Dev | Current | Percentile | ||||||
|---|---|---|---|---|---|---|---|---|---|---|
| TTM | Forward | TTM | Forward | TTM | Forward | TTM | Forward | TTM | Forward | |
| Timeframe | ||||||||||
| 1 Year | 8.37% | 5.85% | 8.37% | 6.32% | 0.83% | 1.60% | 8.88% | 4.41% | 66.4% | 22.4% |
| 3 Years | 8.37% | 5.85% | 8.37% | 6.32% | 0.83% | 1.60% | 8.88% | 4.41% | 66.4% | 22.4% |
| 5 Years | 8.37% | 5.85% | 8.37% | 6.32% | 0.83% | 1.60% | 8.88% | 4.41% | 66.4% | 22.4% |
| 10 Years | 8.37% | 5.85% | 8.37% | 6.32% | 0.83% | 1.60% | 8.88% | 4.41% | 66.4% | 22.4% |