Chevron Corporation — CVX
| Close Price | Market Cap | P/E Ratio | Forward P/E Ratio | Implied Growth* | Implied Forward Growth* | Dividend | P/B Ratio |
|---|---|---|---|---|---|---|---|
| $182.46 | $363.39B | 31.7 | 14.7 | 16.7% | 8.4% | $7.12 3.9% | 2.0 |
Latest Headlines
- · Sector Update: Energy Stocks Fall Late Afternoon
- · Three Energy ETFs Are Yielding Over 2.5 Percent While Delivering 24 to 31 Percent Returns in 2026
- · Oil Sinks to 6-Week Low as Traders Bet on Possible US-Iran Truce
- · Why Occidental Petroleum Is a Buy Despite Falling Oil Prices
- · Sector Update: Energy Stocks Retreat Friday Afternoon
- · Ships Attacked in Strait of Hormuz This Week, Chevron Says
Revenue & Net Income
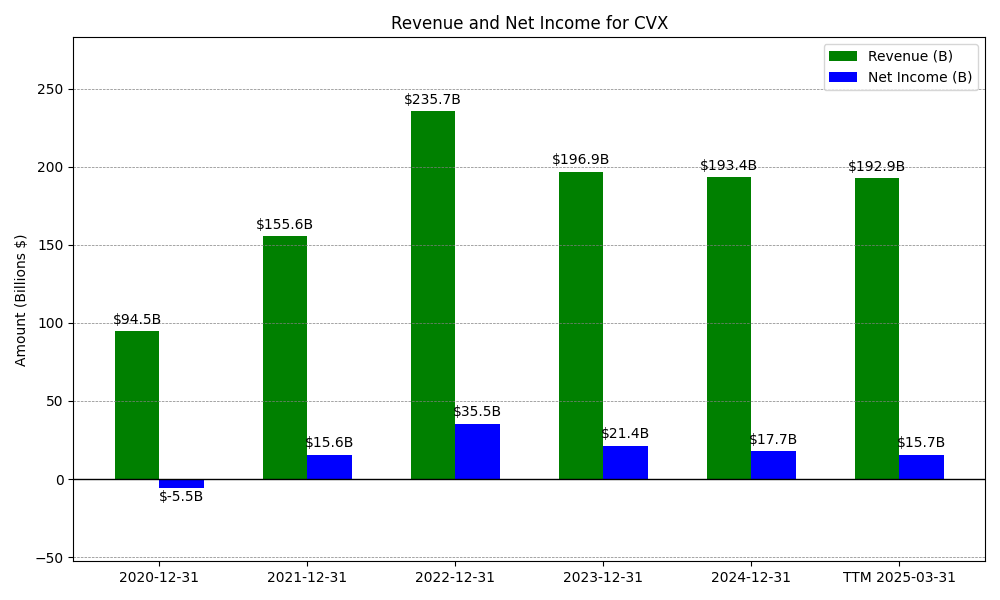
| Date | Revenue | Net_Income | EPS | Last_Updated | Revenue_Change | Net_Income_Change | EPS_Change | |
|---|---|---|---|---|---|---|---|---|
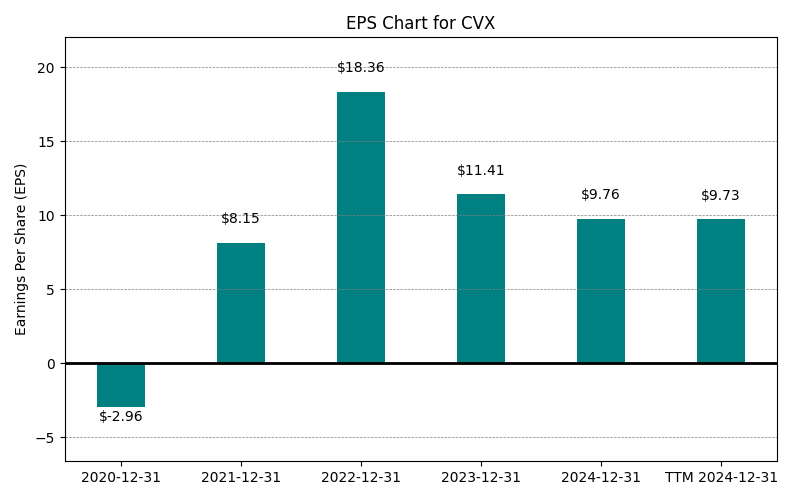
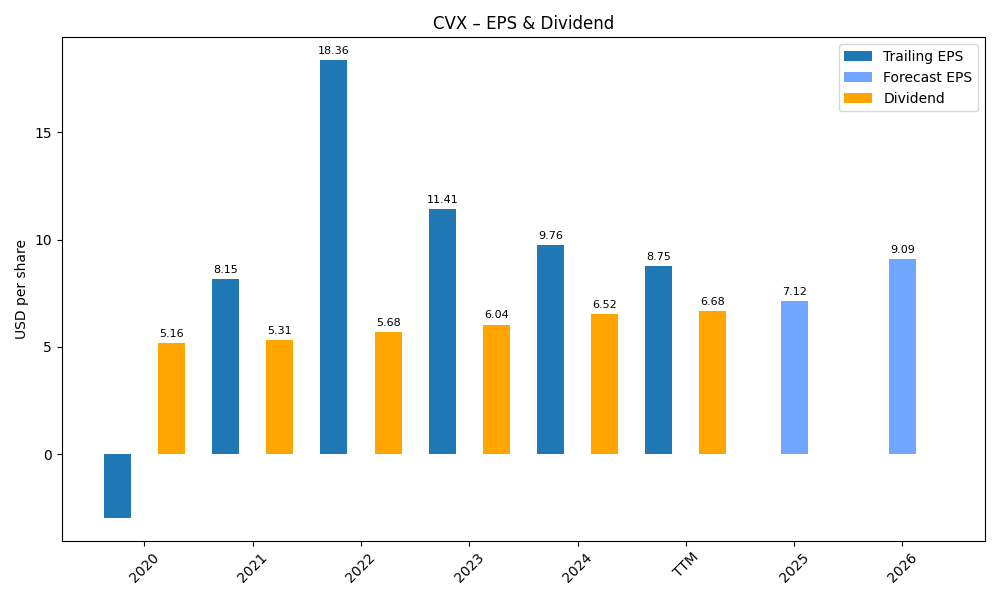
| 0 | 2020-12-31 | $94,471M | $-5,543M | $-2.96 | 2024-02-03 03:17:10 | N/A | N/A | N/A |
| 1 | 2021-12-31 | $155,606M | $15,625M | $18.36 | 2026-03-03 08:32:37 | 64.7% | -381.9% | -720.3% |
| 2 | 2022-12-31 | $235,717M | $35,465M | $18.36 | 2026-05-29 09:07:07 | 51.5% | 127.0% | 0.0% |
| 3 | 2023-12-31 | $196,913M | $21,369M | $11.41 | 2026-05-29 09:07:07 | -16.5% | -39.7% | -37.9% |
| 4 | 2024-12-31 | $193,414M | $17,661M | $9.76 | 2026-05-29 09:07:07 | -1.8% | -17.4% | -14.5% |
| 5 | 2025-12-31 | $184,432M | $12,299M | $6.65 | 2026-05-29 09:07:07 | -4.6% | -30.4% | -31.9% |
| 6 | TTM 2026-03-31 | $185,887M | $11,009M | $5.75 | 2026-05-07 08:55:05 | 0.8% | -10.5% | -13.5% |
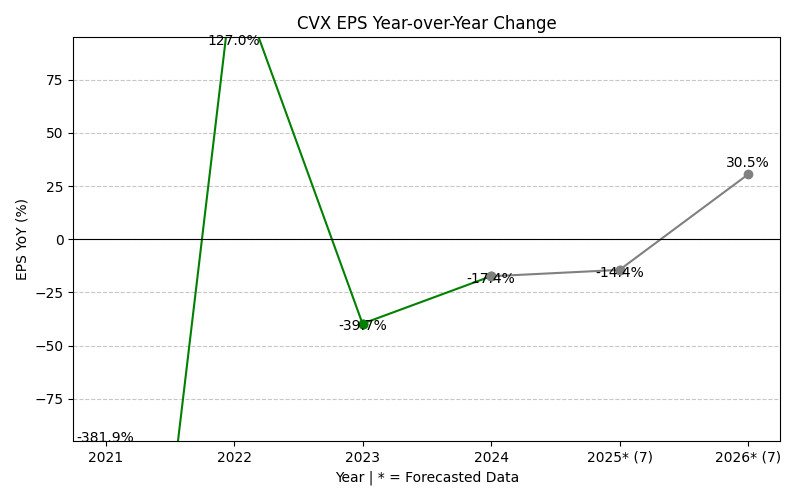
EPS
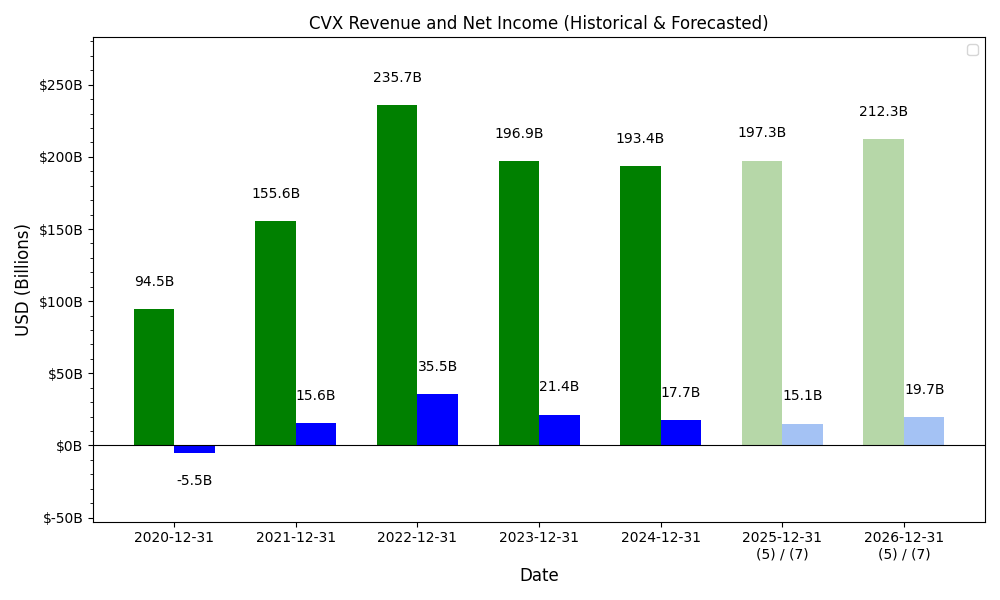
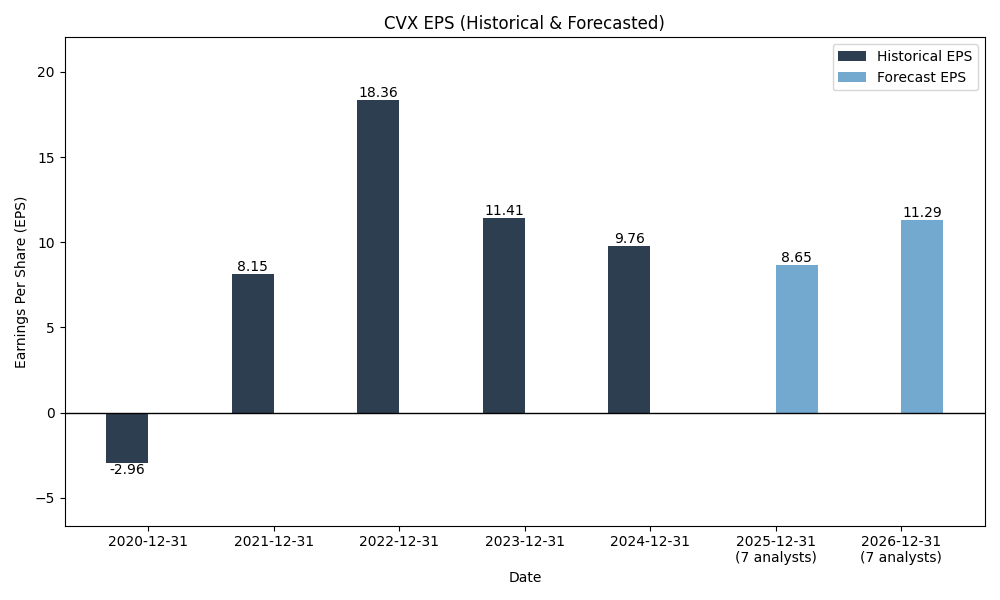
Forecasts
Y/Y % Change
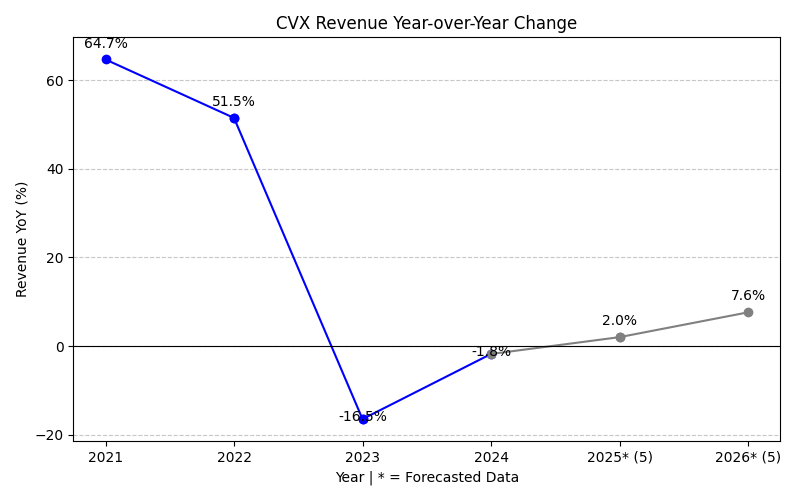
CVX Year-over-Year Growth
| 2020 | 2021 | 2022 | 2023 | 2024 | 2025 | 2026 | 2027 | Average | |
|---|---|---|---|---|---|---|---|---|---|
| Revenue Growth (%) | 64.7% | 51.5% | -16.5% | -1.8% | -4.6% | 27.4% | -10.9% | 15.7% | |
| Revenue Analysts (#) | 0 | 0 | 0 | 0 | 0 | 0 | 12 | 12 | |
| EPS Growth (%) | -381.9% | 127.0% | -39.7% | -17.4% | -30.4% | 136.6% | -14.9% | -31.5% | |
| EPS Analysts (#) | 0 | 0 | 0 | 0 | 0 | 0 | 22 | 24 |
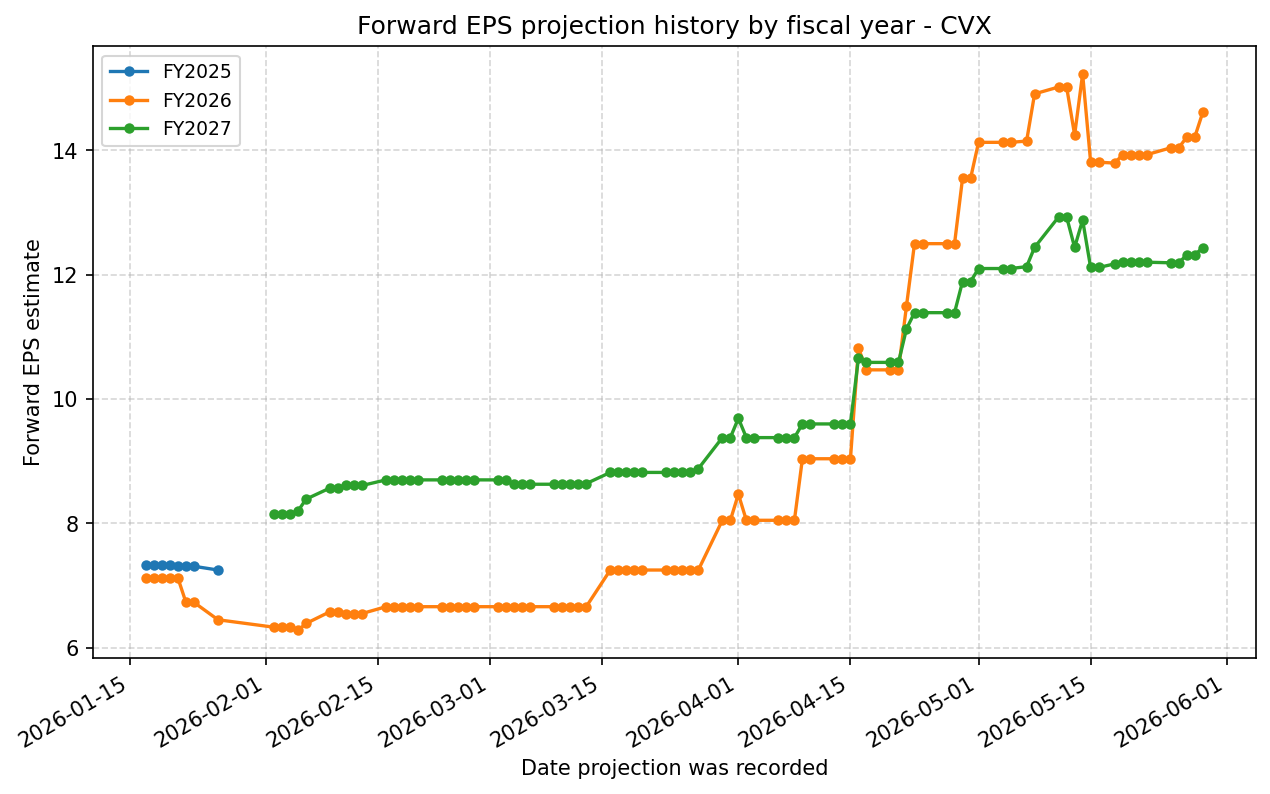
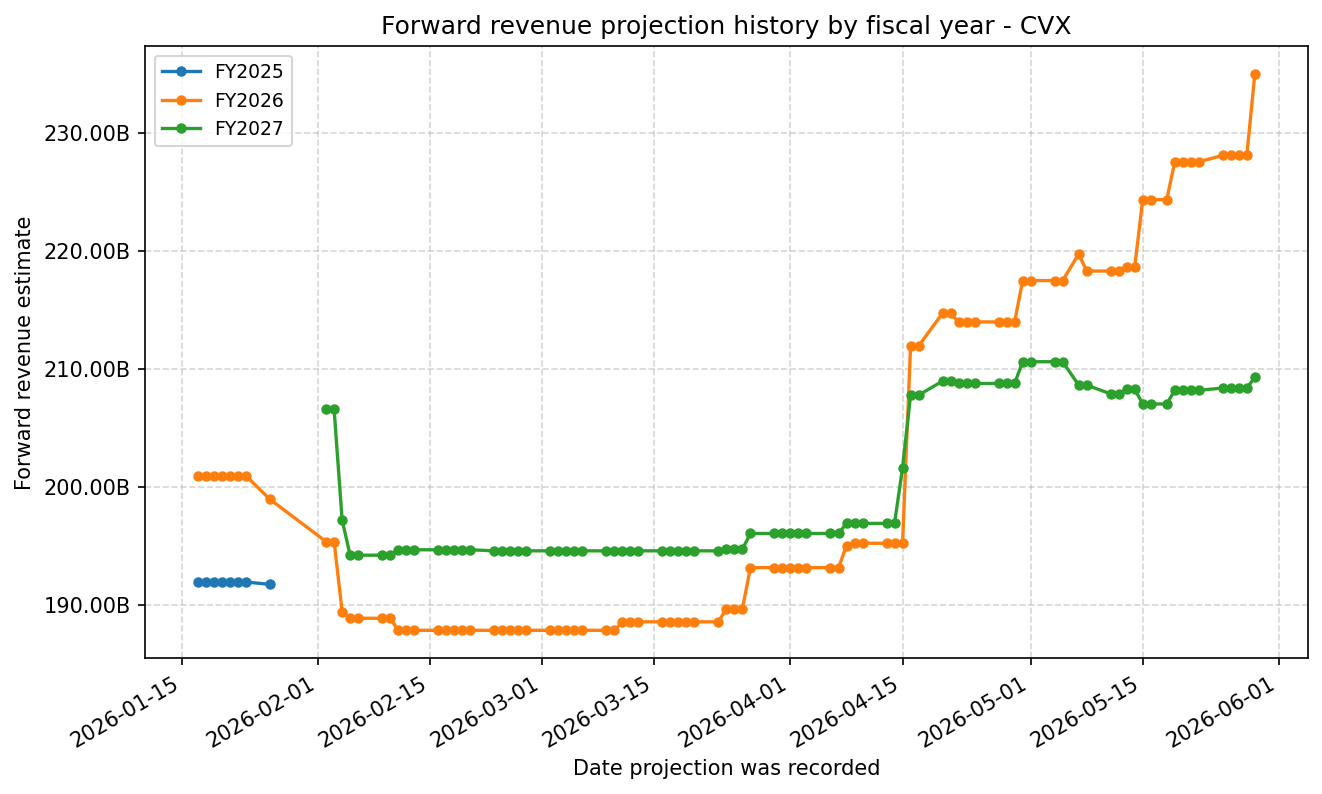
Forward Estimate History
How the next-FY EPS and revenue estimates have drifted over time. One line per fiscal year – past lines end when that FY became current.
Expenses
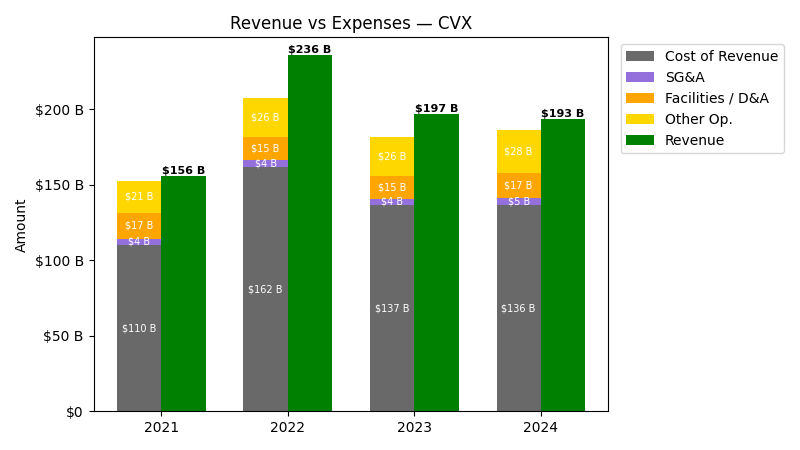
| Year | Revenue ($) | Cost of Revenue ($) | SG&A ($) | Facilities / D&A ($) |
|---|---|---|---|---|
| 2021 | $155.6B | $93.2B | $4.0B | $17.0B |
| 2022 | $235.7B | $146.4B | $4.3B | $15.3B |
| 2023 | $196.9B | $118.8B | $4.1B | $17.8B |
| 2024 | $193.4B | $118.8B | $4.8B | $17.7B |
| 2025 | $184.4B | $107.9B | $5.1B | $20.5B |
| TTM | $185.9B | $107.6B | $5.0B | $22.1B |
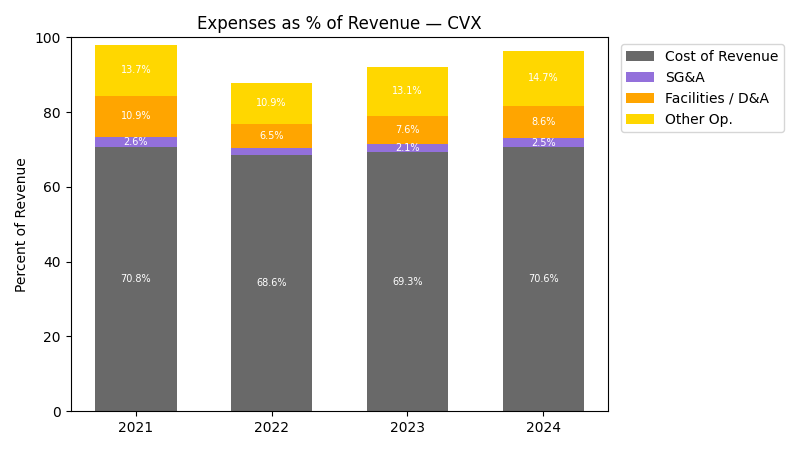
| Year | Revenue Change (%) | Cost of Revenue Change (%) | SG&A Change (%) | Facilities / D&A Change (%) |
|---|---|---|---|---|
| 2022 | 51.48 | 57.19 | 7.42 | -10.10 |
| 2023 | -16.46 | -18.90 | -3.97 | 16.13 |
| 2024 | -1.78 | 0.01 | 16.74 | -0.29 |
| 2025 | -4.64 | -9.17 | 6.04 | 15.50 |
| TTM | 0.79 | -0.29 | -3.02 | 8.10 |
No unmapped expenses.
Segment Performance
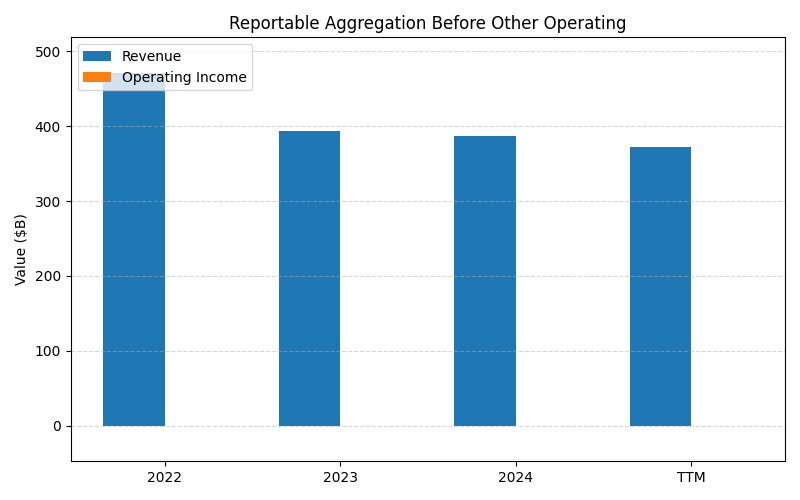
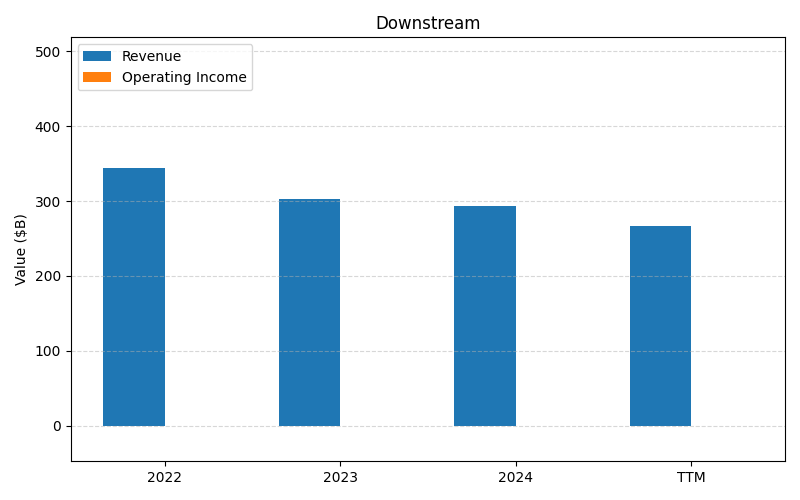
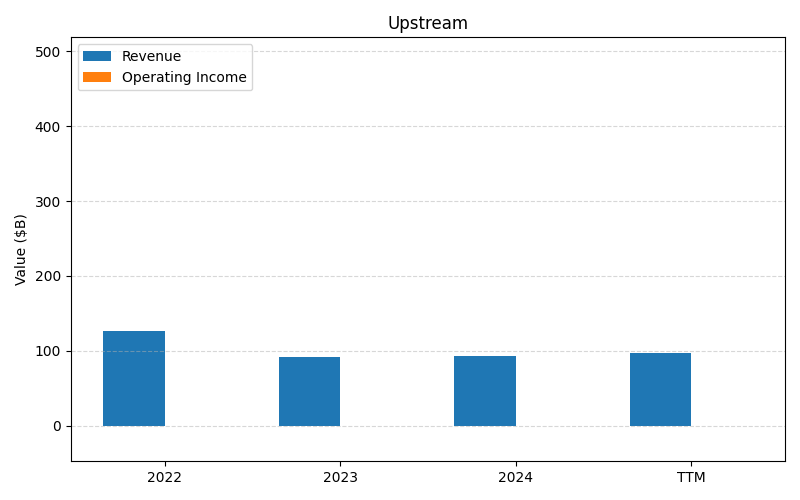
SEGMENTS v2025-09-09 · 2026-05-29 09:07 UTC — Units: $B. Rows list fiscal years (last 3 + TTM) with revenue for each segment; the final row shows the TTM revenue mix (operating income columns display “—” where mix is not applicable).
| Year | Reportable Aggregation Before Other Operating Rev | Downstream Rev | Upstream Rev | All Other Segments Rev | Total Rev |
|---|---|---|---|---|---|
| 2023 | 393.6B | 302.1B | 91.5B | 0.27B | 787.4B |
| 2024 | 386.6B | 292.9B | 93.7B | 0.26B | 773.4B |
| 2025 | 368.7B | 261.8B | 106.9B | 0.21B | 737.5B |
| TTM | 942.5B | 690.7B | 251.8B | 0.54B | 1885.5B |
| % of Total (TTM) | 50.0% | 36.6% | 13.4% | 0.0% | 100% |
Balance Sheet
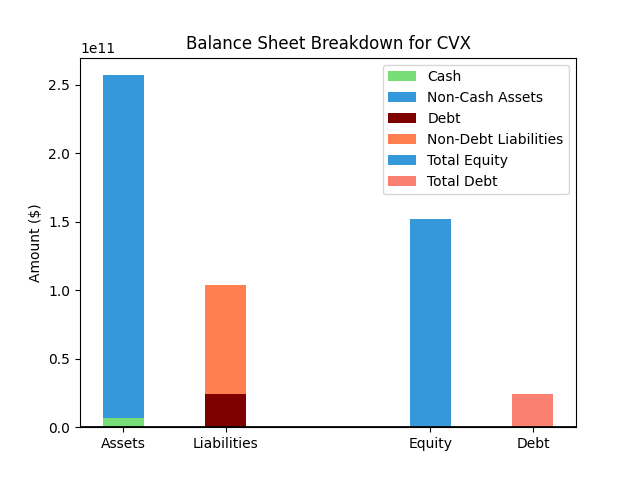
| Metric | Value | |
|---|---|---|
| 0 | Total Assets | $329,551M |
| 1 | Cash | $5,323M |
| 2 | Total Liabilities | $140,180M |
| 3 | Total Debt | $45,428M |
| 4 | Total Equity | $183,715M |
| 5 | Debt to Equity Ratio | 0.25 |
EPS & Dividend
Valuation
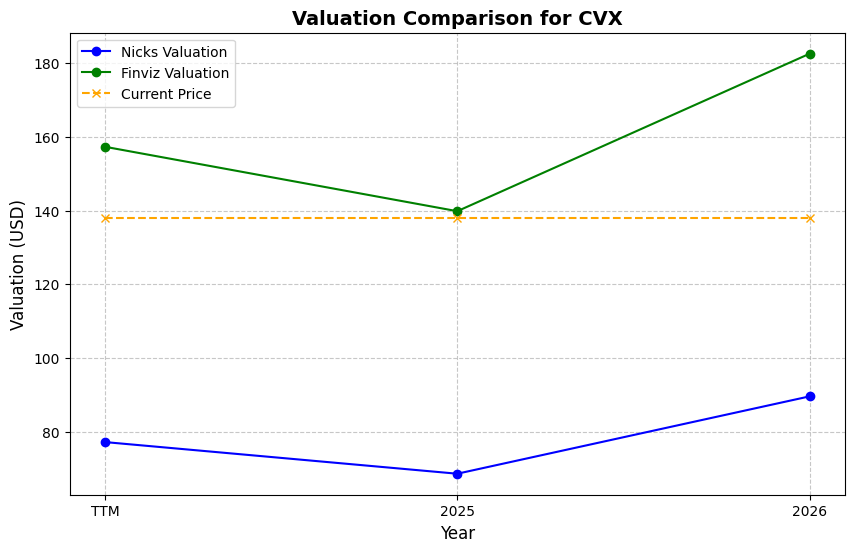
| Share Price | Treasury Yield | Estimates | Fair Value (P/E) | Fair Value (P/S) | Current P/S | Current P/E |
|---|---|---|---|---|---|---|
| $182.46 | 4.5% | Nicks Growth: 2% Nick's Expected Margin: 10% FINVIZ Growth: 19% |
Nicks: 8 Finviz: 40 |
Nick's: 0.780 | 2.0 | 31.7 |
| Basis | Year | Nicks Valuation | Nicks vs Share Price | Finviz Valuation | Finviz vs Share Price |
|---|---|---|---|---|---|
| $5.75 EPS | TTM | $44.85 | -75.4% | $229.14 | 25.6% |
| $14.61 EPS | 2026 | $113.97 | -37.5% | $582.23 | 219.1% |
| $12.44 EPS | 2027 | $97.01 | -46.8% | $495.60 | 171.6% |
Implied Growth
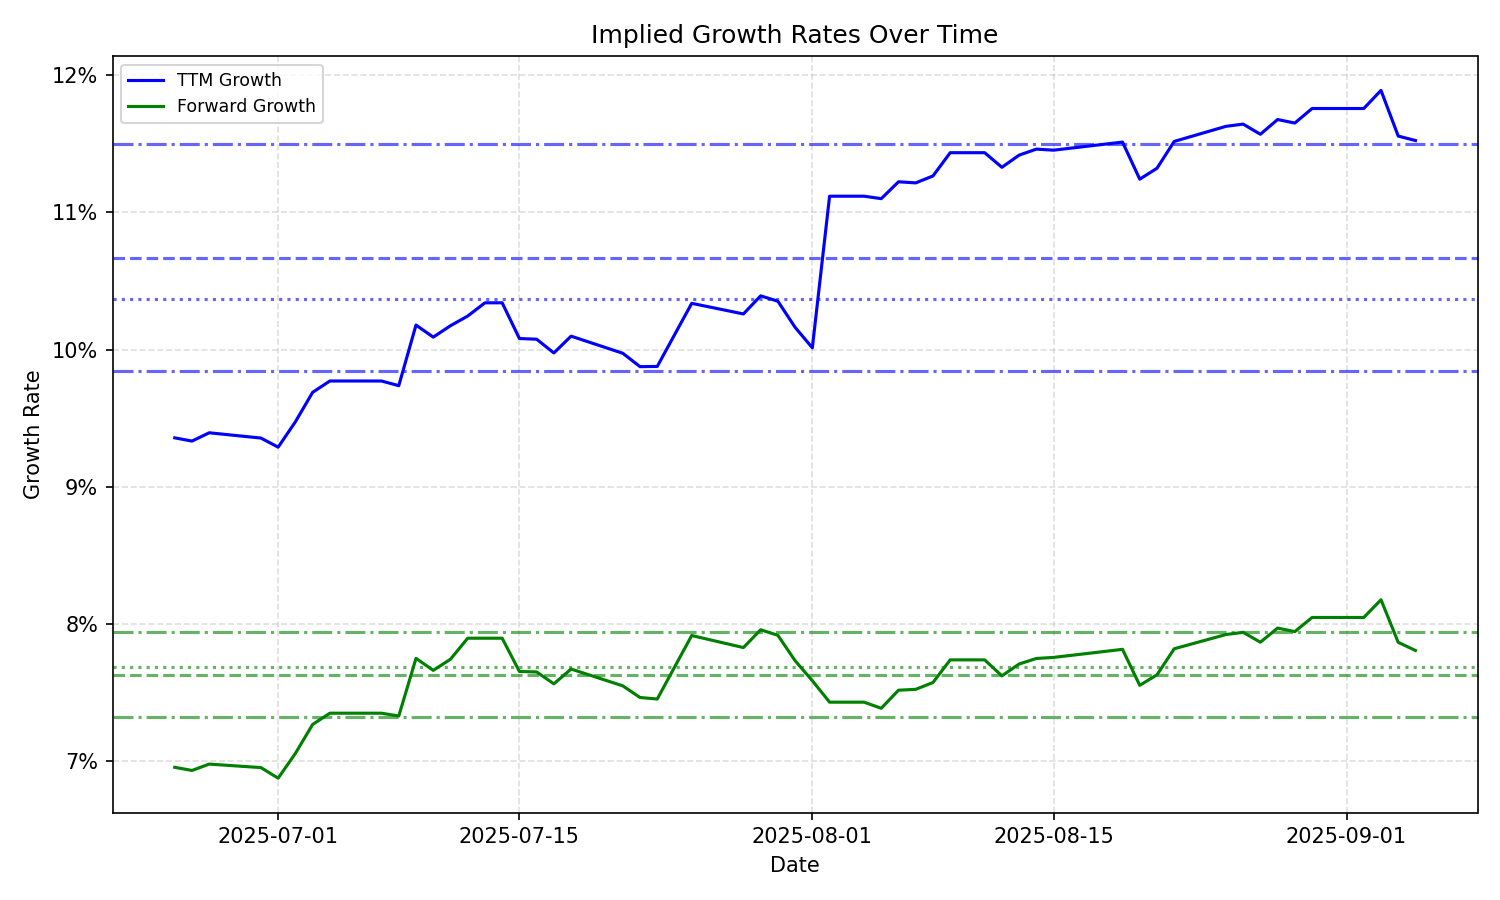
| Average | Median | Std Dev | Current | Percentile | ||||||
|---|---|---|---|---|---|---|---|---|---|---|
| TTM | Forward | TTM | Forward | TTM | Forward | TTM | Forward | TTM | Forward | |
| Timeframe | ||||||||||
| 1 Year | 12.89% | 9.09% | 12.01% | 7.92% | 2.27% | 1.93% | 16.73% | 8.40% | 93.4% | 54.8% |
| 3 Years | 12.89% | 9.09% | 12.01% | 7.92% | 2.27% | 1.93% | 16.73% | 8.40% | 93.4% | 54.8% |
| 5 Years | 12.89% | 9.09% | 12.01% | 7.92% | 2.27% | 1.93% | 16.73% | 8.40% | 93.4% | 54.8% |
| 10 Years | 12.89% | 9.09% | 12.01% | 7.92% | 2.27% | 1.93% | 16.73% | 8.40% | 93.4% | 54.8% |