CVS Health Corporation — CVS
| Close Price | Market Cap | P/E Ratio | Forward P/E Ratio | Implied Growth* | Implied Forward Growth* | Dividend | P/B Ratio |
|---|---|---|---|---|---|---|---|
| $90.98 | $116.08B | 39.9 | 10.9 | 19.3% | 5.3% | $2.66 2.9% | 1.5 |
Latest Headlines
- · 2 Large-Cap Stocks Worth Your Attention and 1 That Underwhelm
- · Lilly Reopens Zepbound Access For 10 Million US Patients
- · Aetna Better Health(R) of West Virginia Opens New Community Resource Center in Clarksburg
- · CVS Health recognized for technology that improves medication safety and patient care
- · CVS Health Expands Integrated Care With Virtual Mental Health AI And GLP 1
- · Why Eli Lilly (LLY) Stock Is Trading Up Today
Revenue & Net Income
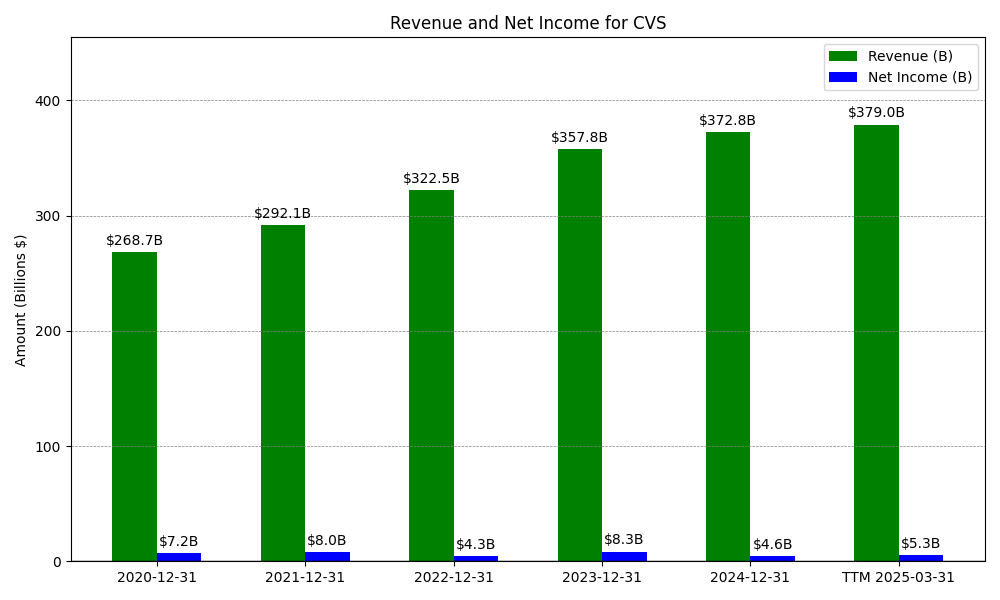
| Date | Revenue | Net_Income | EPS | Last_Updated | Revenue_Change | Net_Income_Change | EPS_Change | |
|---|---|---|---|---|---|---|---|---|
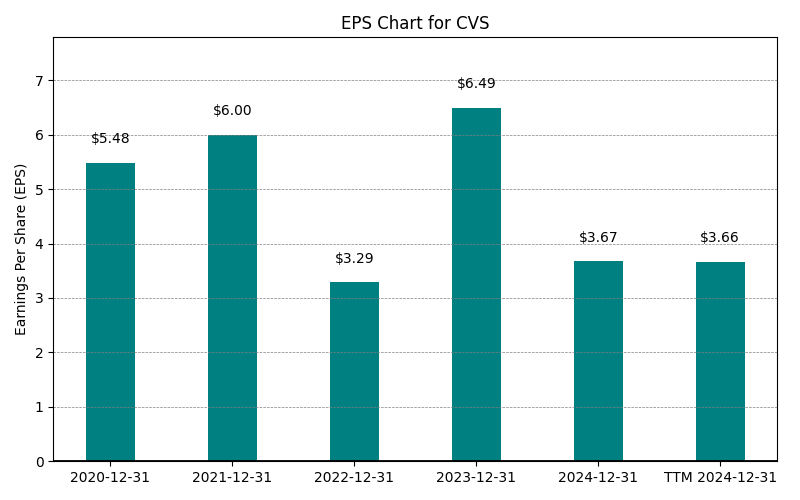
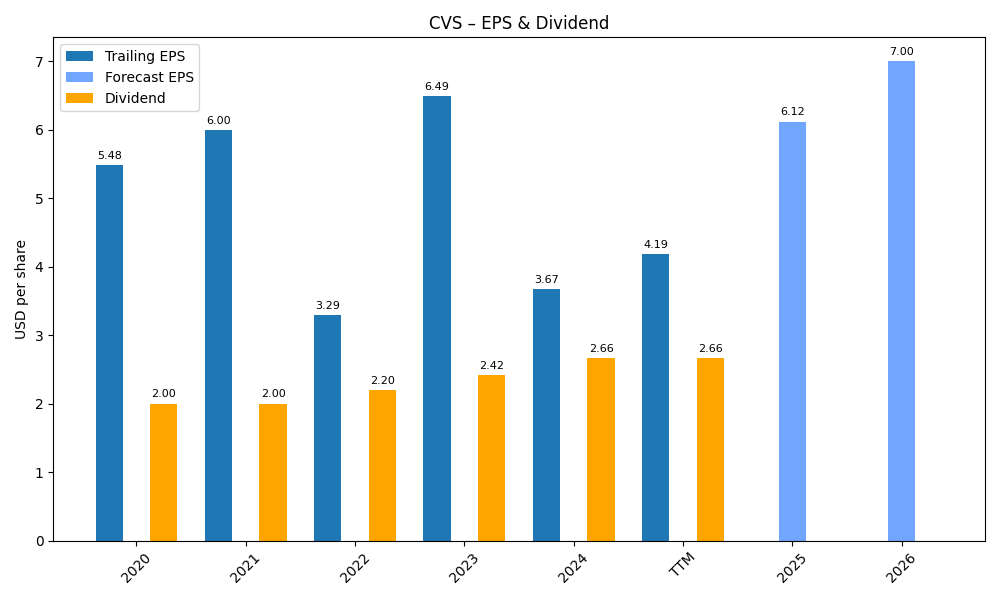
| 0 | 2020-12-31 | $268,706M | $7,179M | $5.48 | 2024-02-03 03:17:10 | N/A | N/A | N/A |
| 1 | 2021-12-31 | $322,467M | $4,311M | $6.00 | 2026-03-11 08:32:35 | 20.0% | -39.9% | 9.5% |
| 2 | 2022-12-31 | $322,467M | $4,311M | $3.29 | 2026-05-29 09:06:59 | 0.0% | 0.0% | -45.2% |
| 3 | 2023-12-31 | $357,776M | $8,344M | $6.49 | 2026-05-29 09:06:59 | 10.9% | 93.6% | 97.3% |
| 4 | 2024-12-31 | $372,809M | $4,614M | $3.67 | 2026-05-29 09:06:59 | 4.2% | -44.7% | -43.5% |
| 5 | 2025-12-31 | $402,067M | $1,768M | $1.40 | 2026-05-29 09:06:59 | 7.8% | -61.7% | -61.9% |
| 6 | TTM 2026-03-31 | $407,905M | $2,932M | $2.28 | 2026-05-07 08:54:58 | 1.5% | 65.8% | 62.9% |
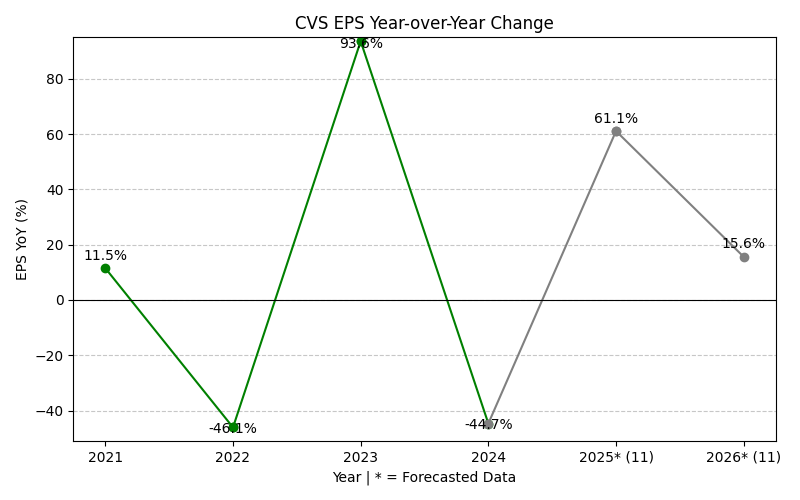
EPS
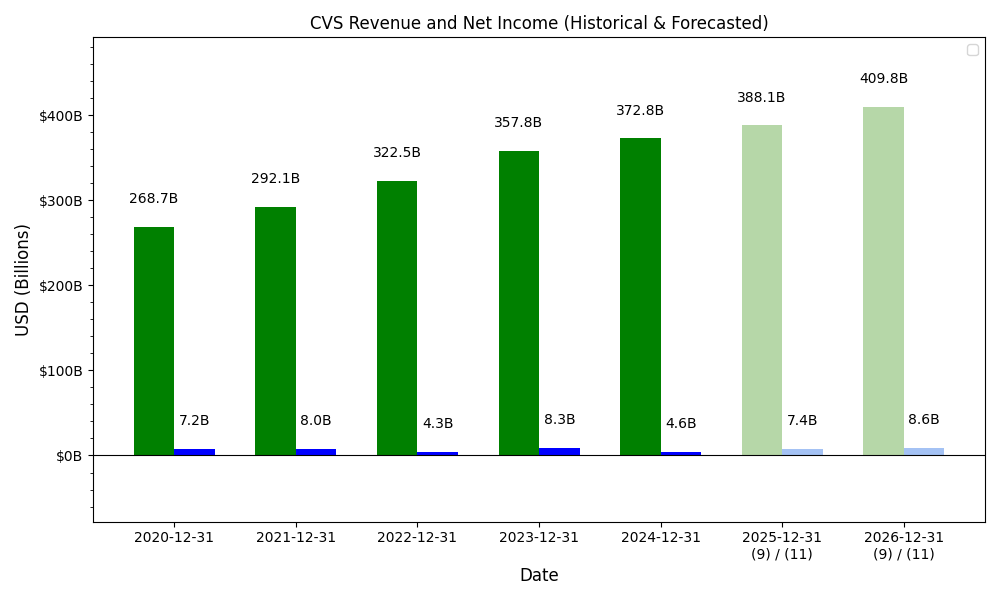
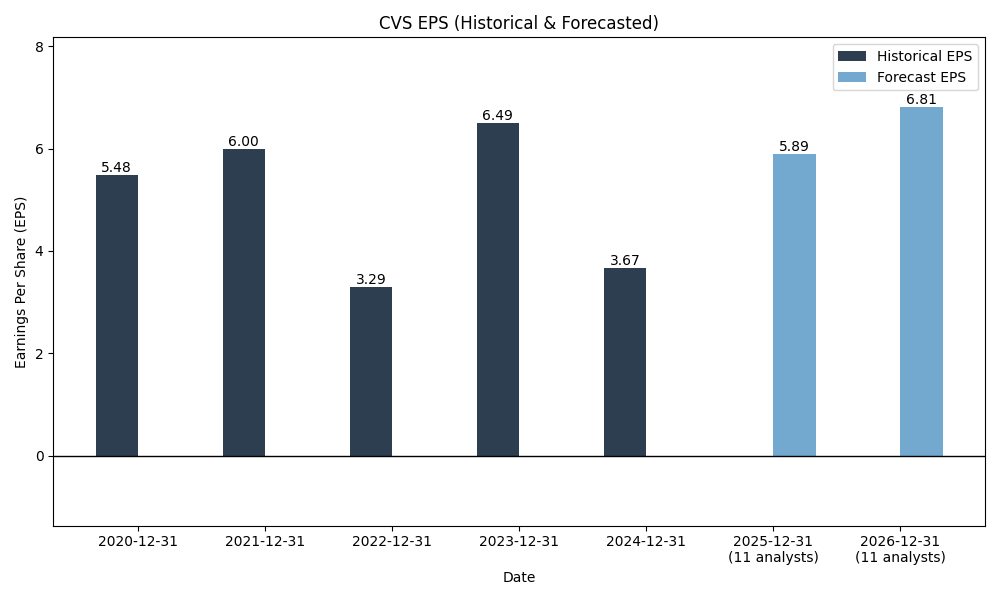
Forecasts
Y/Y % Change
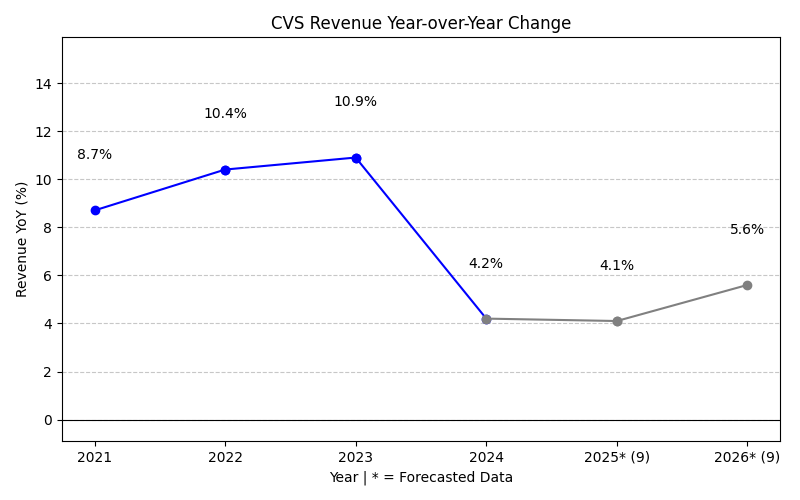
CVS Year-over-Year Growth
| 2020 | 2021 | 2022 | 2023 | 2024 | 2025 | 2026 | 2027 | Average | |
|---|---|---|---|---|---|---|---|---|---|
| Revenue Growth (%) | 20.0% | 0.0% | 10.9% | 4.2% | 7.8% | 1.8% | 4.0% | 7.0% | |
| Revenue Analysts (#) | 0 | 0 | 0 | 0 | 0 | 0 | 19 | 23 | |
| EPS Growth (%) | -39.9% | 0.0% | 93.6% | -44.7% | -61.7% | 436.4% | 12.5% | 56.6% | |
| EPS Analysts (#) | 0 | 0 | 0 | 0 | 0 | 0 | 22 | 27 |
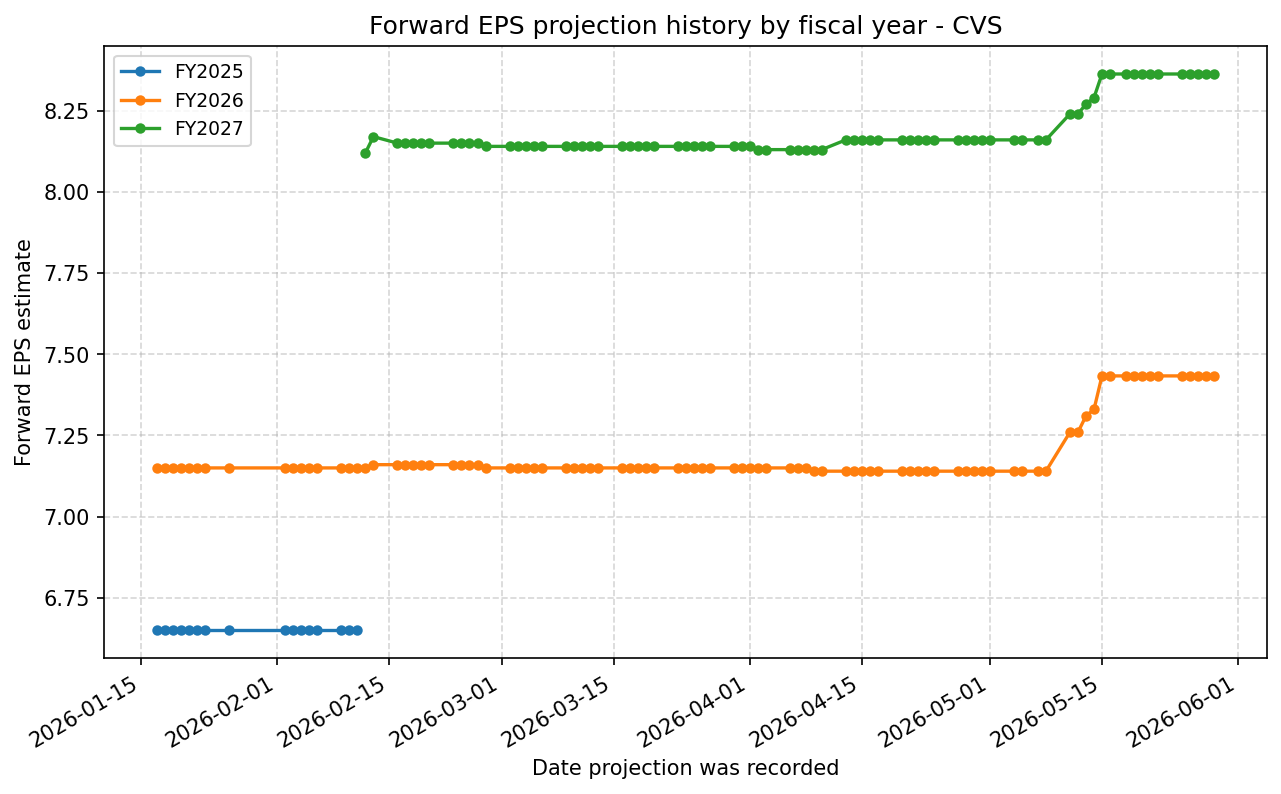
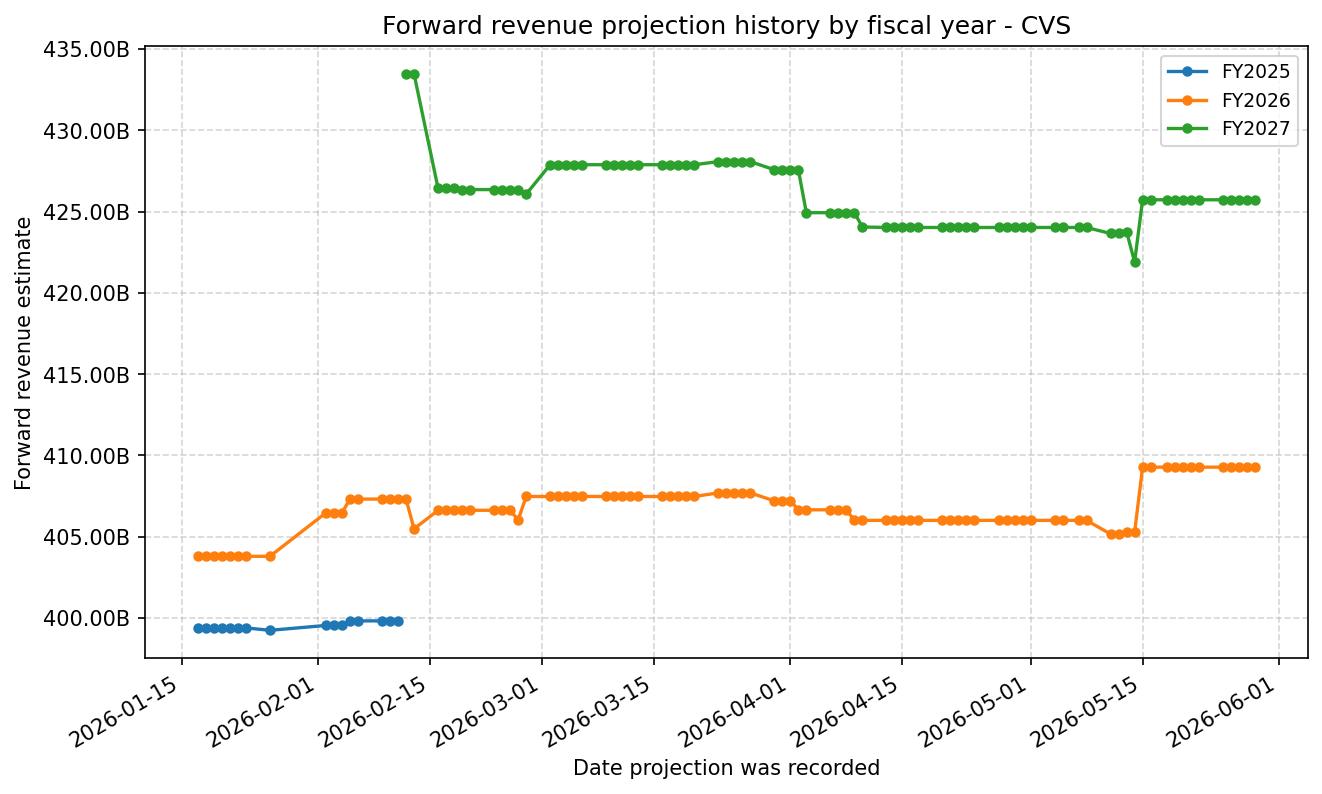
Forward Estimate History
How the next-FY EPS and revenue estimates have drifted over time. One line per fiscal year – past lines end when that FY became current.
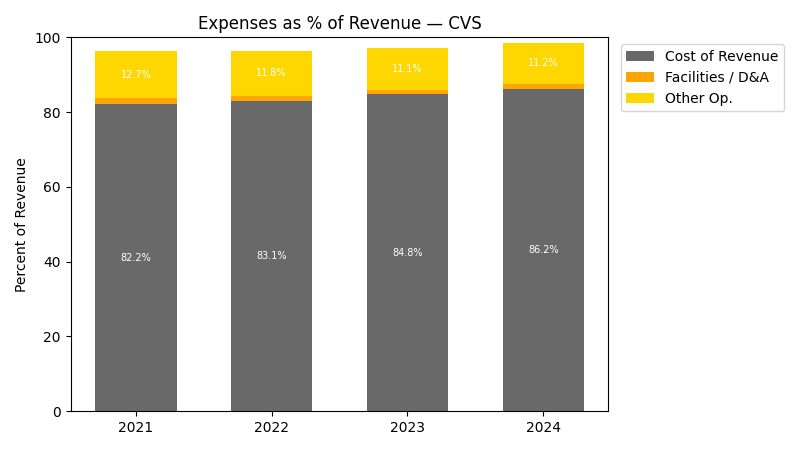
Expenses
| Year | Revenue ($) | Cost of Revenue ($) | Facilities / D&A ($) |
|---|---|---|---|
| 2022 | $322.5B | $263.7B | $4.2B |
| 2023 | $357.8B | $299.0B | $4.4B |
| 2024 | $372.8B | $316.8B | $4.6B |
| 2025 | $402.1B | $342.1B | $4.6B |
| TTM | $407.9B | $346.7B | $4.6B |
| Year | Revenue Change (%) | Cost of Revenue Change (%) | Facilities / D&A Change (%) |
|---|---|---|---|
| 2023 | 10.95 | 13.36 | 3.36 |
| 2024 | 4.20 | 5.96 | 5.29 |
| 2025 | 7.85 | 7.98 | 0.20 |
| TTM | 1.45 | 1.36 | -0.85 |
No unmapped expenses.
Segment Performance
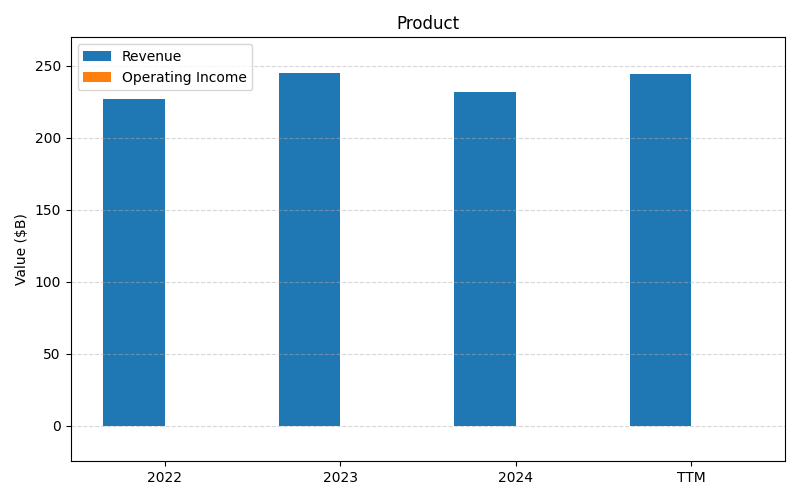
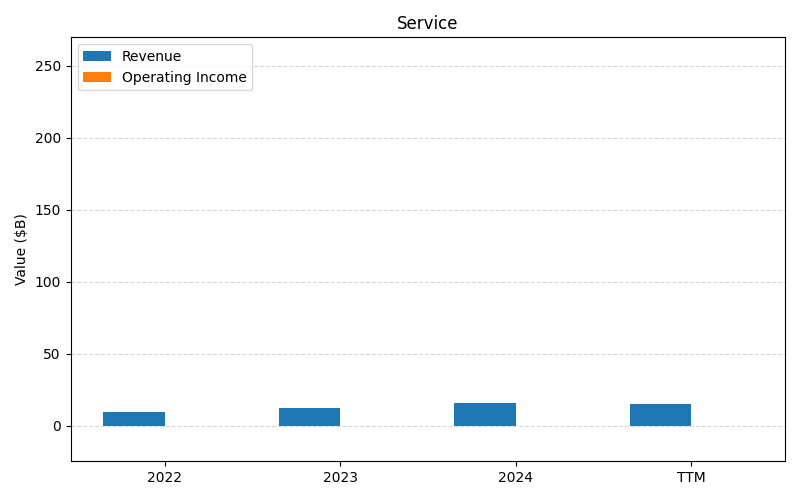
SEGMENTS v2025-09-09 · 2026-05-29 09:07 UTC — Units: $B. Rows list fiscal years (last 3 + TTM) with revenue for each segment; the final row shows the TTM revenue mix (operating income columns display “—” where mix is not applicable).
| Year | Prod Rev | Services Rev | Total Rev |
|---|---|---|---|
| 2023 | 245.1B | 12.3B | 257.4B |
| 2024 | 231.5B | 16.2B | 247.8B |
| 2025 | 249.9B | 15.2B | 265.1B |
| TTM | 601.3B | 38.8B | 640.2B |
| % of Total (TTM) | 93.9% | 6.1% | 100% |
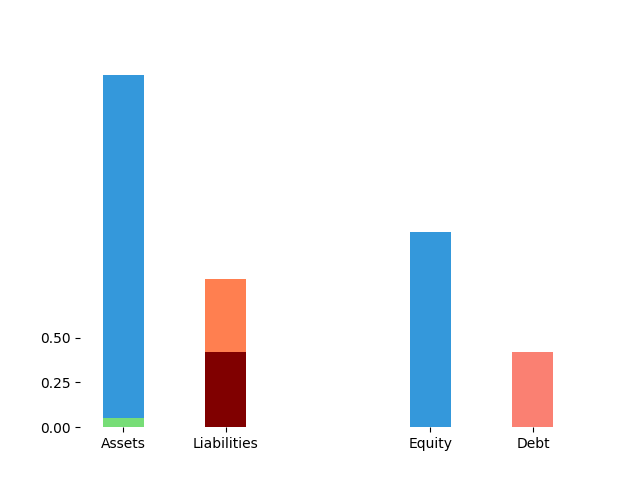
Balance Sheet
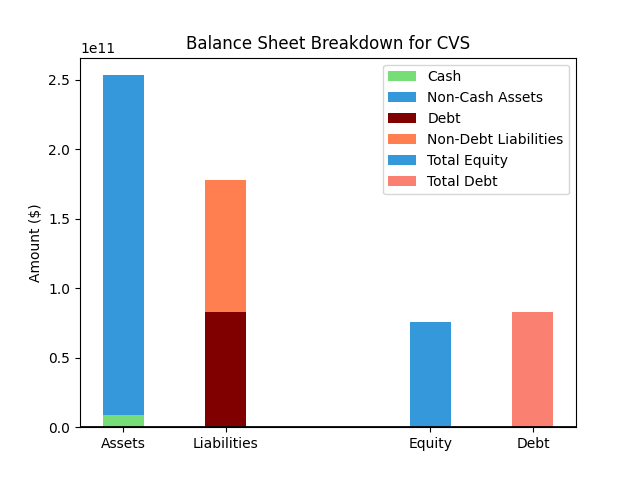
| Metric | Value | |
|---|---|---|
| 0 | Total Assets | $252,974M |
| 1 | Cash | $9,542M |
| 2 | Total Liabilities | $175,337M |
| 3 | Total Debt | $78,345M |
| 4 | Total Equity | $77,456M |
| 5 | Debt to Equity Ratio | 1.01 |
EPS & Dividend
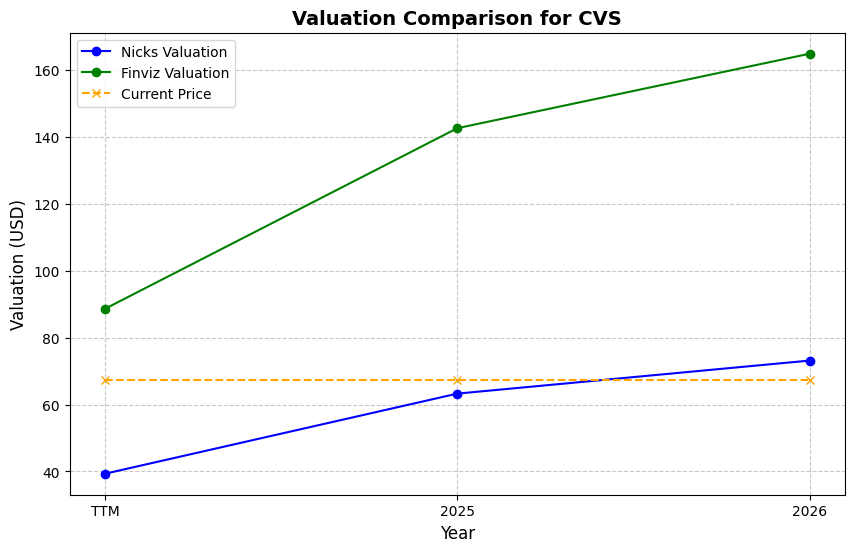
Valuation
| Share Price | Treasury Yield | Estimates | Fair Value (P/E) | Fair Value (P/S) | Current P/S | Current P/E |
|---|---|---|---|---|---|---|
| $90.98 | 4.5% | Nicks Growth: 5% Nick's Expected Margin: 2% FINVIZ Growth: 13% |
Nicks: 11 Finviz: 22 |
Nick's: 0.211 | 0.3 | 39.9 |
| Basis | Year | Nicks Valuation | Nicks vs Share Price | Finviz Valuation | Finviz vs Share Price |
|---|---|---|---|---|---|
| $2.28 EPS | TTM | $24.08 | -73.5% | $49.71 | -45.4% |
| $7.43 EPS | 2026 | $78.50 | -13.7% | $162.07 | 78.1% |
| $8.36 EPS | 2027 | $88.32 | -2.9% | $182.35 | 100.4% |
Implied Growth
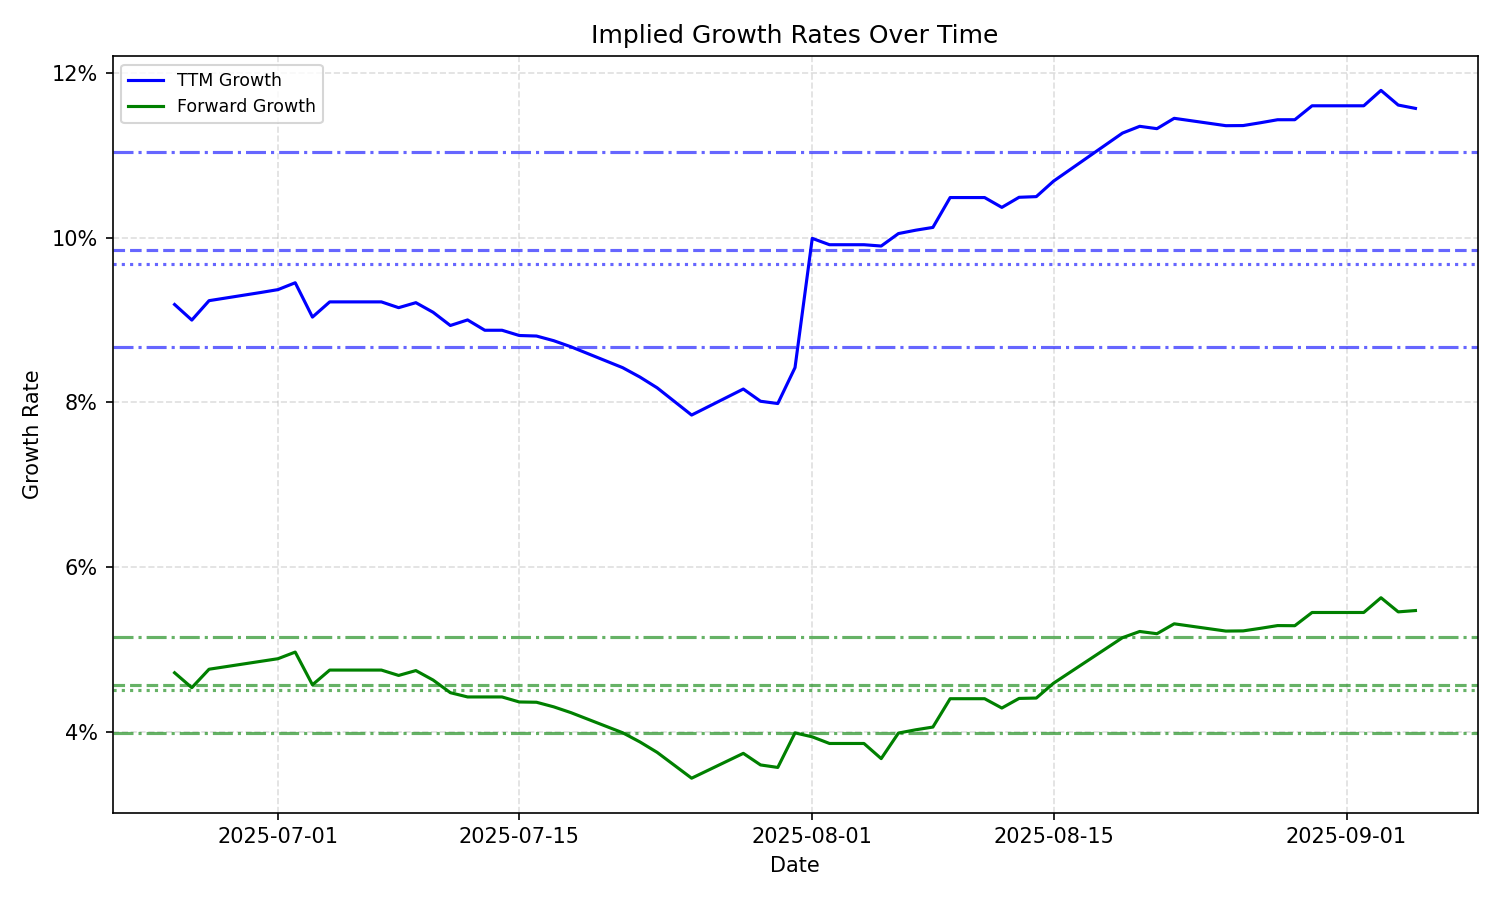
| Average | Median | Std Dev | Current | Percentile | ||||||
|---|---|---|---|---|---|---|---|---|---|---|
| TTM | Forward | TTM | Forward | TTM | Forward | TTM | Forward | TTM | Forward | |
| Timeframe | ||||||||||
| 1 Year | 21.85% | 4.89% | 22.00% | 5.19% | 11.59% | 0.99% | 19.55% | 5.52% | 44.8% | 68.0% |
| 3 Years | 21.85% | 4.89% | 22.00% | 5.19% | 11.59% | 0.99% | 19.55% | 5.52% | 44.8% | 68.0% |
| 5 Years | 21.85% | 4.89% | 22.00% | 5.19% | 11.59% | 0.99% | 19.55% | 5.52% | 44.8% | 68.0% |
| 10 Years | 21.85% | 4.89% | 22.00% | 5.19% | 11.59% | 0.99% | 19.55% | 5.52% | 44.8% | 68.0% |