Salesforce, Inc. — CRM
| Close Price | Market Cap | P/E Ratio | Forward P/E Ratio | Implied Growth* | Implied Forward Growth* | Dividend | P/B Ratio |
|---|---|---|---|---|---|---|---|
| $191.10 | $156.51B | 22.1 | 12.3 | 12.7% | 6.6% | $1.76 0.9% | 4.6 |
Latest Headlines
- · Wall Street's Equity Benchmarks Close Out May at Record Highs
- · Stock Market Today: Dow Closes Above 51,000; Nasdaq, S&P 500 Make History (Live Coverage)
- · Equity Markets Rise Intraday as Trump Sets Out Conditions For Iran Deal
- · ServiceNow Soars 14% on Enterprise AI Rotation as Dell’s Blowout Earnings Lift Software Sector
- · 3 Founder-Led Stocks Focused on Long-Term Wealth Building
- · Stocks Supported by Middle East Peace Hopes and AI Spending
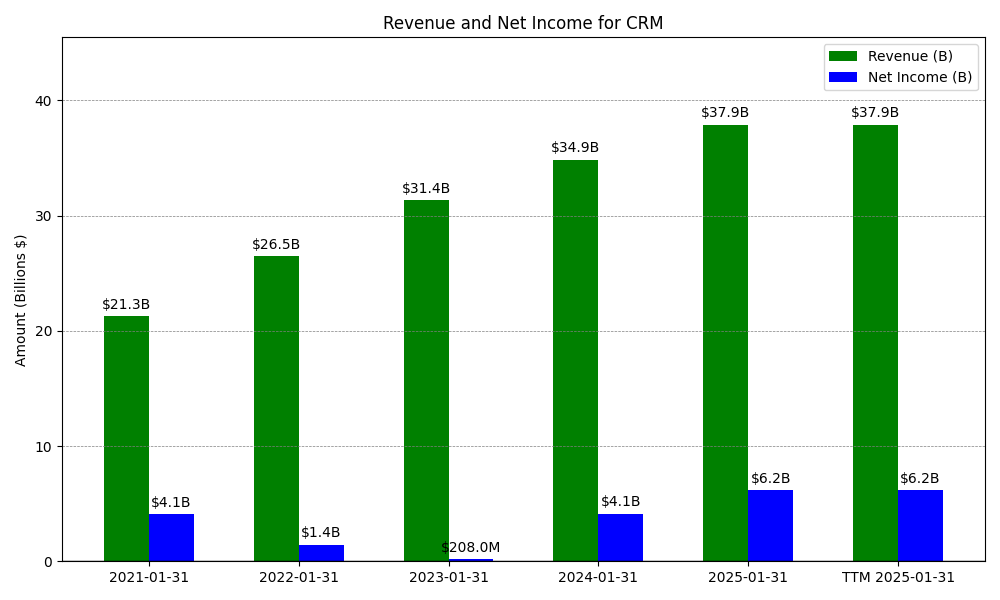
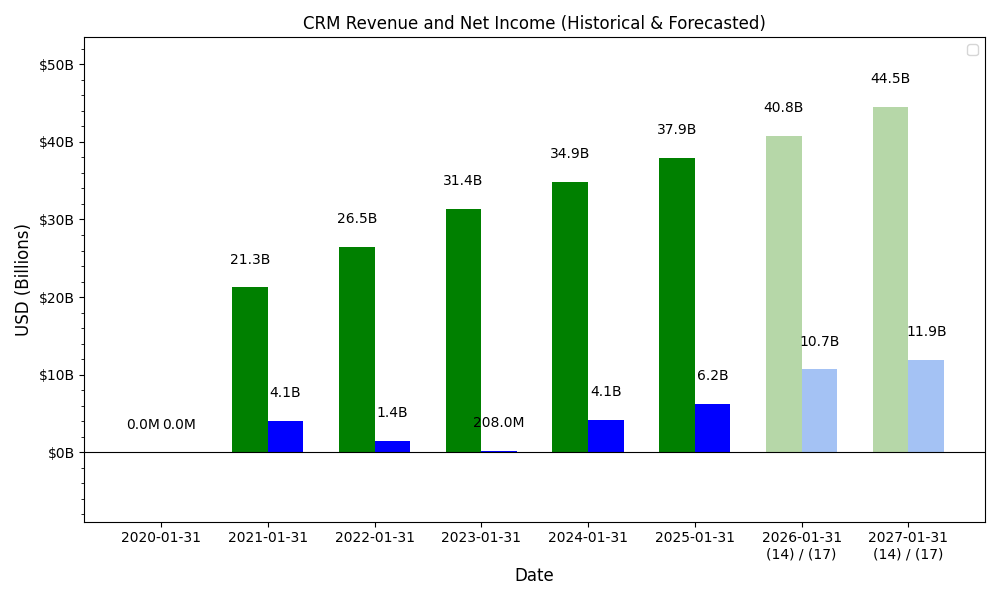
Revenue & Net Income
| Date | Revenue | Net_Income | EPS | Last_Updated | Revenue_Change | Net_Income_Change | EPS_Change | |
|---|---|---|---|---|---|---|---|---|
| 0 | 2020-01-31 | $nanM | $nanM | $nan | 2024-05-25 08:19:36 | N/A | N/A | N/A |
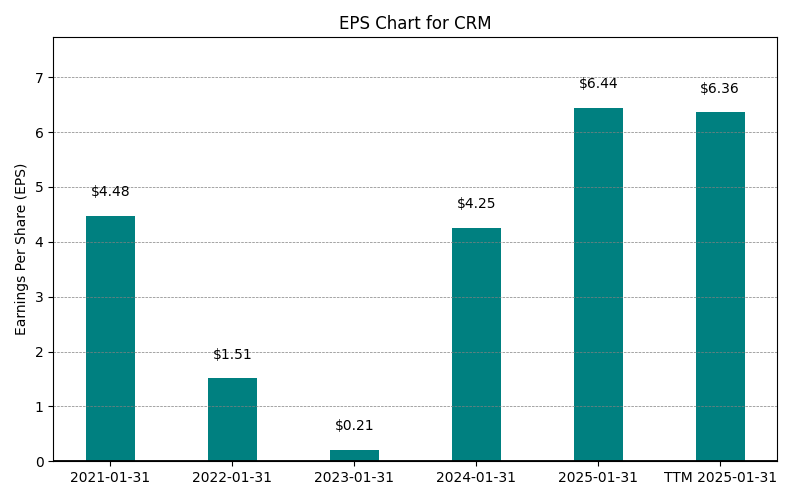
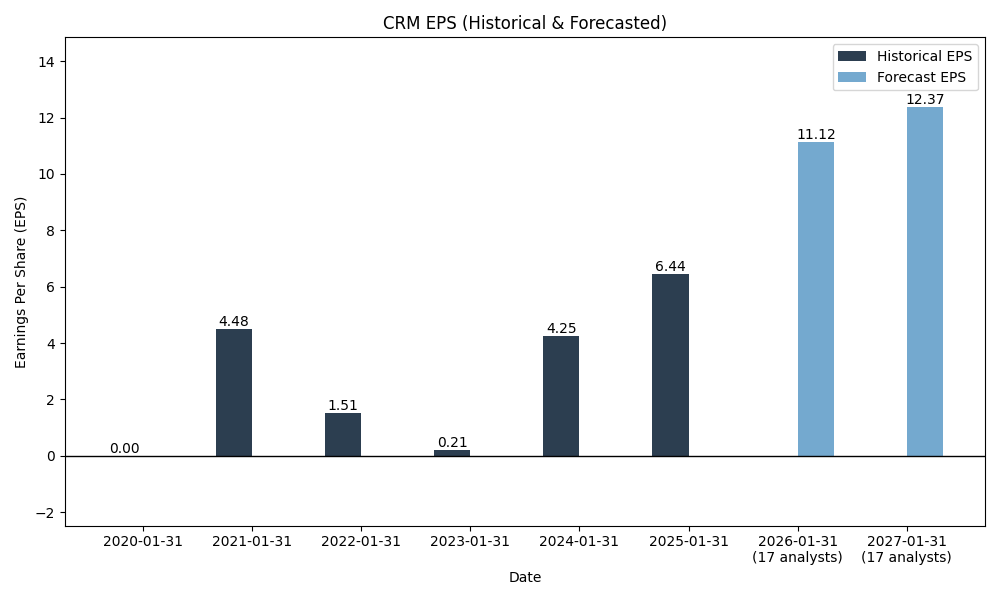
| 1 | 2021-01-31 | $21,252M | $4,072M | $4.48 | 2024-02-04 04:18:29 | N/A | N/A | N/A |
| 2 | 2022-01-31 | $26,492M | $1,444M | $1.51 | 2026-03-06 08:29:24 | 24.7% | -64.5% | -66.3% |
| 3 | 2023-01-31 | $31,352M | $208M | $0.21 | 2026-05-29 09:06:53 | 18.3% | -85.6% | -86.1% |
| 4 | 2024-01-31 | $34,857M | $4,136M | $4.25 | 2026-05-29 09:06:53 | 11.2% | 1888.5% | 1923.8% |
| 5 | 2025-01-31 | $37,895M | $6,197M | $6.44 | 2026-05-29 09:06:53 | 8.7% | 49.8% | 51.5% |
| 6 | 2026-01-31 | $41,525M | $7,457M | $7.85 | 2026-05-29 09:06:53 | 9.6% | 20.3% | 21.9% |
| 7 | TTM 2026-04-30 | $31,696M | $5,916M | $8.63 | 2026-05-29 09:06:53 | -23.7% | -20.7% | 9.9% |
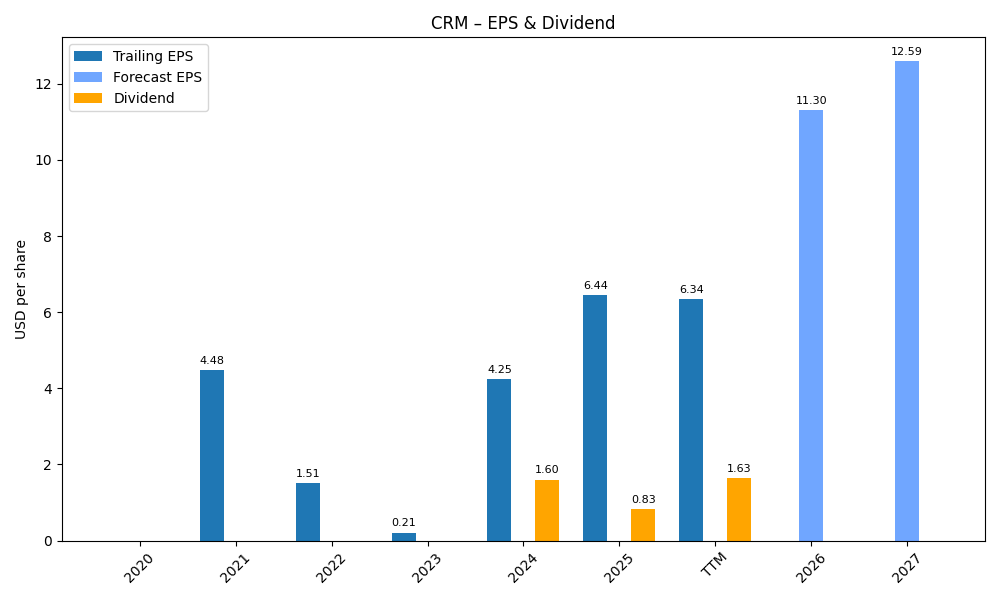
EPS
Forecasts
Y/Y % Change
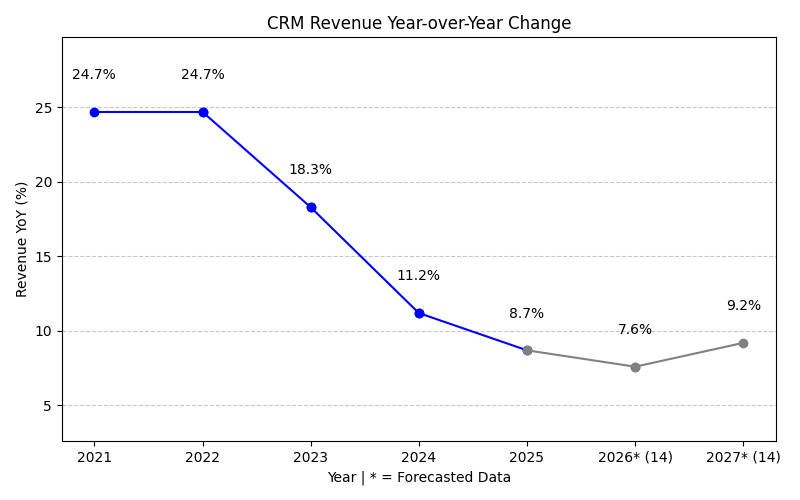
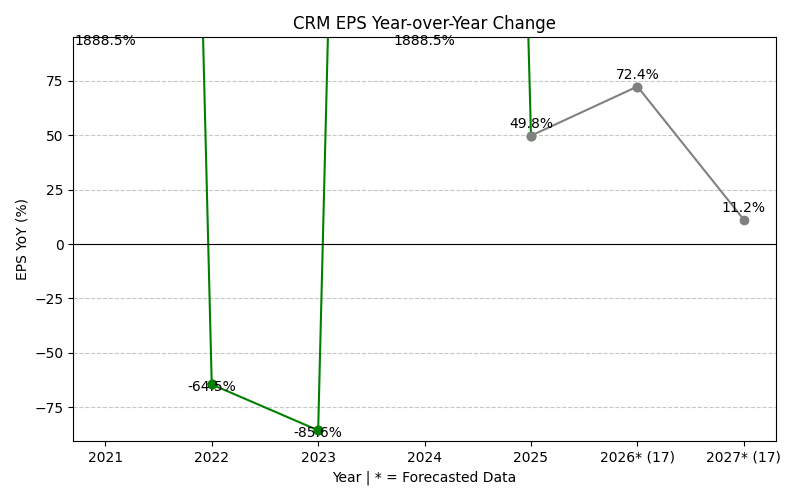
CRM Year-over-Year Growth
| 2020 | 2021 | 2022 | 2023 | 2024 | 2025 | 2026 | 2027 | 2028 | Average | |
|---|---|---|---|---|---|---|---|---|---|---|
| Revenue Growth (%) | inf% | 24.7% | 18.3% | 11.2% | 8.7% | 9.6% | 11.0% | 9.8% | inf% | |
| Revenue Analysts (#) | 0 | 0 | 0 | 0 | 0 | 0 | 0 | 49 | 51 | |
| EPS Growth (%) | inf% | -64.5% | -85.6% | 1888.5% | 49.8% | 20.3% | 55.6% | 9.3% | inf% | |
| EPS Analysts (#) | 0 | 0 | 0 | 0 | 0 | 0 | 0 | 42 | 51 |
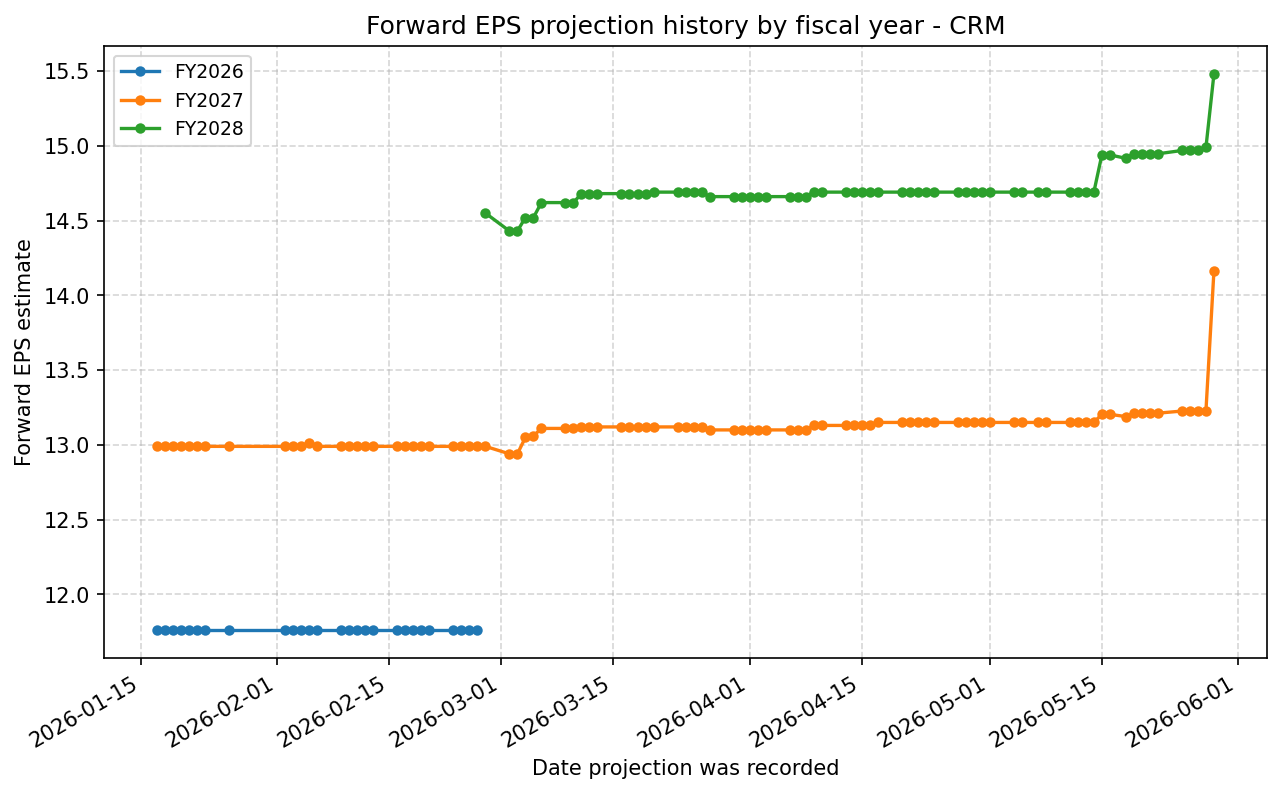
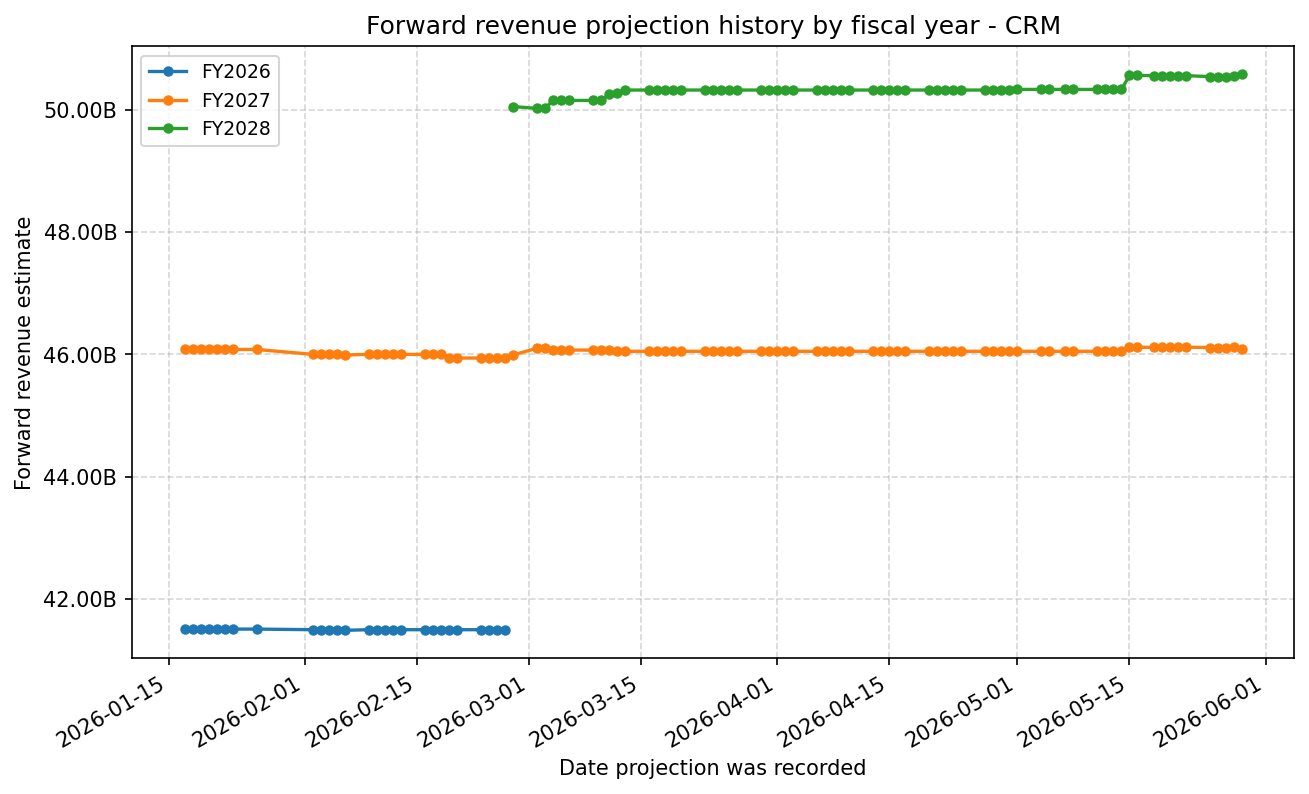
Forward Estimate History
How the next-FY EPS and revenue estimates have drifted over time. One line per fiscal year – past lines end when that FY became current.
Expenses
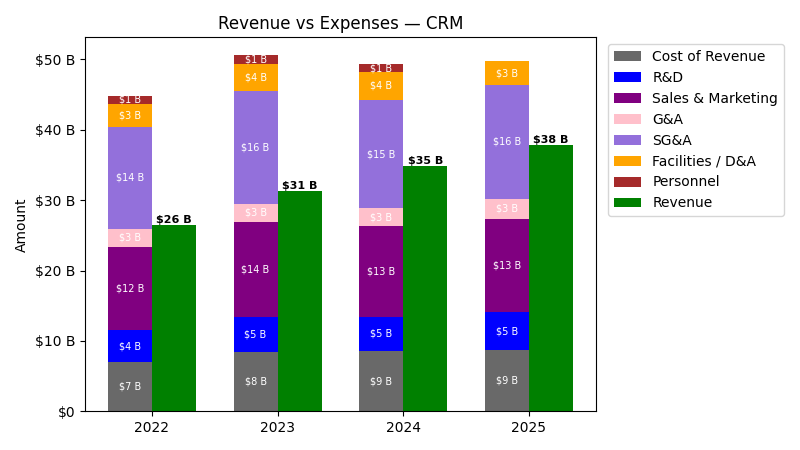
| Year | Revenue ($) | Cost of Revenue ($) | R&D ($) | Sales & Marketing ($) | G&A ($) | SG&A ($) | Facilities / D&A ($) | Personnel ($) |
|---|---|---|---|---|---|---|---|---|
| 2023 | $31.4B | $4.6B | $5.1B | $13.5B | $2.6B | $16.1B | $3.8B | $1.3B |
| 2024 | $34.9B | $1.5B | $4.9B | $12.0B | $2.5B | $14.5B | $4.0B | $1.1B |
| 2025 | $37.9B | $2.6B | $5.5B | $12.4B | $2.8B | $15.2B | $3.5B | $0.0 |
| 2026 | $41.5B | $3.0B | $6.0B | $13.3B | $3.0B | $16.4B | $3.6B | $0.0 |
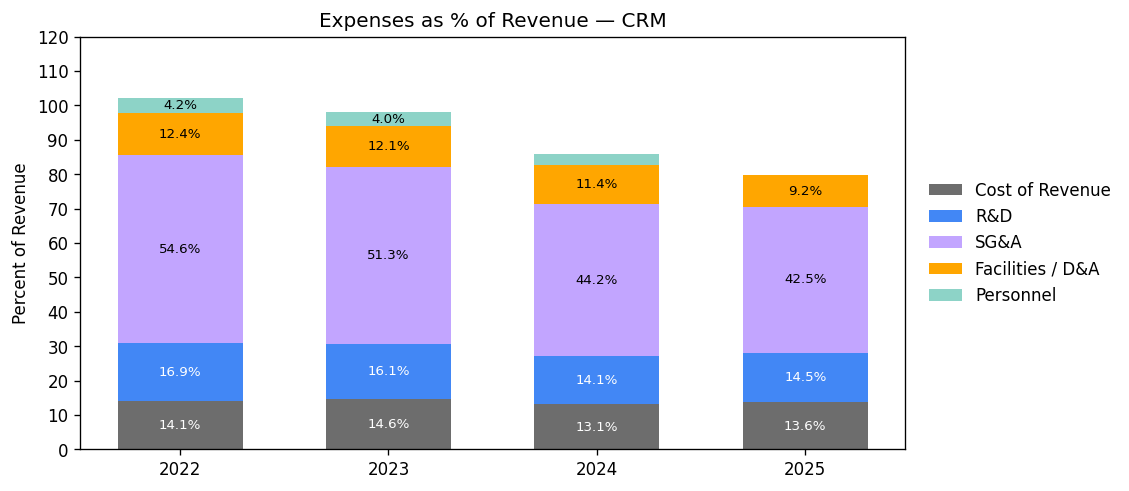
| Year | Revenue Change (%) | Cost of Revenue Change (%) | R&D Change (%) | Sales & Marketing Change (%) | G&A Change (%) | SG&A Change (%) | Facilities / D&A Change (%) | Personnel Change (%) |
|---|---|---|---|---|---|---|---|---|
| 2024 | 11.18 | -66.90 | -2.95 | -11.39 | -0.74 | -9.70 | 4.57 | -15.45 |
| 2025 | 8.72 | 71.07 | 11.96 | 3.09 | 11.92 | 4.63 | -12.17 | -100.00 |
| 2026 | 9.58 | 15.95 | 9.10 | 8.04 | 5.78 | 7.62 | 4.43 | NaN |
No unmapped expenses.
Segment Performance
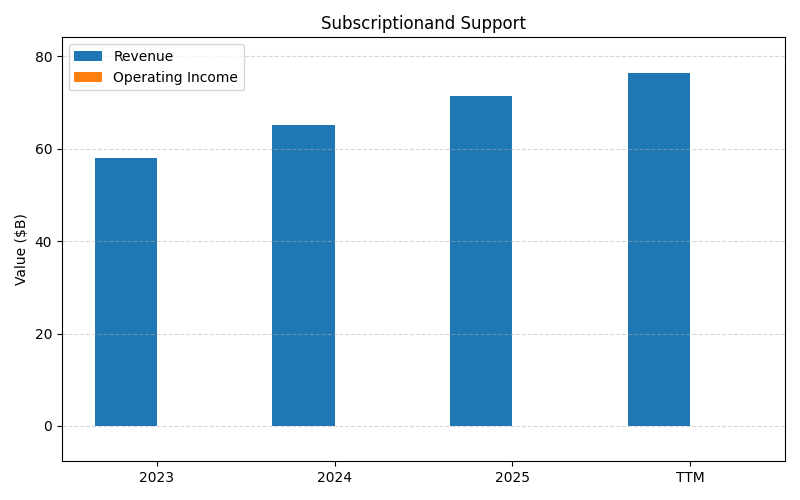
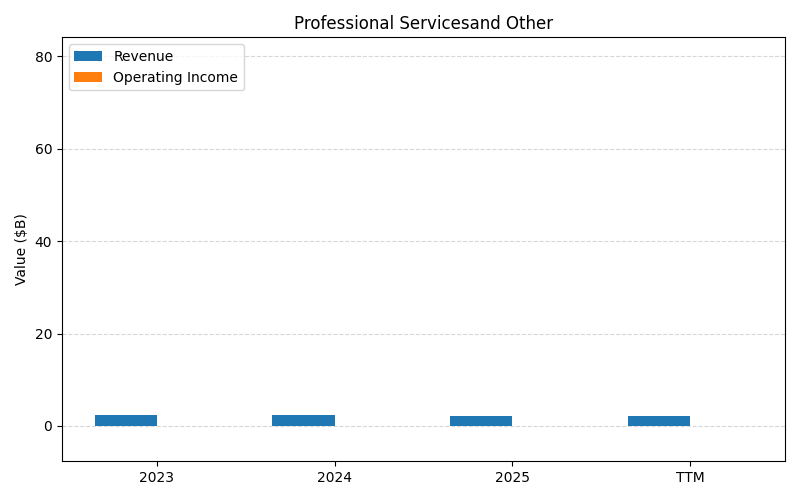
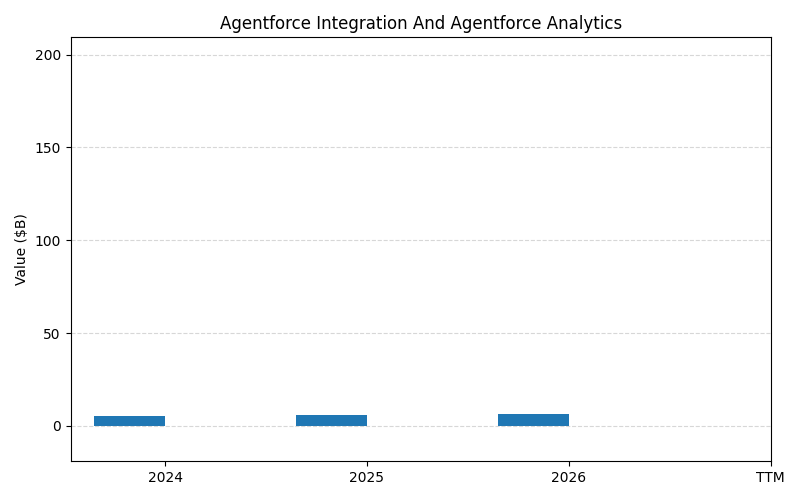
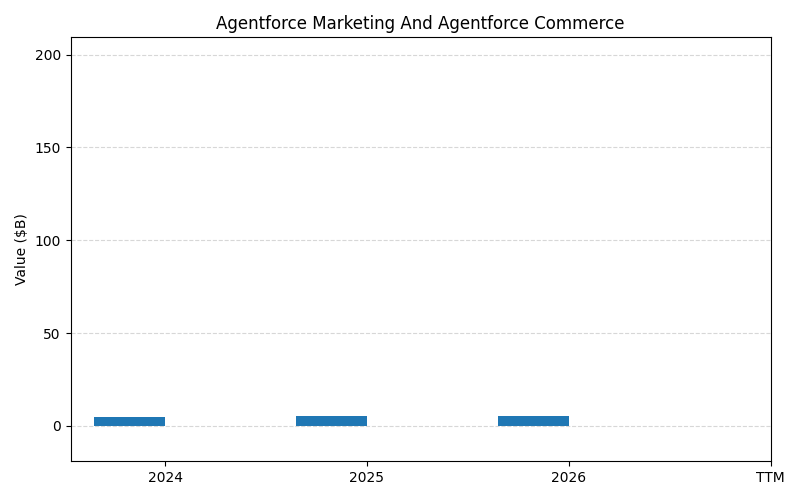

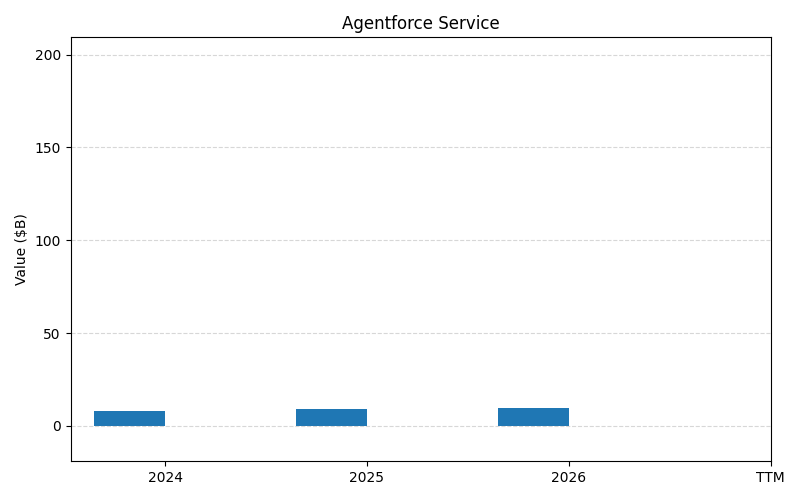
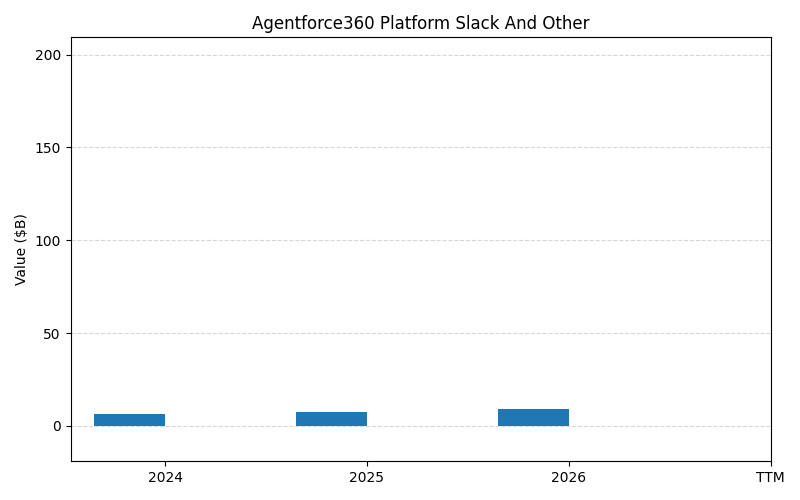
SEGMENTS v2025-09-09 · 2026-05-29 09:06 UTC — Units: $B. Rows list fiscal years (last 3 + TTM) with revenue for each segment; the final row shows the TTM revenue mix (operating income columns display “—” where mix is not applicable).
| Year | Subscriptionand Support Rev | Professional Servicesand Other Rev | Agentforce Integration And Agentforce Analytics Rev | Agentforce Marketing And Agentforce Commerce Rev | Agentforce Sales Rev | Agentforce Service Rev | Agentforce360 Platform Slack And Other Rev | Total Rev |
|---|---|---|---|---|---|---|---|---|
| 2024 | 65.1B | 2.32B | 5.19B | 4.91B | 7.58B | 8.24B | 6.61B | 99.9B |
| 2025 | 71.4B | 2.22B | 5.78B | 5.28B | 8.32B | 9.05B | 7.25B | 109.3B |
| 2026 | 79.2B | 2.14B | 6.23B | 5.43B | 9.03B | 9.82B | 8.88B | 120.7B |
| TTM | 190.3B | 5.42B | – | – | – | – | – | 195.7B |
| % of Total (TTM) | 97.2% | 2.8% | – | – | – | – | – | 100% |
Balance Sheet
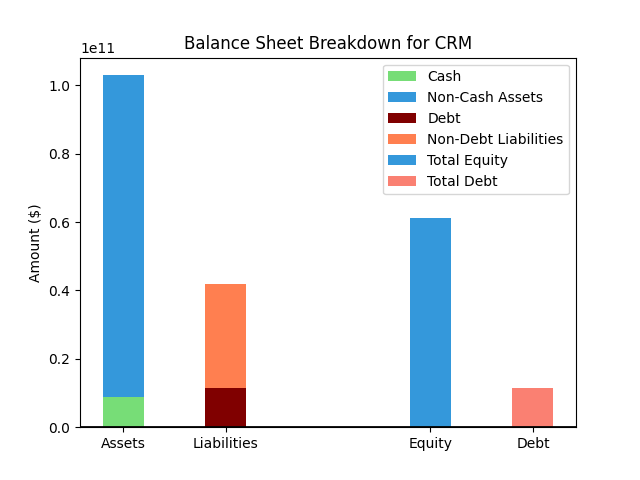
| Metric | Value | |
|---|---|---|
| 0 | Total Assets | $112,305M |
| 1 | Cash | $7,327M |
| 2 | Total Liabilities | $53,163M |
| 3 | Total Debt | $17,176M |
| 4 | Total Equity | $59,142M |
| 5 | Debt to Equity Ratio | 0.29 |
EPS & Dividend
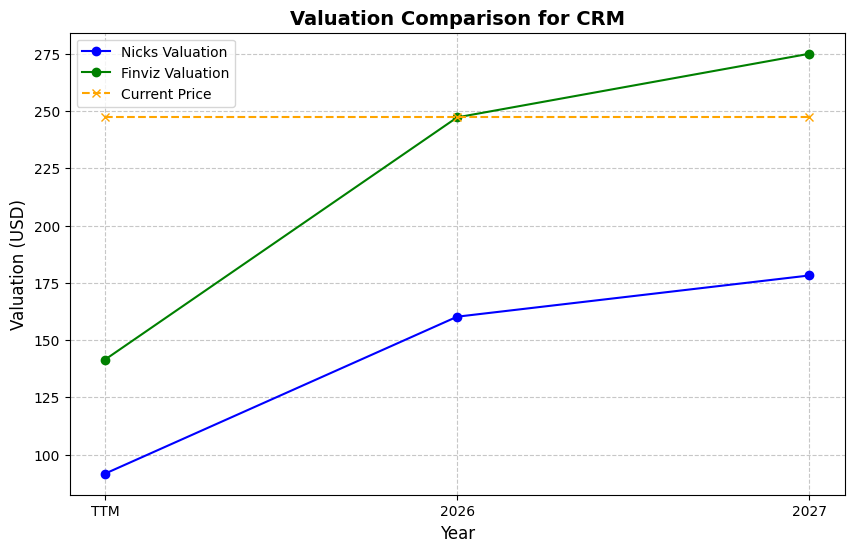
Valuation
| Share Price | Treasury Yield | Estimates | Fair Value (P/E) | Fair Value (P/S) | Current P/S | Current P/E |
|---|---|---|---|---|---|---|
| $191.10 | 4.5% | Nicks Growth: 8% Nick's Expected Margin: 11% FINVIZ Growth: 13% |
Nicks: 14 Finviz: 22 |
Nick's: 1.559 | 4.9 | 22.1 |
| Basis | Year | Nicks Valuation | Nicks vs Share Price | Finviz Valuation | Finviz vs Share Price |
|---|---|---|---|---|---|
| $8.63 EPS | TTM | $122.29 | -36.0% | $188.17 | -1.5% |
| $14.16 EPS | 2027 | $200.71 | 5.0% | $308.85 | 61.6% |
| $15.48 EPS | 2028 | $219.36 | 14.8% | $337.53 | 76.6% |
Implied Growth
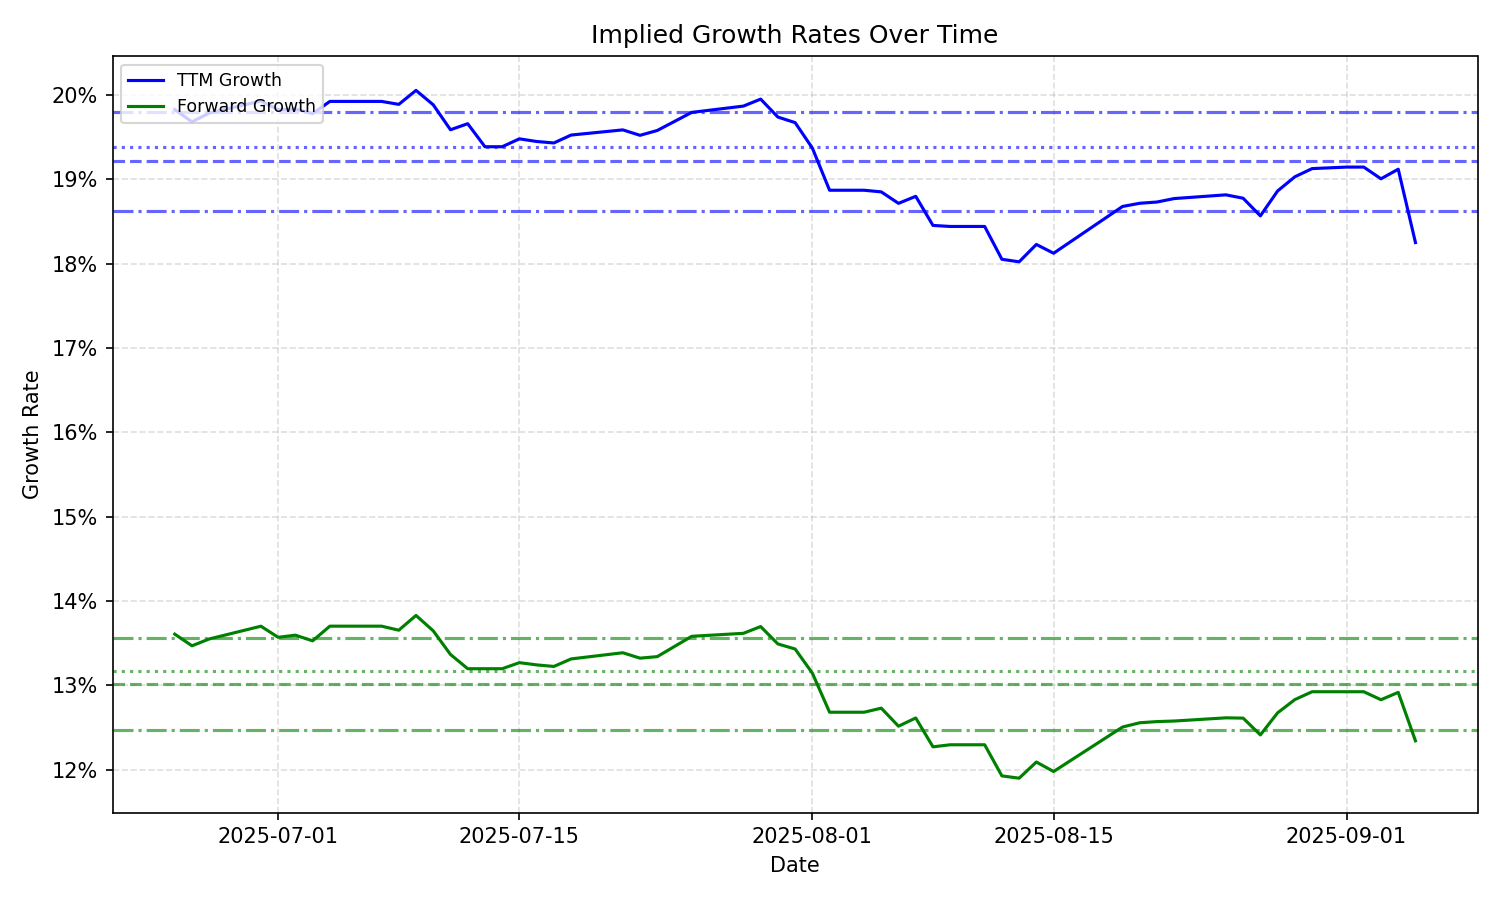
| Average | Median | Std Dev | Current | Percentile | ||||||
|---|---|---|---|---|---|---|---|---|---|---|
| TTM | Forward | TTM | Forward | TTM | Forward | TTM | Forward | TTM | Forward | |
| Timeframe | ||||||||||
| 1 Year | 17.67% | 11.84% | 17.65% | 12.29% | 1.67% | 1.79% | 11.85% | 5.76% | 0.6% | 1.2% |
| 3 Years | 17.67% | 11.84% | 17.65% | 12.29% | 1.67% | 1.79% | 11.85% | 5.76% | 0.6% | 1.2% |
| 5 Years | 17.67% | 11.84% | 17.65% | 12.29% | 1.67% | 1.79% | 11.85% | 5.76% | 0.6% | 1.2% |
| 10 Years | 17.67% | 11.84% | 17.65% | 12.29% | 1.67% | 1.79% | 11.85% | 5.76% | 0.6% | 1.2% |