Coinbase Global, Inc. — COIN
| Close Price | Market Cap | P/E Ratio | Forward P/E Ratio | Implied Growth* | Implied Forward Growth* | Dividend | P/B Ratio |
|---|---|---|---|---|---|---|---|
| $189.03 | $49.80B | 69.5 | 38.2 | 25.8% | 18.8% | - | 3.7 |
Latest Headlines
- · Coinbase, Robinhood Stocks Soar as Regulator Permits Crypto Perpetual Futures for U.S.
- · Dimon Slams Coinbase’s Armstrong in Tense Crypto Bill Fight
- · Wintermute Enters Prediction Markets as Event Contract Trading Tops $60B
- · CONY’s 100% Yield Hides a 37% Decline That Distributions Cannot Reverse
- · 3 of Wall Street’s Favorite Stocks on Our Watchlist
- · Coinbase to Expand Global Fiat Access With Standard Chartered?
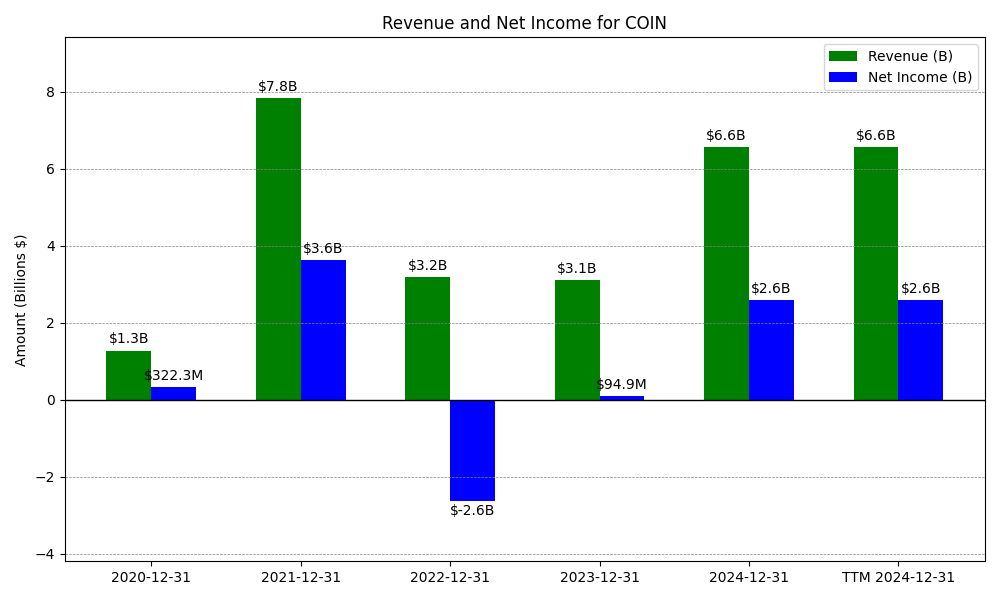
Revenue & Net Income
| Date | Revenue | Net_Income | EPS | Last_Updated | Revenue_Change | Net_Income_Change | EPS_Change | |
|---|---|---|---|---|---|---|---|---|
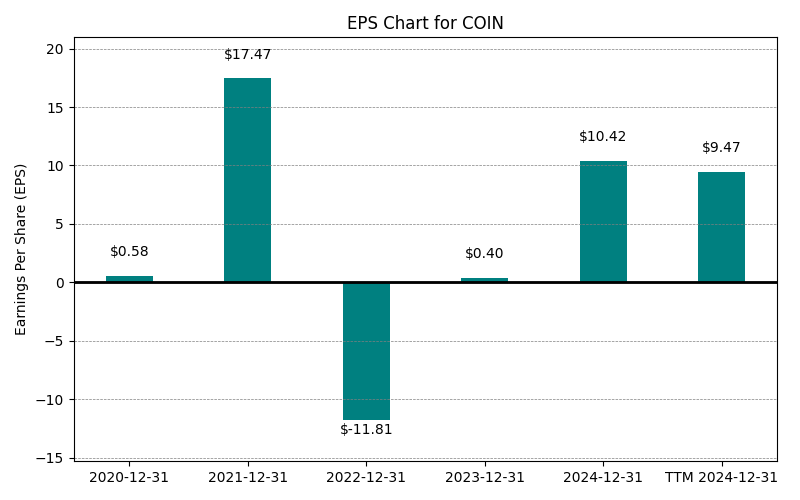
| 0 | 2020-12-31 | $1,277M | $322M | $0.58 | 2024-02-03 03:17:10 | N/A | N/A | N/A |
| 1 | 2021-12-31 | $7,839M | $3,624M | $17.47 | 2026-02-13 08:35:34 | 513.7% | 1024.4% | 2901.4% |
| 2 | 2022-12-31 | $3,194M | $-2,625M | $-11.81 | 2026-05-29 09:06:40 | -59.3% | -172.4% | -167.6% |
| 3 | 2023-12-31 | $3,108M | $95M | $0.40 | 2026-05-29 09:06:40 | -2.7% | -103.6% | -103.4% |
| 4 | 2024-12-31 | $6,564M | $2,579M | $10.42 | 2026-05-29 09:06:40 | 111.2% | 2618.5% | 2505.0% |
| 5 | 2025-12-31 | $7,181M | $1,260M | $4.85 | 2026-05-29 09:06:40 | 9.4% | -51.1% | -53.5% |
| 6 | TTM 2026-03-31 | $6,560M | $801M | $2.72 | 2026-05-11 09:06:53 | -8.7% | -36.5% | -43.9% |
EPS
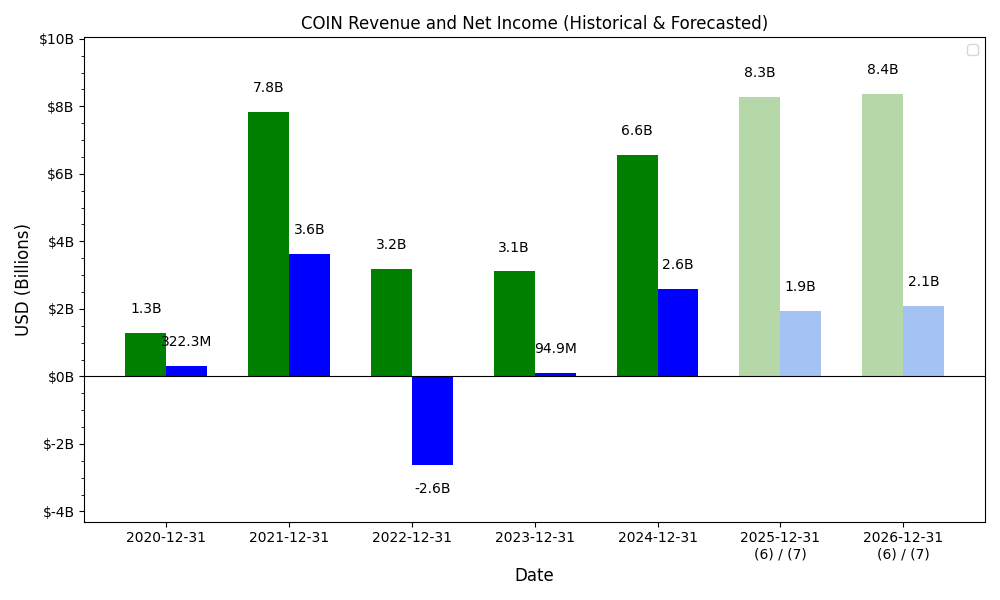
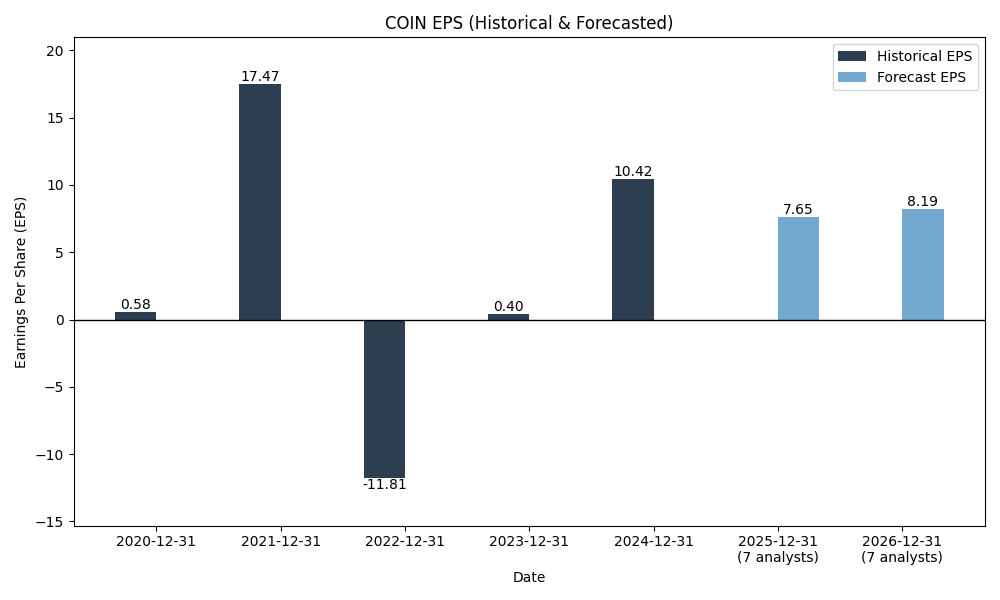
Forecasts
Y/Y % Change
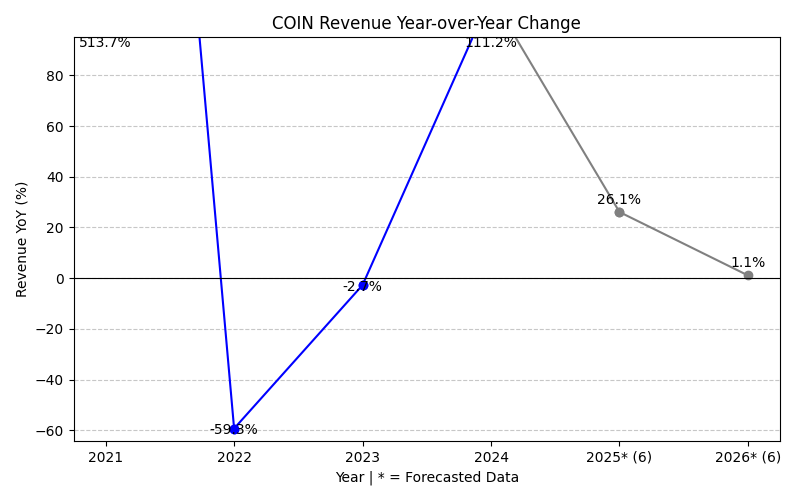
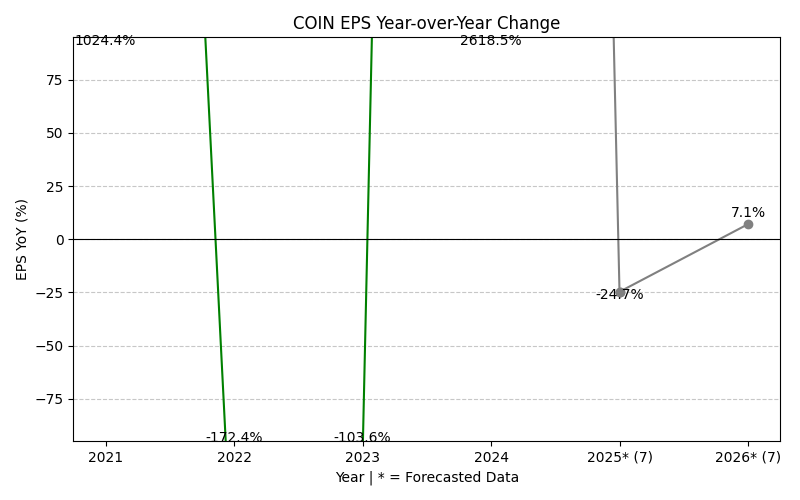
COIN Year-over-Year Growth
| 2020 | 2021 | 2022 | 2023 | 2024 | 2025 | 2026 | 2027 | Average | |
|---|---|---|---|---|---|---|---|---|---|
| Revenue Growth (%) | 513.7% | -59.3% | -2.7% | 111.2% | 9.4% | -14.3% | 26.4% | 83.5% | |
| Revenue Analysts (#) | 0 | 0 | 0 | 0 | 0 | 0 | 28 | 27 | |
| EPS Growth (%) | 1024.4% | -172.4% | -103.6% | 2618.5% | -51.1% | -74.4% | 304.7% | 506.6% | |
| EPS Analysts (#) | 0 | 0 | 0 | 0 | 0 | 0 | 15 | 21 |
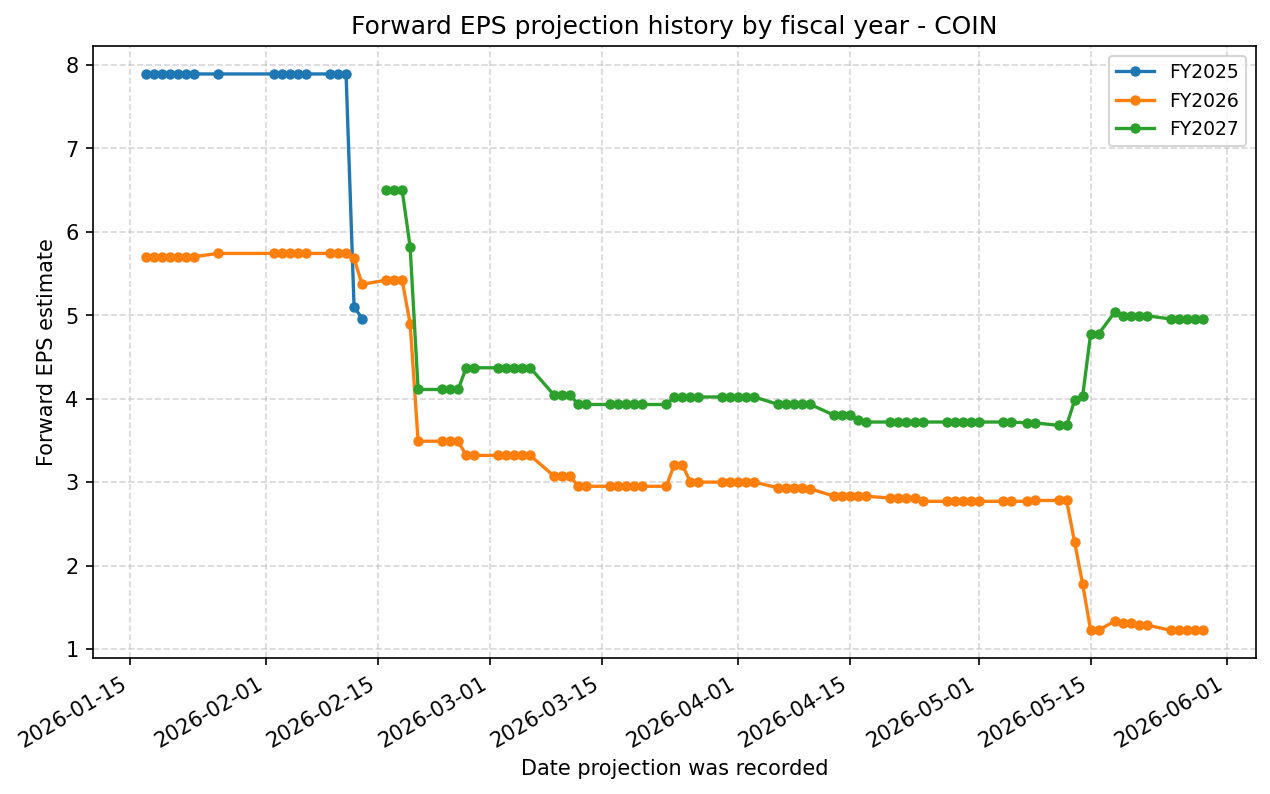
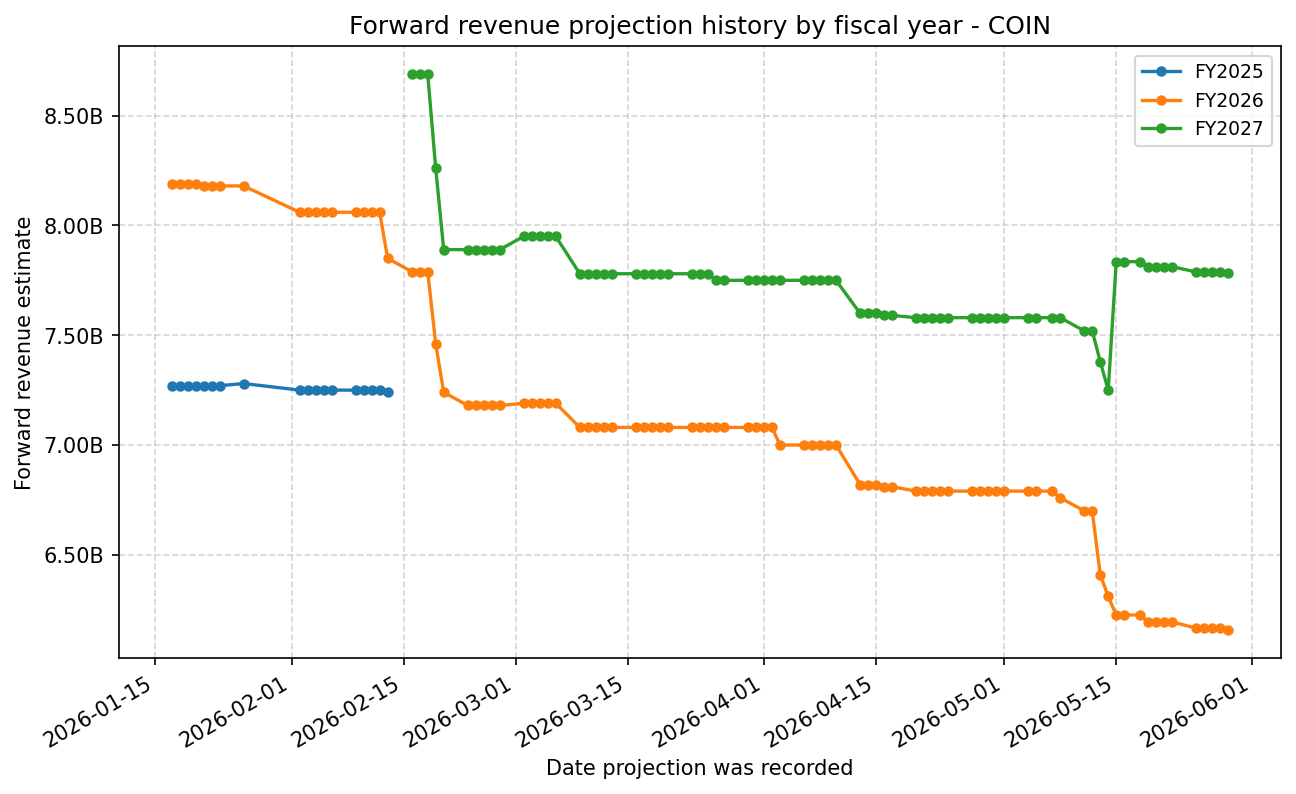
Forward Estimate History
How the next-FY EPS and revenue estimates have drifted over time. One line per fiscal year – past lines end when that FY became current.
Expenses
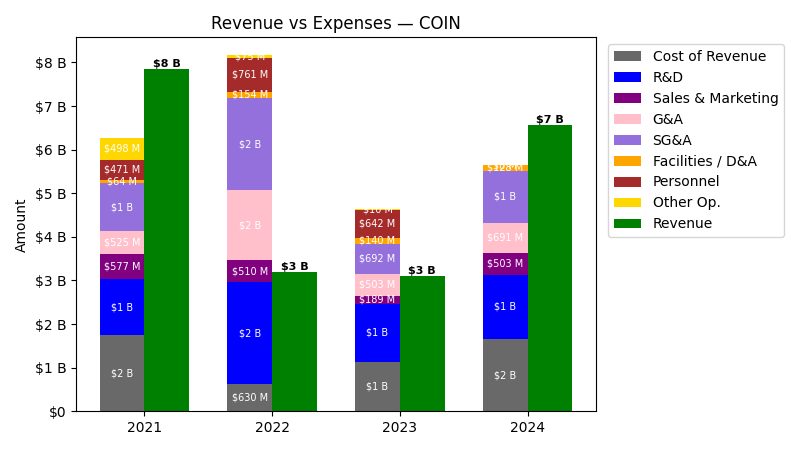
| Year | Revenue ($) | Cost of Revenue ($) | R&D ($) | Sales & Marketing ($) | G&A ($) | SG&A ($) | Facilities / D&A ($) | Personnel ($) |
|---|---|---|---|---|---|---|---|---|
| 2022 | $3.2B | $475.8M | $2.3B | $510.1M | $1.6B | $2.1B | $154.1M | $760.8M |
| 2023 | $3.1B | $995.9M | $1.3B | $188.6M | $503.2M | $691.8M | $139.6M | $642.4M |
| 2024 | $6.6B | $1.5B | $1.5B | $503.4M | $693.7M | $1.2B | $127.5M | $0.0 |
| 2025 | $7.2B | $1.6B | $1.7B | $922.3M | $954.9M | $1.9B | $188.4M | $0.0 |
| TTM | $6.6B | $1.5B | $1.8B | $935.9M | $909.4M | $1.8B | $223.1M | $0.0 |
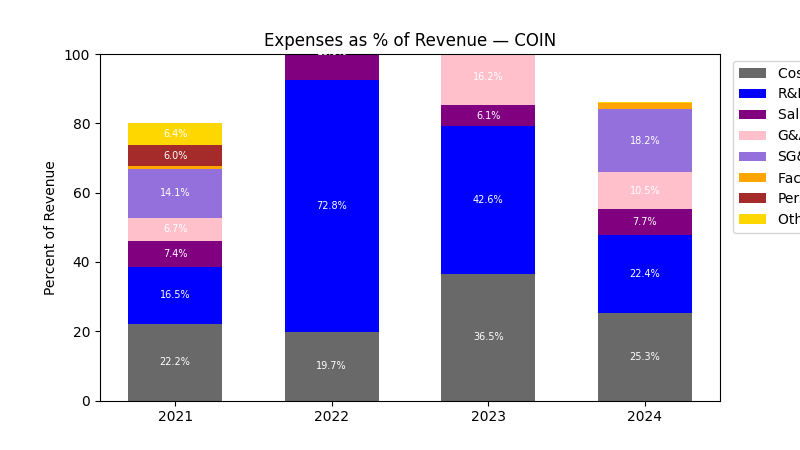
| Year | Revenue Change (%) | Cost of Revenue Change (%) | R&D Change (%) | Sales & Marketing Change (%) | G&A Change (%) | SG&A Change (%) | Facilities / D&A Change (%) | Personnel Change (%) |
|---|---|---|---|---|---|---|---|---|
| 2023 | -2.69 | 109.31 | -43.06 | -63.04 | -68.56 | -67.22 | -9.36 | -15.57 |
| 2024 | 111.17 | 53.41 | 10.85 | 166.99 | 37.85 | 73.05 | -8.68 | -100.00 |
| 2025 | 9.40 | 6.87 | 13.78 | 83.22 | 37.65 | 56.81 | 47.77 | NaN |
| TTM | -8.65 | -6.66 | 10.19 | 1.47 | -4.76 | -1.70 | 18.40 | NaN |
No unmapped expenses.
Segment Performance
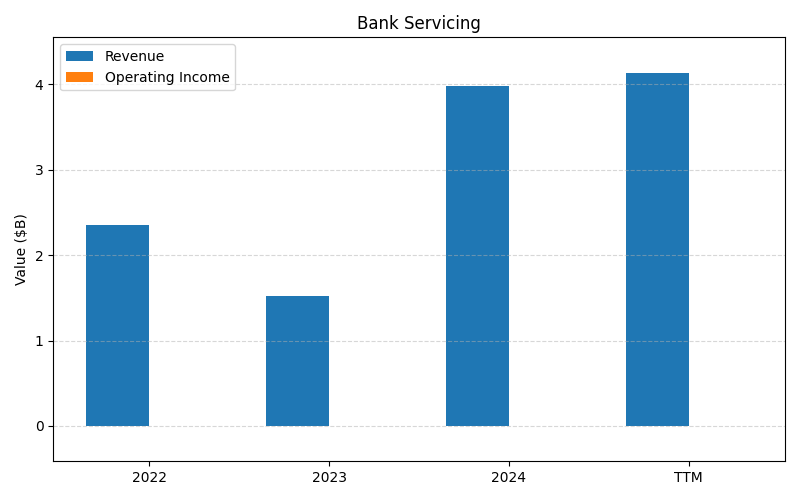
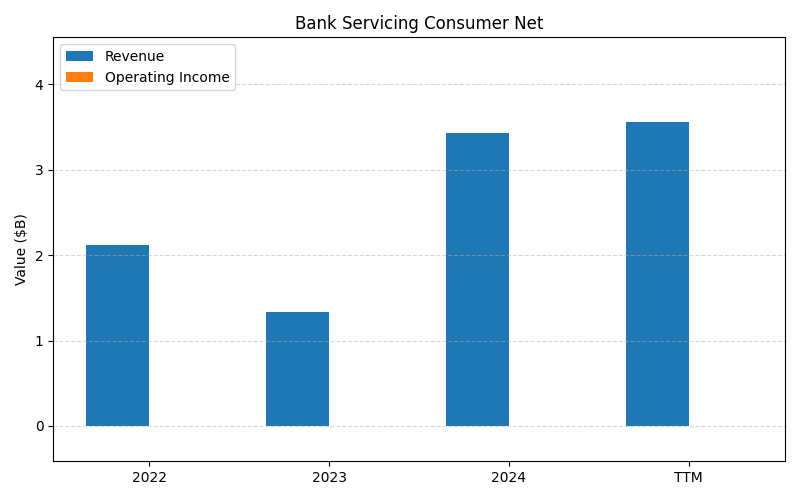
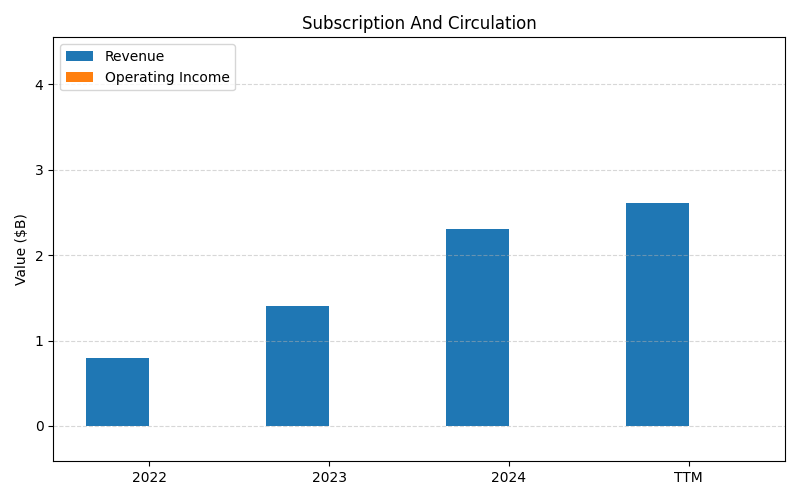
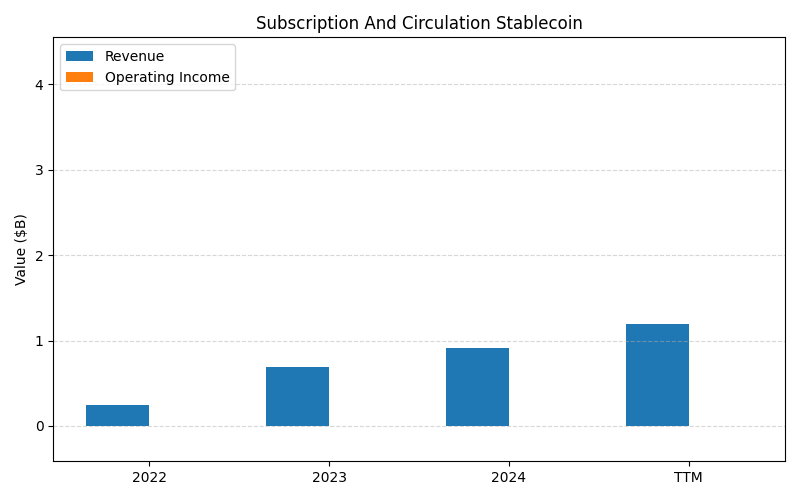
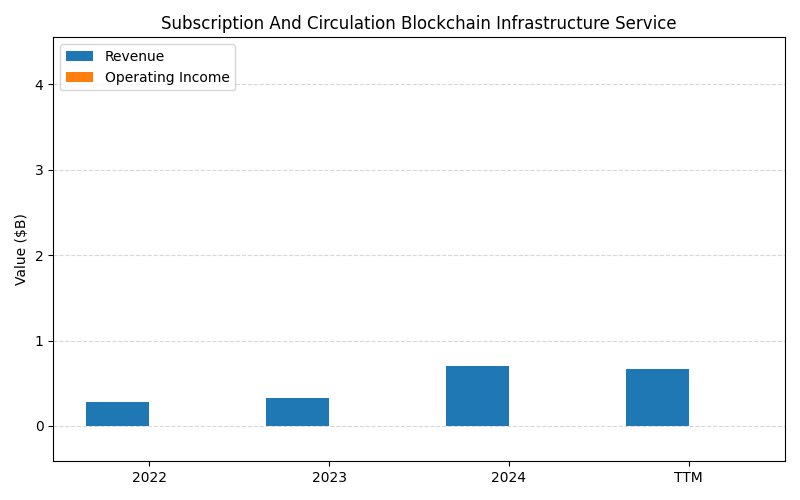
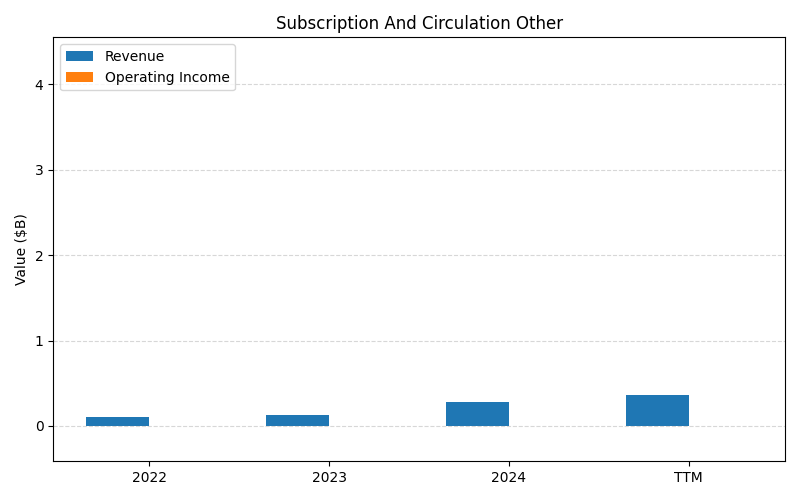
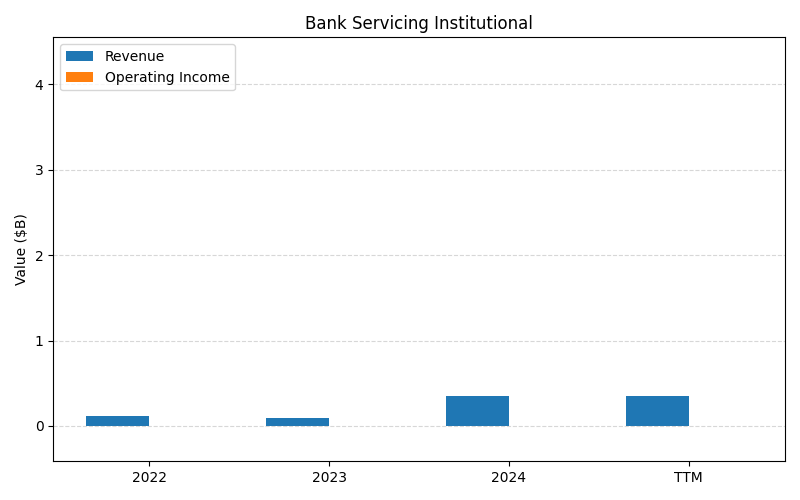
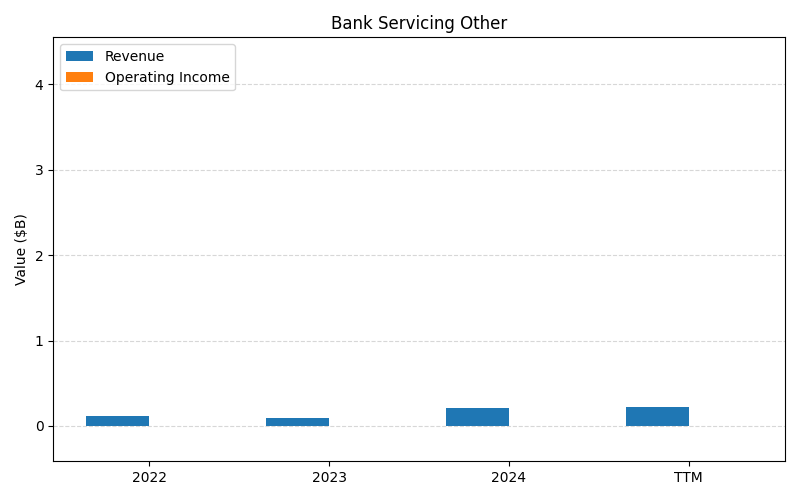
SEGMENTS v2025-09-09 · 2026-05-29 09:06 UTC — Units: $B. Rows list fiscal years (last 3 + TTM) with revenue for each segment; the final row shows the TTM revenue mix (operating income columns display “—” where mix is not applicable).
| Year | Bank Servicing Rev | Bank Servicing Consumer Net Rev | Subscription And Circulation Rev | Subscription And Circulation Stablecoin Rev | Subscription And Circulation Blockchain Infrastructure Service Rev | Subscription And Circulation Other Rev | Bank Servicing Institutional Rev | Bank Servicing Other Rev | Total Rev |
|---|---|---|---|---|---|---|---|---|---|
| 2023 | 1.52B | 1.33B | 1.41B | 0.69B | 0.33B | 0.20B | 0.09B | 0.10B | 5.67B |
| 2024 | 3.99B | 3.43B | 2.31B | 0.91B | 0.71B | 0.43B | 0.35B | 0.21B | 12.3B |
| 2025 | 4.06B | 3.32B | 2.83B | 1.35B | 0.68B | 0.55B | 0.48B | 0.25B | 13.5B |
| TTM | 10.1B | 8.42B | 6.39B | 2.84B | 1.68B | 1.23B | 1.06B | 0.58B | 32.3B |
| % of Total (TTM) | 31.2% | 26.1% | 19.8% | 8.8% | 5.2% | 3.8% | 3.3% | 1.8% | 100% |
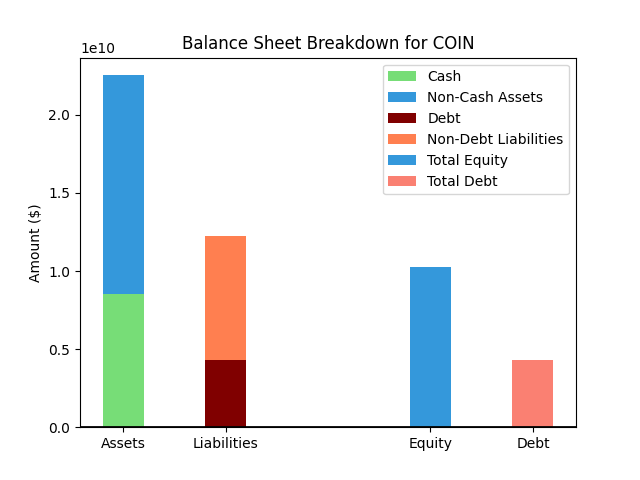
Balance Sheet
| Metric | Value | |
|---|---|---|
| 0 | Total Assets | $28,849M |
| 1 | Cash | $10,205M |
| 2 | Total Liabilities | $15,368M |
| 3 | Total Debt | $7,964M |
| 4 | Total Equity | $13,481M |
| 5 | Debt to Equity Ratio | 0.59 |
EPS & Dividend

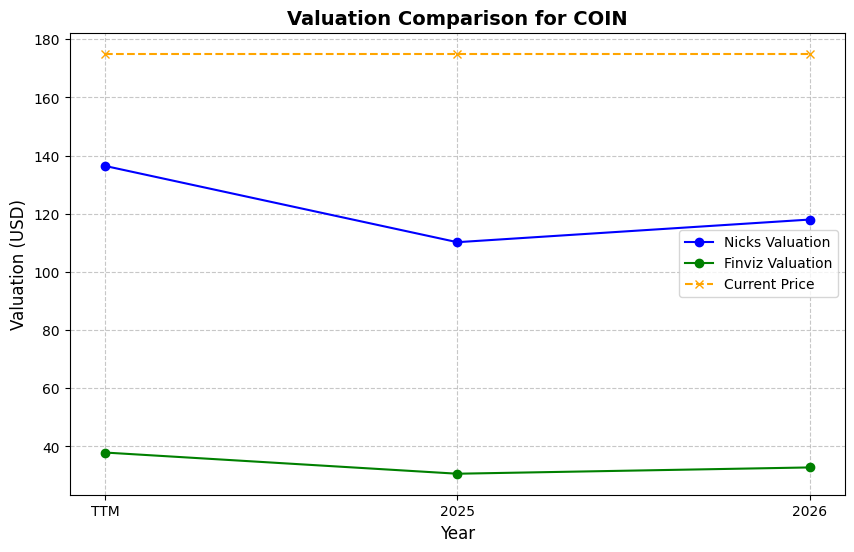
Valuation
| Share Price | Treasury Yield | Estimates | Fair Value (P/E) | Fair Value (P/S) | Current P/S | Current P/E |
|---|---|---|---|---|---|---|
| $189.03 | 4.5% | Nicks Growth: 8% Nick's Expected Margin: 10% FINVIZ Growth: 13% |
Nicks: 14 Finviz: 23 |
Nick's: 1.417 | 7.6 | 69.5 |
| Basis | Year | Nicks Valuation | Nicks vs Share Price | Finviz Valuation | Finviz vs Share Price |
|---|---|---|---|---|---|
| $2.72 EPS | TTM | $38.54 | -79.6% | $62.05 | -67.2% |
| $1.22 EPS | 2026 | $17.35 | -90.8% | $27.93 | -85.2% |
| $4.95 EPS | 2027 | $70.21 | -62.9% | $113.03 | -40.2% |
Implied Growth
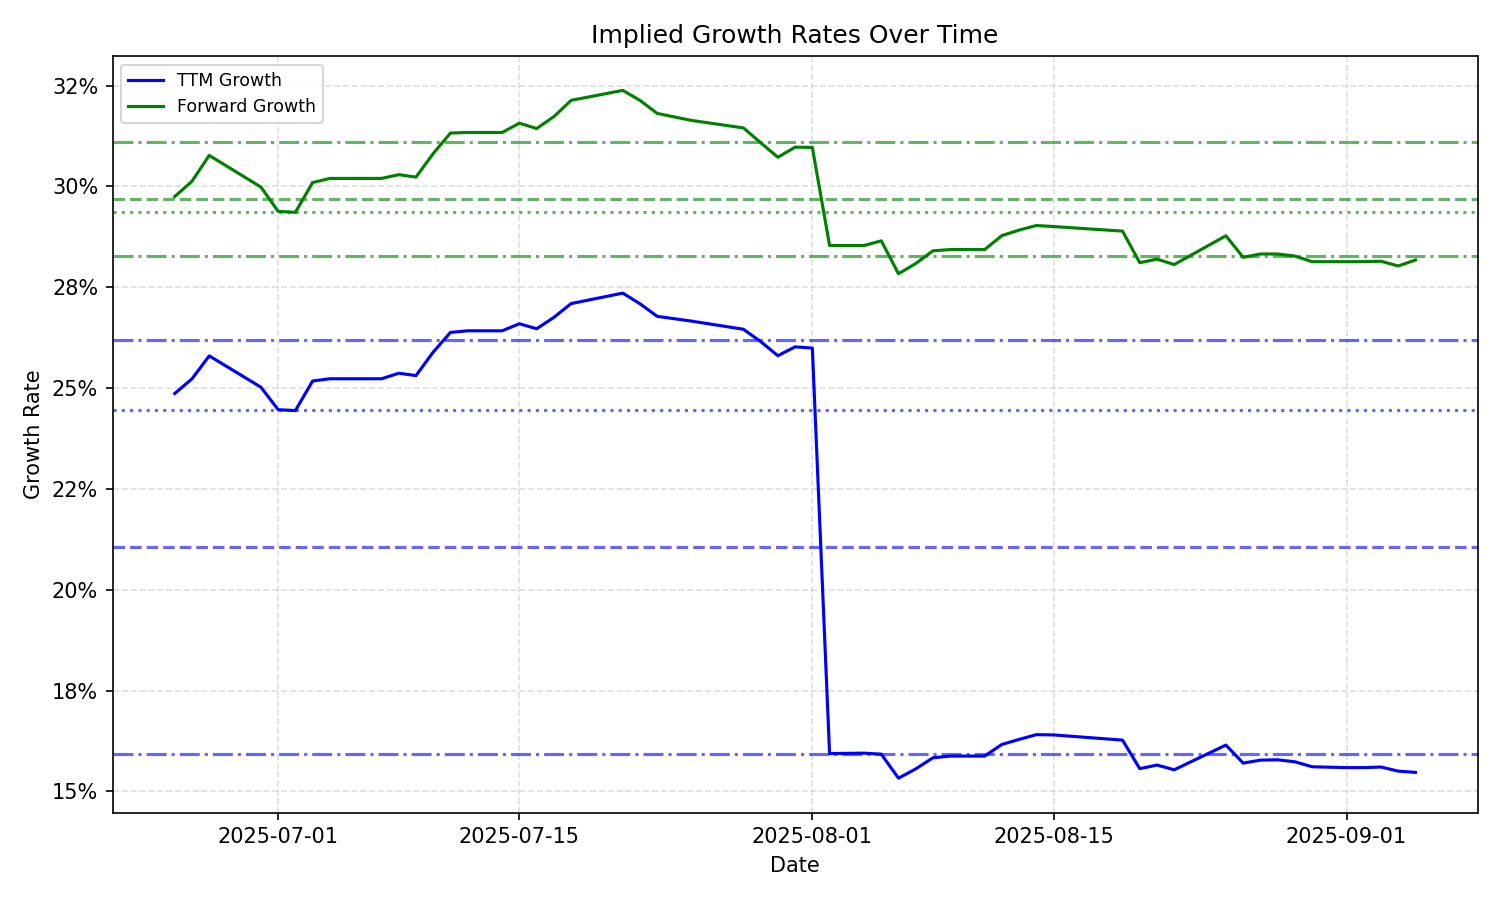
| Average | Median | Std Dev | Current | Percentile | ||||||
|---|---|---|---|---|---|---|---|---|---|---|
| TTM | Forward | TTM | Forward | TTM | Forward | TTM | Forward | TTM | Forward | |
| Timeframe | ||||||||||
| 1 Year | 17.89% | 23.57% | 16.79% | 26.20% | 4.97% | 6.09% | 25.41% | 18.37% | 86.2% | 33.9% |
| 3 Years | 17.89% | 23.57% | 16.79% | 26.20% | 4.97% | 6.09% | 25.41% | 18.37% | 86.2% | 33.9% |
| 5 Years | 17.89% | 23.57% | 16.79% | 26.20% | 4.97% | 6.09% | 25.41% | 18.37% | 86.2% | 33.9% |
| 10 Years | 17.89% | 23.57% | 16.79% | 26.20% | 4.97% | 6.09% | 25.41% | 18.37% | 86.2% | 33.9% |