Chipotle Mexican Grill, Inc. — CMG
| Close Price | Market Cap | P/E Ratio | Forward P/E Ratio | Implied Growth* | Implied Forward Growth* | Dividend | P/B Ratio |
|---|---|---|---|---|---|---|---|
| $31.86 | $40.87B | 29.2 | 23.5 | 15.8% | 13.4% | - | 17.0 |
Latest Headlines
- · Can Sweetgreen's New Strategy Chief Reframe SG's Turnaround Narrative for Investors?
- · Why Is Chipotle (CMG) Down 4.6% Since Last Earnings Report?
- · Chipotle's menu adds a trendy ingredient
- · Blaze Pizza Named to Fast Casual’s Prestigious Top 100 Movers & Shakers List
- · CHIPOTLE'S "SUMMER OF EXTRAS" RETURNS, WITH STREAK-BASED REWARDS AND LOCAL RANKINGS TO GAMIFY THE REWARDS EXPERIENCE
- · How Chipotle’s rewards relaunch extends reach of its marketing flywheel
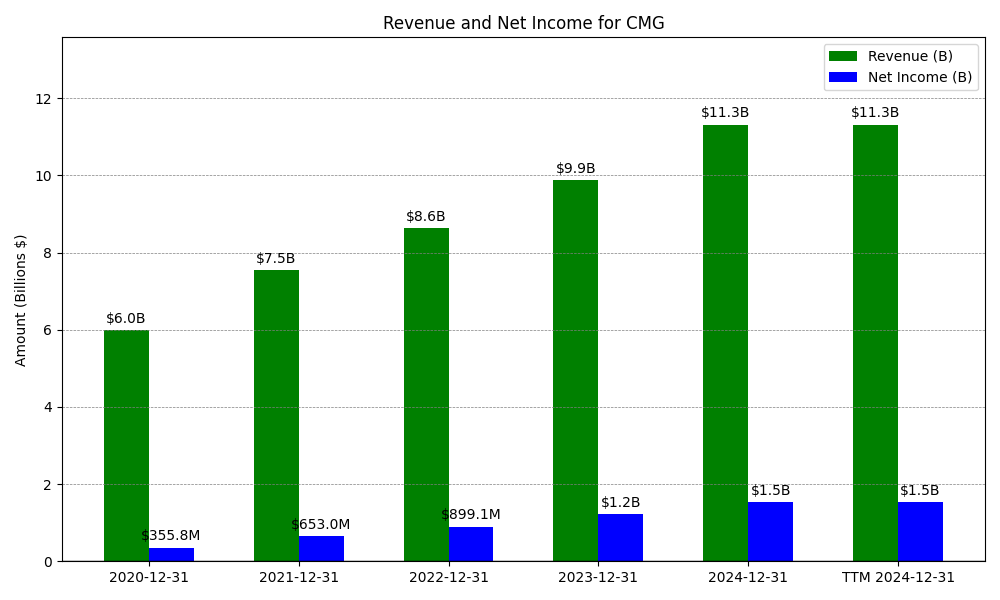
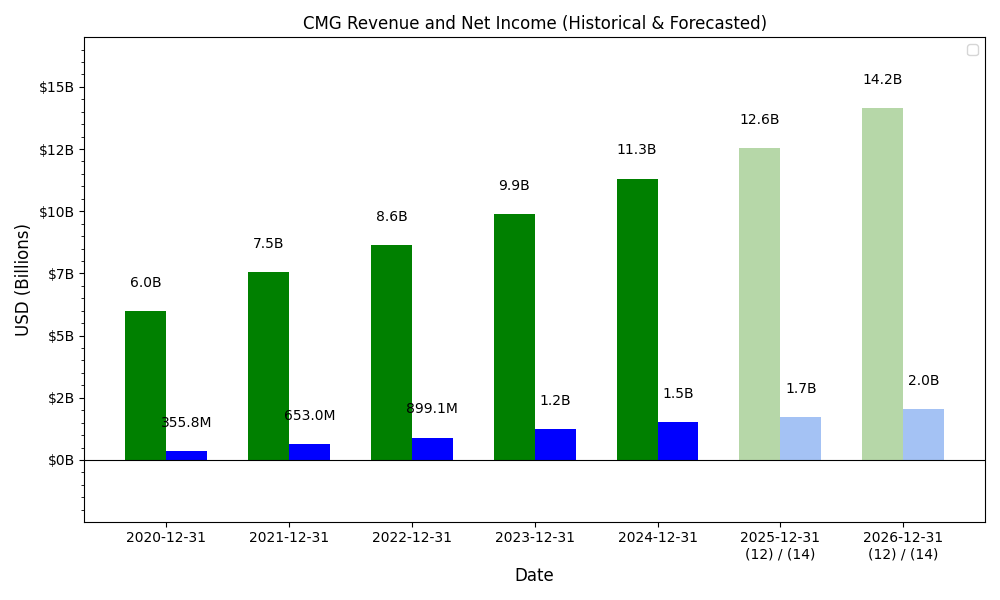
Revenue & Net Income
| Date | Revenue | Net_Income | EPS | Last_Updated | Revenue_Change | Net_Income_Change | EPS_Change | |
|---|---|---|---|---|---|---|---|---|
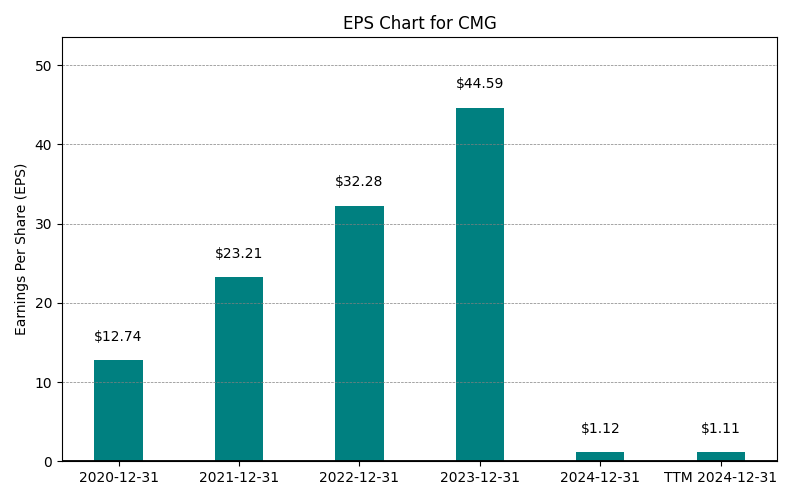
| 0 | 2020-12-31 | $5,985M | $356M | $12.74 | 2024-02-03 03:17:10 | N/A | N/A | N/A |
| 1 | 2021-12-31 | $7,547M | $653M | $0.65 | 2026-02-06 08:33:06 | 26.1% | 83.5% | -94.9% |
| 2 | 2022-12-31 | $8,635M | $899M | $0.65 | 2026-05-29 09:06:35 | 14.4% | 37.7% | 0.0% |
| 3 | 2023-12-31 | $9,872M | $1,229M | $0.89 | 2026-05-29 09:06:35 | 14.3% | 36.7% | 38.1% |
| 4 | 2024-12-31 | $11,314M | $1,534M | $1.12 | 2026-05-29 09:06:35 | 14.6% | 24.9% | 25.6% |
| 5 | 2025-12-31 | $11,926M | $1,536M | $1.15 | 2026-05-29 09:06:35 | 5.4% | 0.1% | 2.7% |
| 6 | TTM 2026-03-31 | $12,139M | $1,452M | $1.09 | 2026-05-01 08:39:44 | 1.8% | -5.5% | -5.2% |
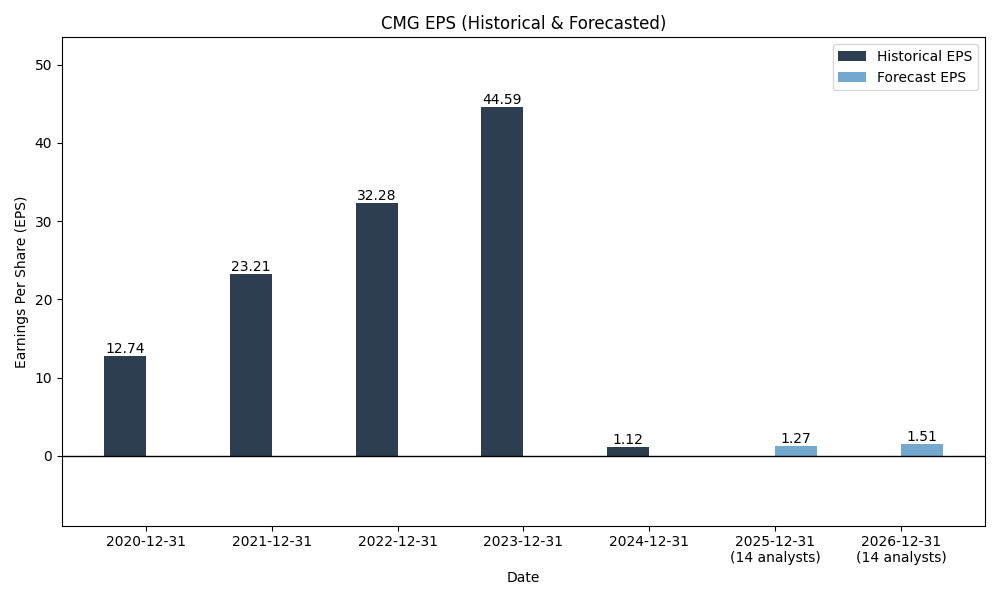
EPS
Forecasts
Y/Y % Change
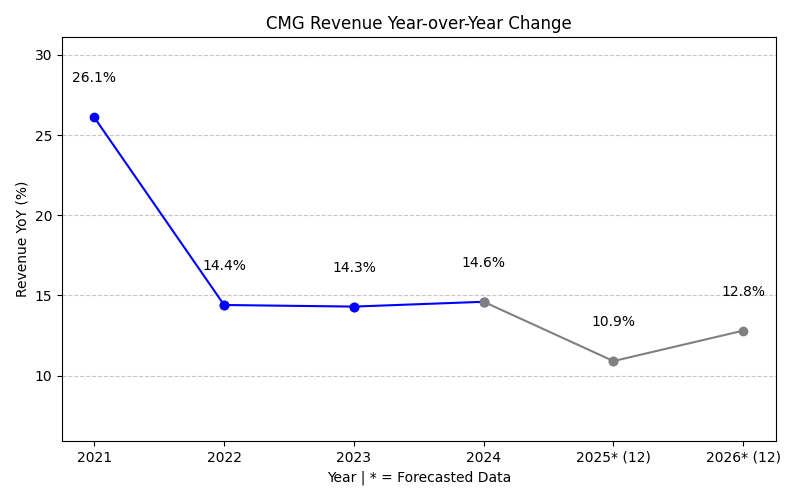
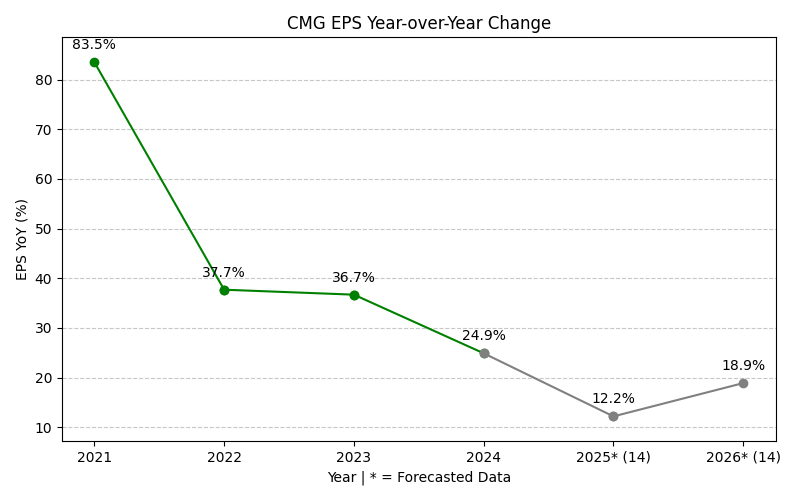
CMG Year-over-Year Growth
| 2020 | 2021 | 2022 | 2023 | 2024 | 2025 | 2026 | 2027 | Average | |
|---|---|---|---|---|---|---|---|---|---|
| Revenue Growth (%) | 26.1% | 14.4% | 14.3% | 14.6% | 5.4% | 8.8% | 10.8% | 13.5% | |
| Revenue Analysts (#) | 0 | 0 | 0 | 0 | 0 | 0 | 35 | 35 | |
| EPS Growth (%) | 83.5% | 37.7% | 36.7% | 24.9% | 0.1% | -5.3% | 19.7% | 28.2% | |
| EPS Analysts (#) | 0 | 0 | 0 | 0 | 0 | 0 | 37 | 37 |
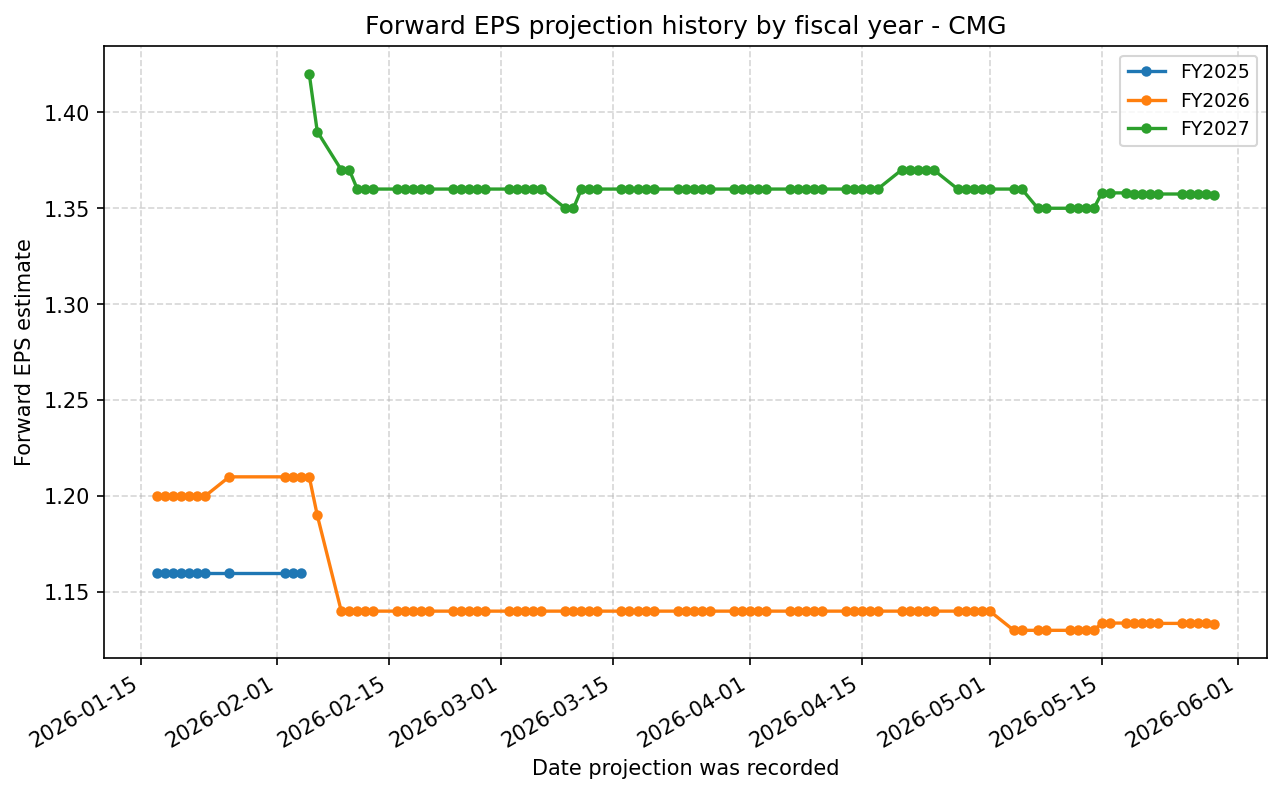
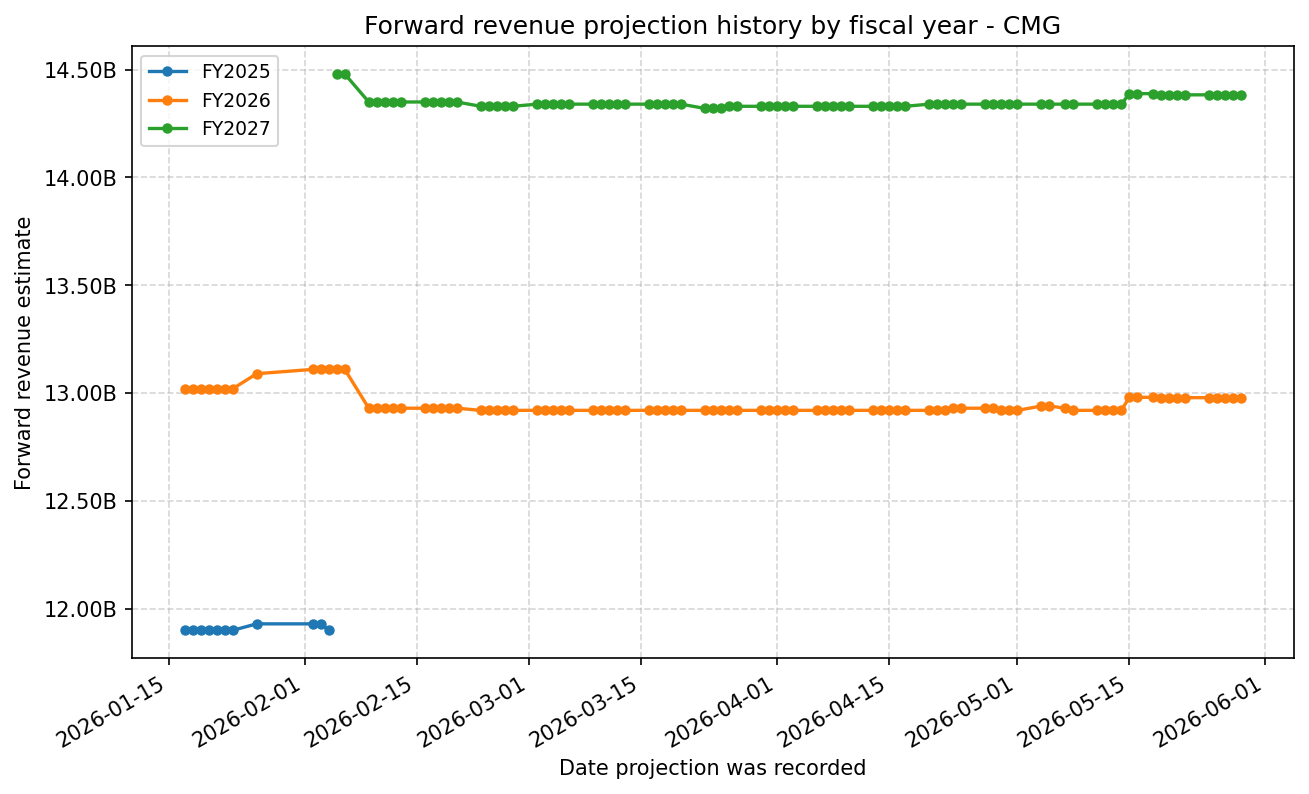
Forward Estimate History
How the next-FY EPS and revenue estimates have drifted over time. One line per fiscal year – past lines end when that FY became current.
Expenses
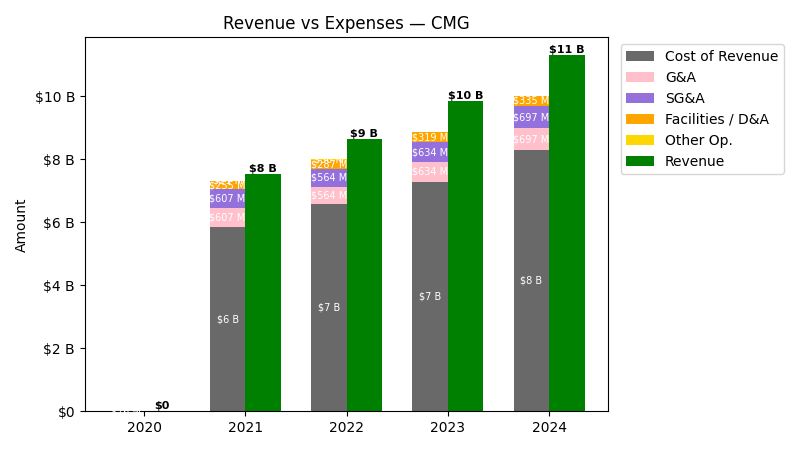
| Year | Revenue ($) | Cost of Revenue ($) | G&A ($) | SG&A ($) | Facilities / D&A ($) |
|---|---|---|---|---|---|
| 2022 | $8.6B | $6.3B | $564.2M | $564.2M | $286.8M |
| 2023 | $9.9B | $7.0B | $633.6M | $633.6M | $319.4M |
| 2024 | $11.3B | $8.0B | $697.5M | $697.5M | $335.0M |
| 2025 | $11.9B | $8.5B | $652.0M | $652.0M | $361.4M |
| TTM | $12.1B | $8.8B | $683.0M | $683.0M | $370.9M |
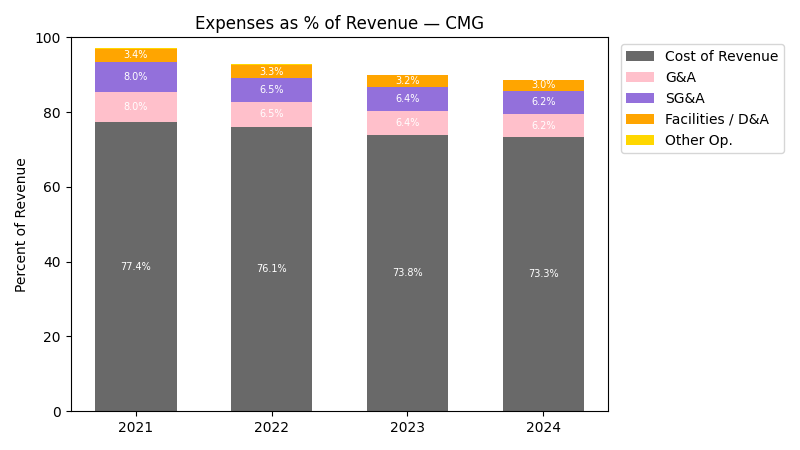
| Year | Revenue Change (%) | Cost of Revenue Change (%) | G&A Change (%) | SG&A Change (%) | Facilities / D&A Change (%) |
|---|---|---|---|---|---|
| 2023 | 14.33 | 10.83 | 12.30 | 12.30 | 11.35 |
| 2024 | 14.61 | 14.28 | 10.09 | 10.09 | 4.90 |
| 2025 | 5.41 | 7.25 | -6.52 | -6.52 | 7.87 |
| TTM | 1.79 | 2.79 | 4.74 | 4.74 | 2.63 |
No unmapped expenses.
Segment Performance
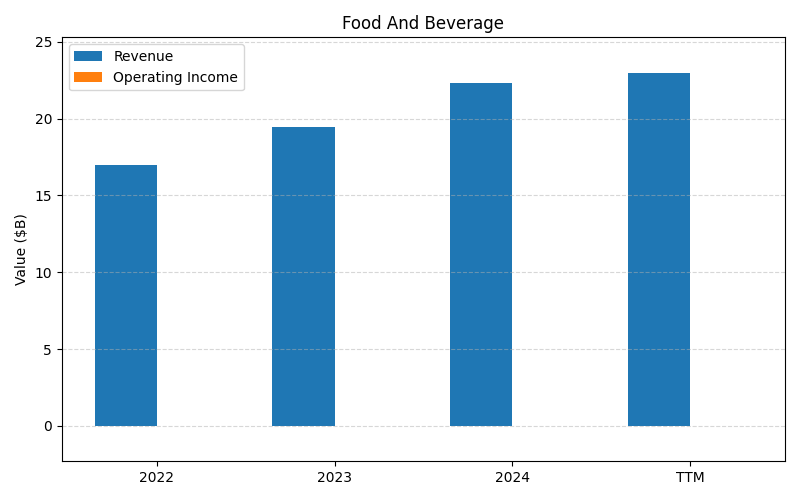
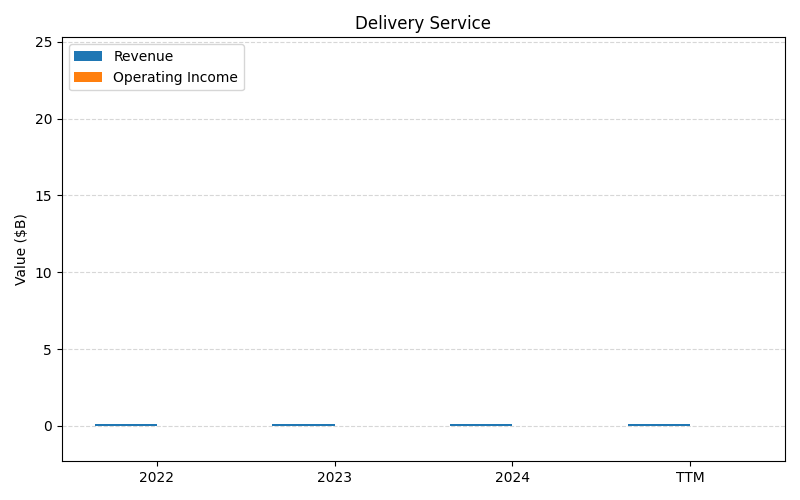
SEGMENTS v2025-09-09 · 2026-05-29 09:06 UTC — Units: $B. Rows list fiscal years (last 3 + TTM) with revenue for each segment; the final row shows the TTM revenue mix (operating income columns display “—” where mix is not applicable).
| Year | Food And Beverage Rev | Delivery Service Rev | Total Rev |
|---|---|---|---|
| 2023 | 19.5B | 0.13B | 19.6B |
| 2024 | 22.3B | 0.13B | 22.4B |
| 2025 | 23.5B | 0.12B | 23.6B |
| TTM | 57.5B | 0.31B | 57.8B |
| % of Total (TTM) | 99.5% | 0.5% | 100% |
Balance Sheet
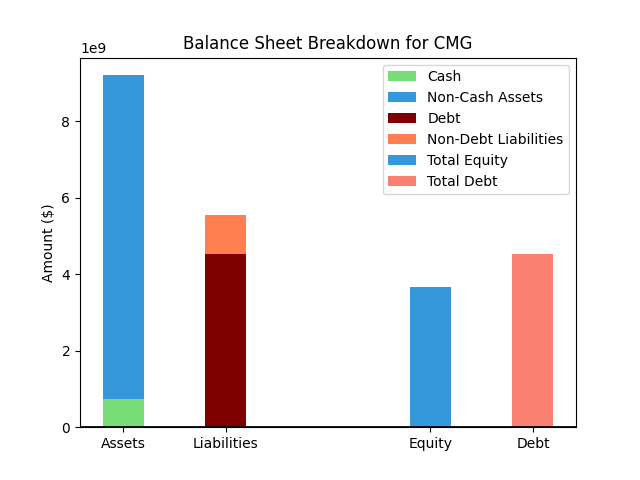
| Metric | Value | |
|---|---|---|
| 0 | Total Assets | $8,803M |
| 1 | Cash | $247M |
| 2 | Total Liabilities | $6,396M |
| 3 | Total Debt | $5,246M |
| 4 | Total Equity | $2,408M |
| 5 | Debt to Equity Ratio | 2.18 |
EPS & Dividend

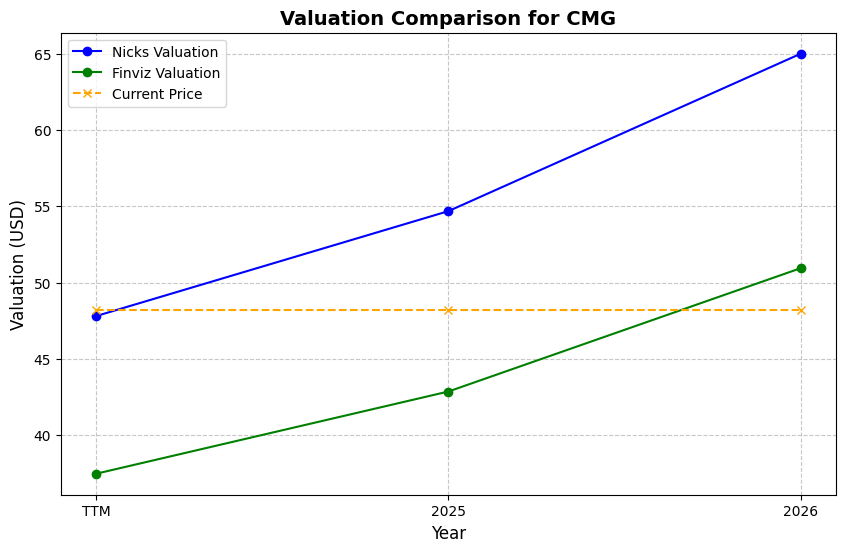
Valuation
| Share Price | Treasury Yield | Estimates | Fair Value (P/E) | Fair Value (P/S) | Current P/S | Current P/E |
|---|---|---|---|---|---|---|
| $31.86 | 4.5% | Nicks Growth: 20% Nick's Expected Margin: 13% FINVIZ Growth: 11% |
Nicks: 42 Finviz: 19 |
Nick's: 5.515 | 3.4 | 29.2 |
| Basis | Year | Nicks Valuation | Nicks vs Share Price | Finviz Valuation | Finviz vs Share Price |
|---|---|---|---|---|---|
| $1.09 EPS | TTM | $46.24 | 45.1% | $20.51 | -35.6% |
| $1.13 EPS | 2026 | $48.08 | 50.9% | $21.33 | -33.1% |
| $1.36 EPS | 2027 | $57.56 | 80.7% | $25.54 | -19.9% |
Implied Growth
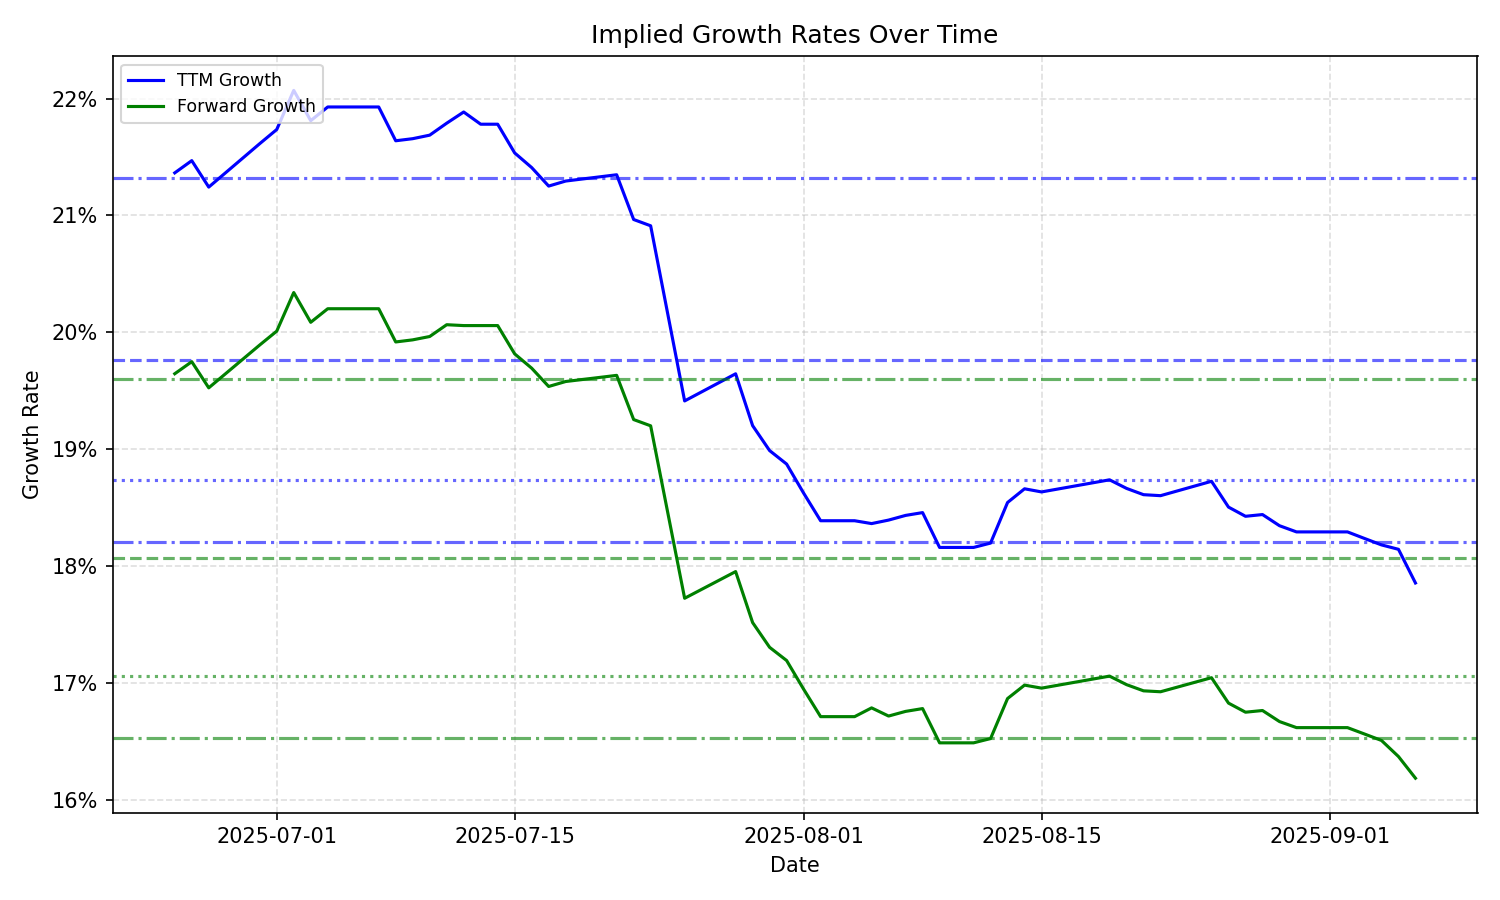
| Average | Median | Std Dev | Current | Percentile | ||||||
|---|---|---|---|---|---|---|---|---|---|---|
| TTM | Forward | TTM | Forward | TTM | Forward | TTM | Forward | TTM | Forward | |
| Timeframe | ||||||||||
| 1 Year | 17.31% | 15.58% | 17.14% | 15.76% | 1.84% | 1.96% | 15.97% | 13.54% | 27.0% | 14.8% |
| 3 Years | 17.31% | 15.58% | 17.14% | 15.76% | 1.84% | 1.96% | 15.97% | 13.54% | 27.0% | 14.8% |
| 5 Years | 17.31% | 15.58% | 17.14% | 15.76% | 1.84% | 1.96% | 15.97% | 13.54% | 27.0% | 14.8% |
| 10 Years | 17.31% | 15.58% | 17.14% | 15.76% | 1.84% | 1.96% | 15.97% | 13.54% | 27.0% | 14.8% |