Celsius Holdings, Inc. — CELH
| Close Price | Market Cap | P/E Ratio | Forward P/E Ratio | Implied Growth* | Implied Forward Growth* | Dividend | P/B Ratio |
|---|---|---|---|---|---|---|---|
| $33.27 | $8.51B | 77.4 | 16.4 | 27.2% | 9.5% | - | 6.8 |
Latest Headlines
- · Celsius (CELH): Buy, Sell, or Hold Post Q1 Earnings?
- · Coca-Cola vs. Celsius: Which Consumer Goods Stock Is a Better Buy in 2026?
- · 1 Stock Under $50 for Long-Term Investors and 2 That Underwhelm
- · A Look At Celsius Holdings (CELH) Valuation After Recent Share Price Weakness
- · 2 Small-Cap Stocks with Solid Fundamentals and 1 We Turn Down
- · Barfresh: Q1 Revenue Beats Expectations Amid Customer Recovery – Quarterly Update Report
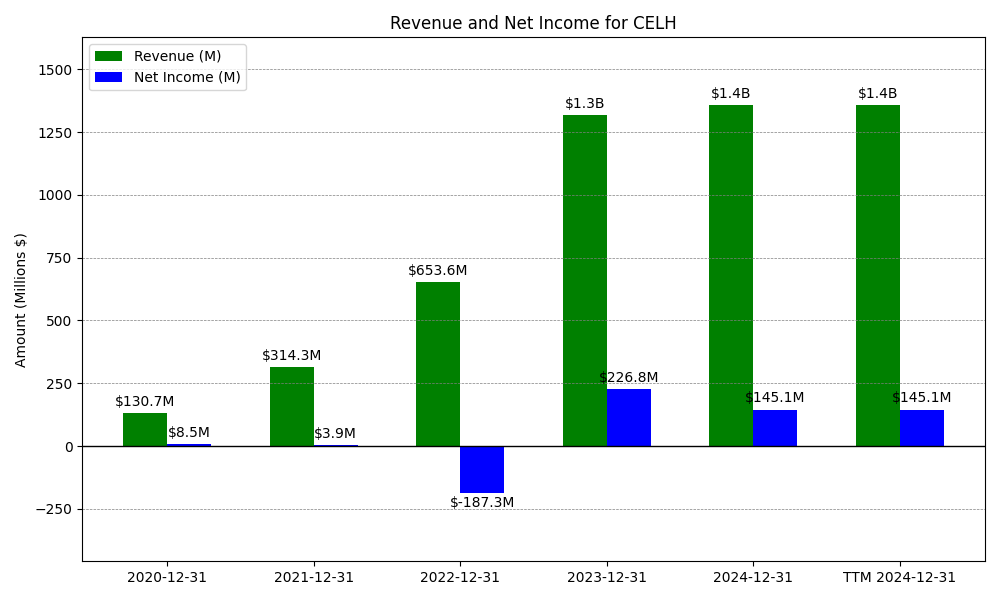
Revenue & Net Income
| Date | Revenue | Net_Income | EPS | Last_Updated | Revenue_Change | Net_Income_Change | EPS_Change | |
|---|---|---|---|---|---|---|---|---|
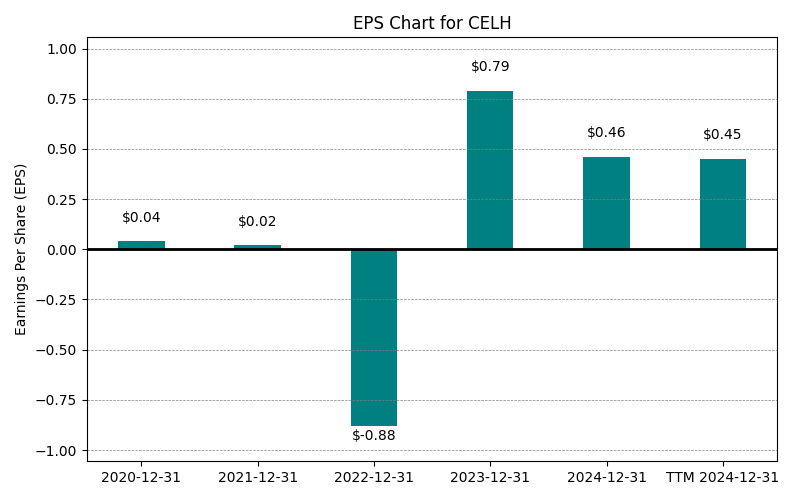
| 0 | 2020-12-31 | $131M | $9M | $0.04 | 2024-02-22 20:50:43 | N/A | N/A | N/A |
| 1 | 2021-12-31 | $314M | $4M | $0.02 | 2026-03-06 08:29:00 | 140.4% | -53.8% | -50.0% |
| 2 | 2022-12-31 | $654M | $-187M | $-0.88 | 2026-05-29 09:06:30 | 108.0% | -4857.0% | -4500.0% |
| 3 | 2023-12-31 | $1,318M | $227M | $0.79 | 2026-05-29 09:06:30 | 101.7% | -221.1% | -189.8% |
| 4 | 2024-12-31 | $1,356M | $145M | $0.46 | 2026-05-29 09:06:30 | 2.9% | -36.0% | -41.8% |
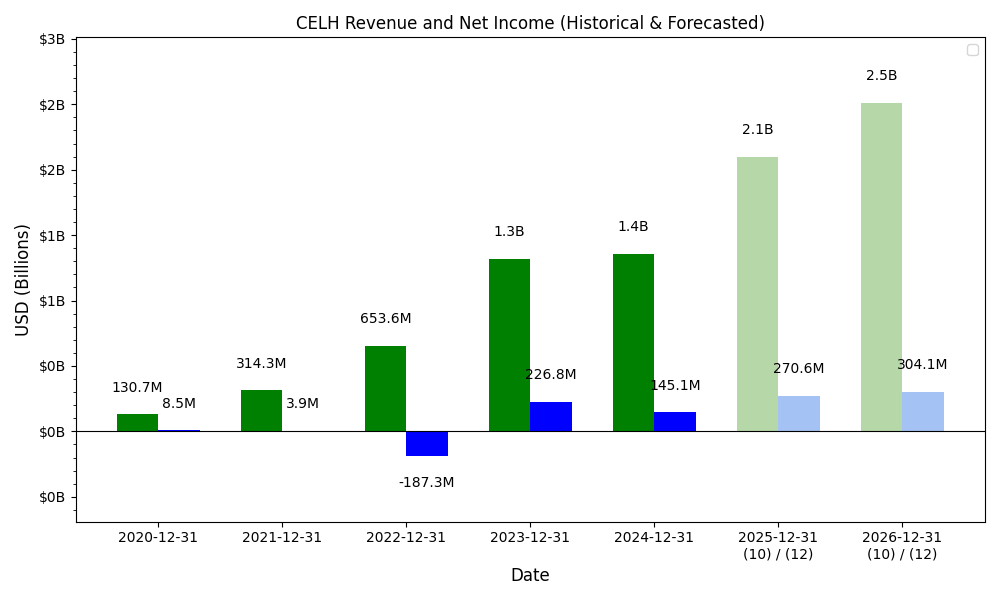
| 5 | 2025-12-31 | $2,515M | $108M | $0.25 | 2026-05-29 09:06:30 | 85.5% | -25.6% | -45.7% |
| 6 | TTM 2026-03-31 | $2,969M | $174M | $0.43 | 2026-05-11 09:06:42 | 18.0% | 60.8% | 72.0% |
EPS
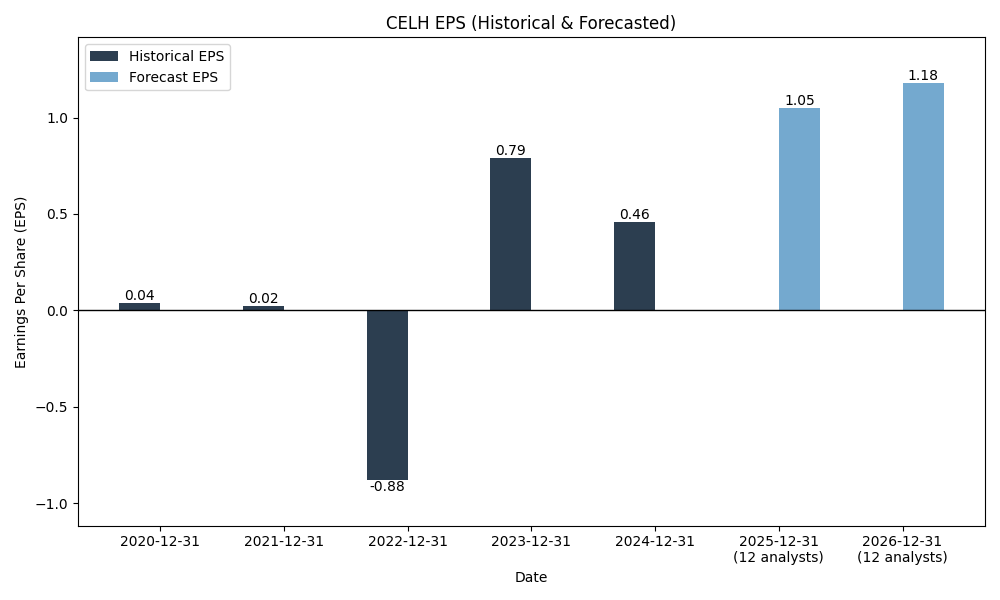
Forecasts
Y/Y % Change
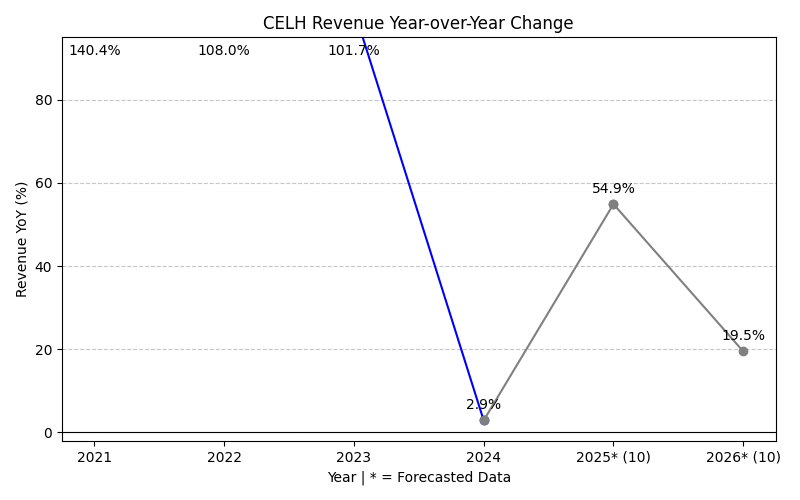
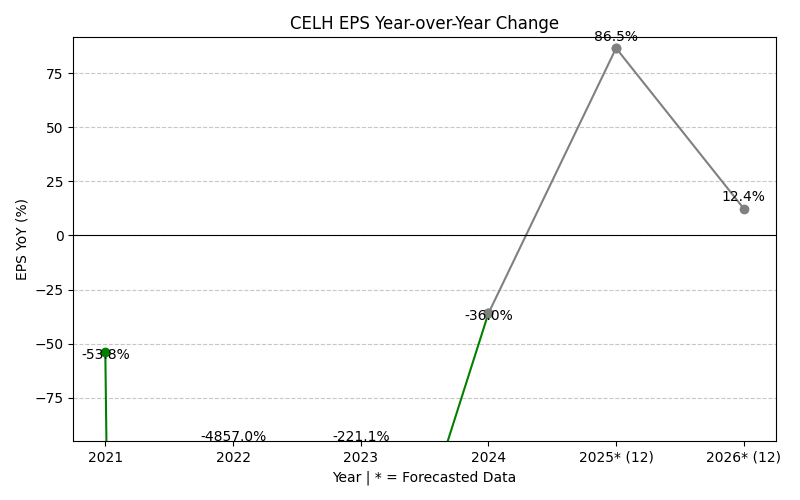
CELH Year-over-Year Growth
| 2020 | 2021 | 2022 | 2023 | 2024 | 2025 | 2026 | 2027 | Average | |
|---|---|---|---|---|---|---|---|---|---|
| Revenue Growth (%) | 140.4% | 108.0% | 101.7% | 2.9% | 85.5% | 33.0% | 9.8% | 68.8% | |
| Revenue Analysts (#) | 0 | 0 | 0 | 0 | 0 | 0 | 22 | 22 | |
| EPS Growth (%) | -53.8% | -4857.0% | -221.1% | -36.0% | -25.6% | 284.5% | 25.0% | -697.7% | |
| EPS Analysts (#) | 0 | 0 | 0 | 0 | 0 | 0 | 21 | 21 |
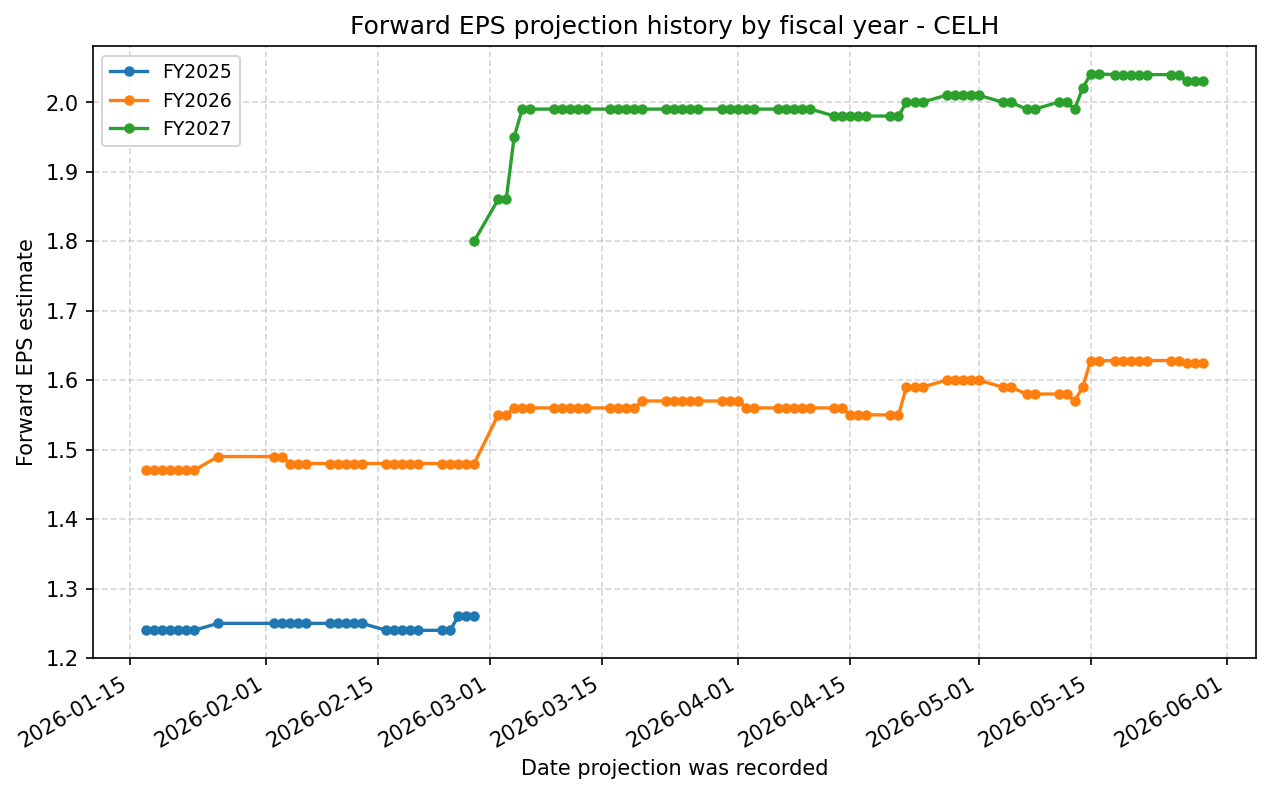
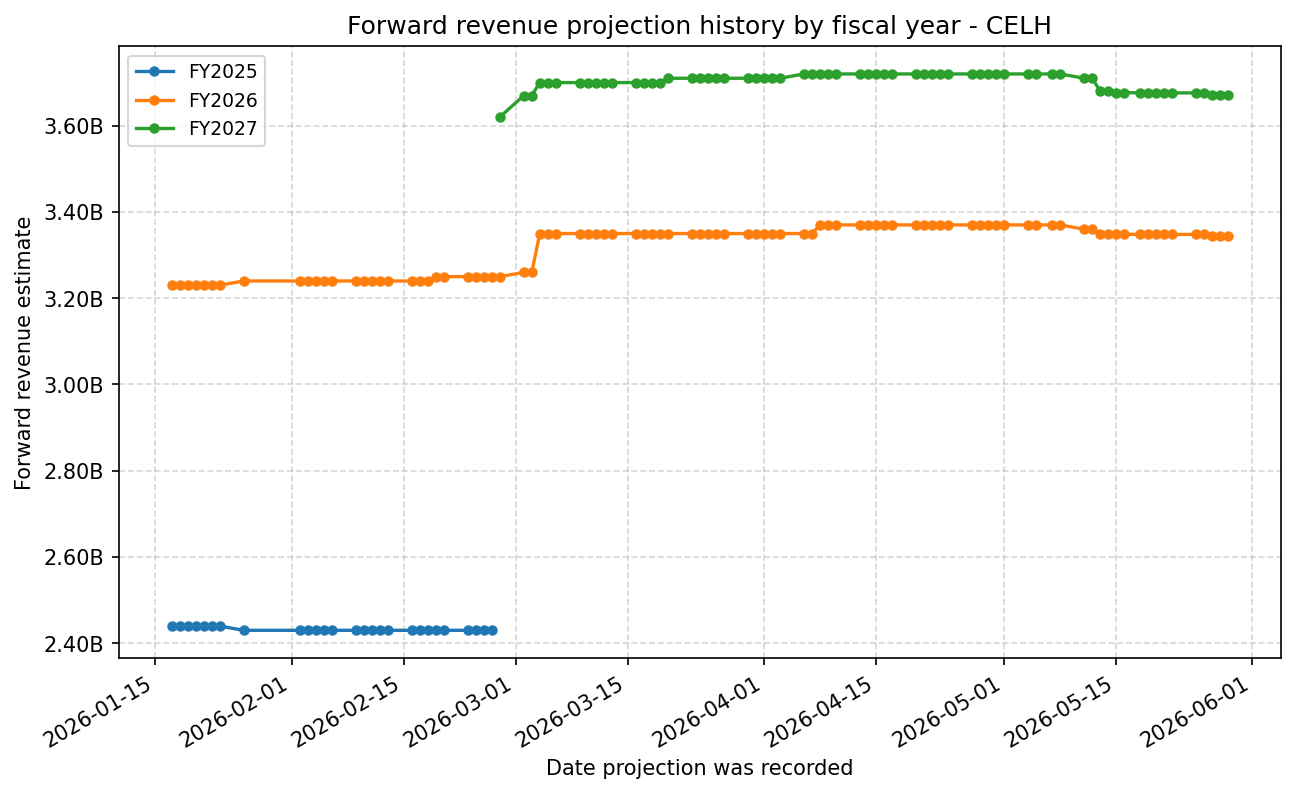
Forward Estimate History
How the next-FY EPS and revenue estimates have drifted over time. One line per fiscal year – past lines end when that FY became current.
Expenses
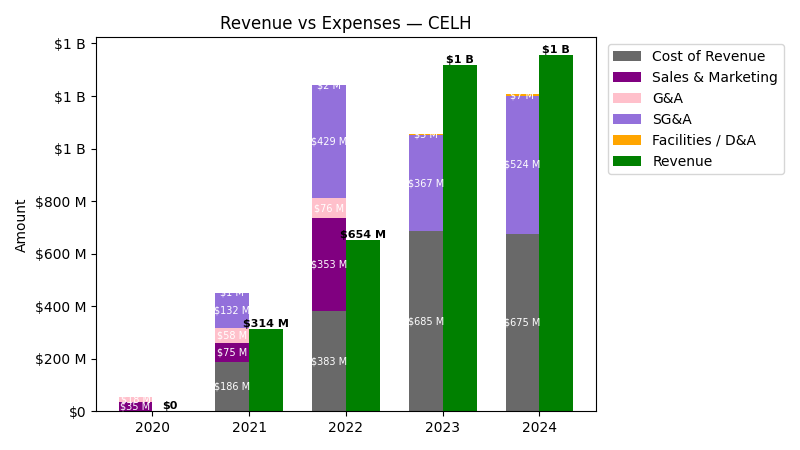
| Year | Revenue ($) | Cost of Revenue ($) | Sales & Marketing ($) | G&A ($) | SG&A ($) | Facilities / D&A ($) |
|---|---|---|---|---|---|---|
| 2022 | $653.6M | $380.8M | $352.8M | $75.9M | $428.7M | $1.9M |
| 2023 | $1.3B | $681.6M | $0.0 | $0.0 | $366.8M | $3.2M |
| 2024 | $1.4B | $668.1M | $0.0 | $0.0 | $524.5M | $7.3M |
| 2025 | $2.5B | $1.2B | $0.0 | $0.0 | $798.8M | $29.5M |
| TTM | $3.0B | $1.5B | $0.0 | $0.0 | $913.1M | $36.0M |
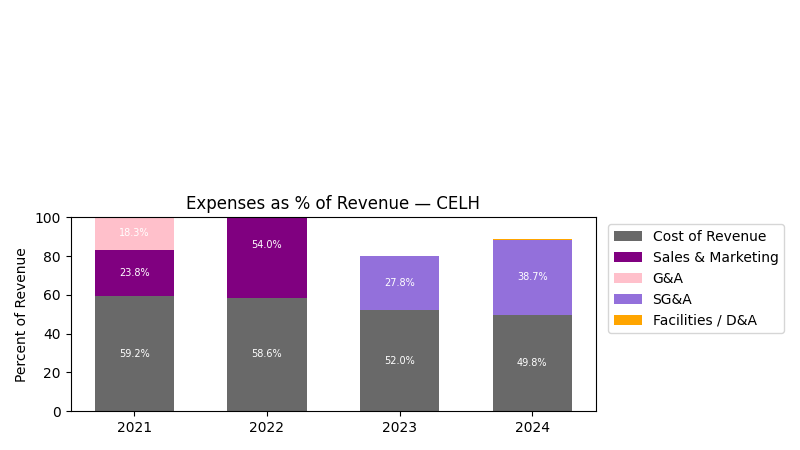
| Year | Revenue Change (%) | Cost of Revenue Change (%) | Sales & Marketing Change (%) | G&A Change (%) | SG&A Change (%) | Facilities / D&A Change (%) |
|---|---|---|---|---|---|---|
| 2023 | 101.65 | 79.00 | -100.0 | -100.0 | -14.44 | 68.28 |
| 2024 | 2.85 | -1.98 | NaN | NaN | 43.00 | 125.48 |
| 2025 | 85.54 | 82.37 | NaN | NaN | 52.31 | 304.88 |
| TTM | 18.02 | 19.79 | NaN | NaN | 14.31 | 22.15 |
No unmapped expenses.
Balance Sheet
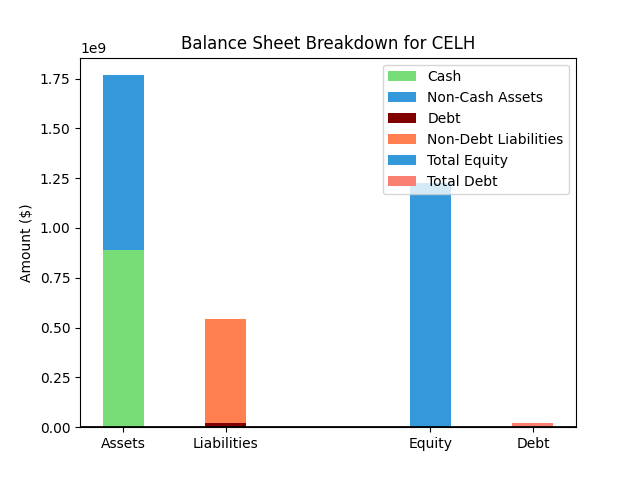
| Metric | Value | |
|---|---|---|
| 0 | Total Assets | $5,158M |
| 1 | Cash | $549M |
| 2 | Total Liabilities | $2,147M |
| 3 | Total Debt | $669M |
| 4 | Total Equity | $3,011M |
| 5 | Debt to Equity Ratio | 0.22 |
EPS & Dividend

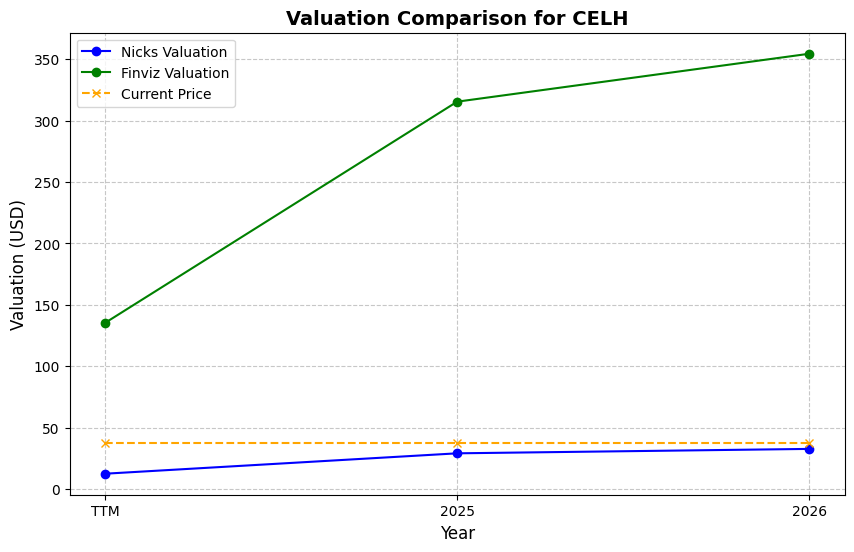
Valuation
| Share Price | Treasury Yield | Estimates | Fair Value (P/E) | Fair Value (P/S) | Current P/S | Current P/E |
|---|---|---|---|---|---|---|
| $33.27 | 4.5% | Nicks Growth: 15% Nick's Expected Margin: 10% FINVIZ Growth: 19% |
Nicks: 27 Finviz: 40 |
Nick's: 2.726 | 2.9 | 77.4 |
| Basis | Year | Nicks Valuation | Nicks vs Share Price | Finviz Valuation | Finviz vs Share Price |
|---|---|---|---|---|---|
| $0.43 EPS | TTM | $11.72 | -64.8% | $17.00 | -48.9% |
| $1.62 EPS | 2026 | $44.28 | 33.1% | $64.23 | 93.1% |
| $2.03 EPS | 2027 | $55.33 | 66.3% | $80.27 | 141.3% |
Implied Growth
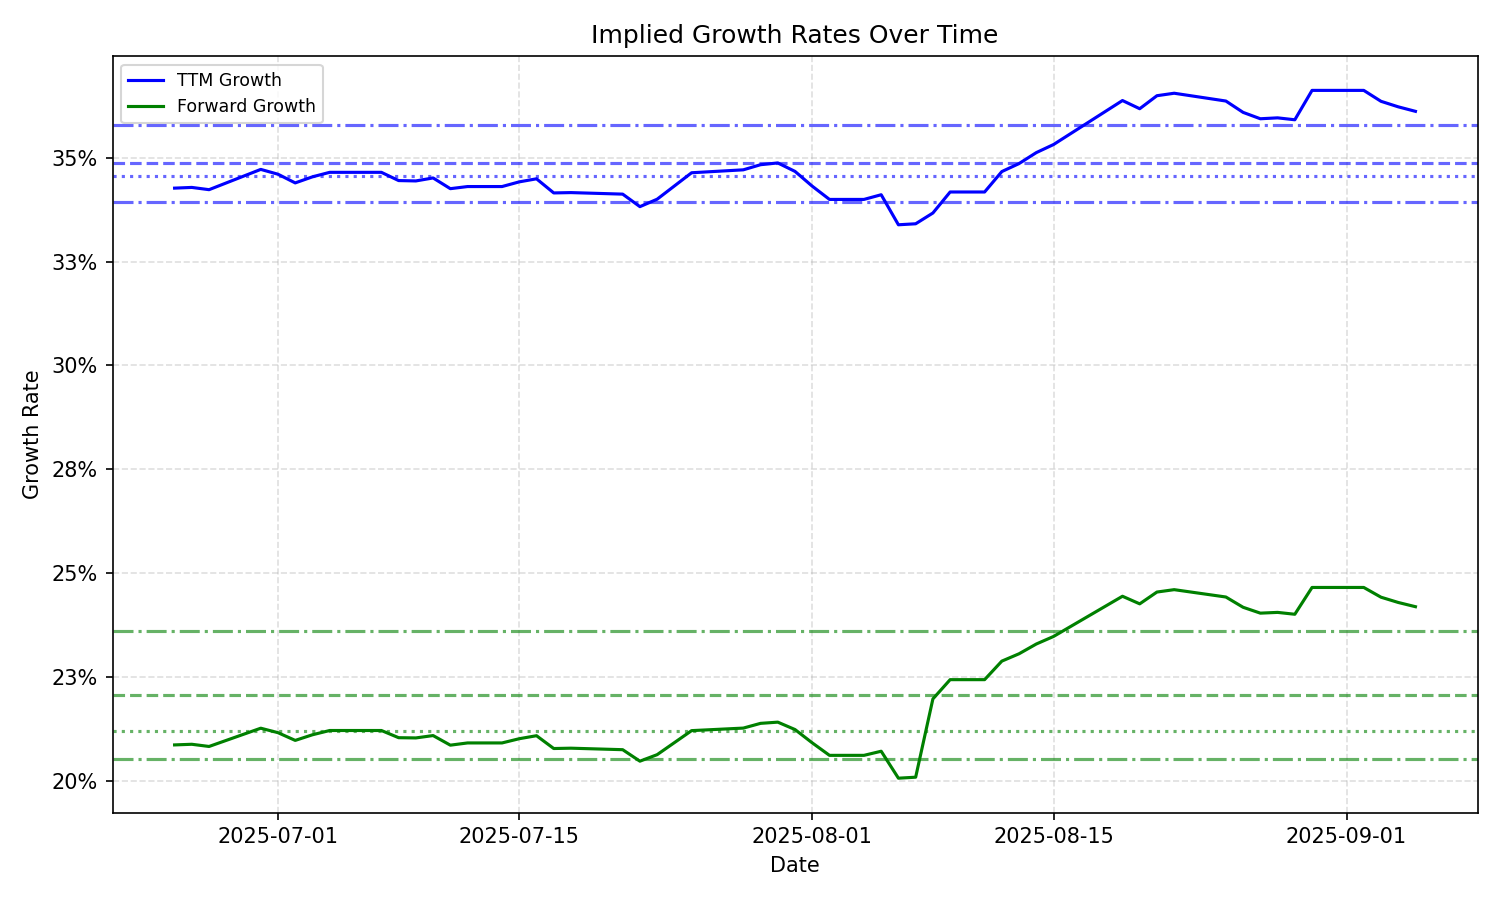
| Average | Median | Std Dev | Current | Percentile | ||||||
|---|---|---|---|---|---|---|---|---|---|---|
| TTM | Forward | TTM | Forward | TTM | Forward | TTM | Forward | TTM | Forward | |
| Timeframe | ||||||||||
| 1 Year | 38.45% | 17.83% | 35.91% | 19.50% | 6.96% | 5.47% | 27.14% | 9.50% | 6.7% | 10.4% |
| 3 Years | 38.45% | 17.83% | 35.91% | 19.50% | 6.96% | 5.47% | 27.14% | 9.50% | 6.7% | 10.4% |
| 5 Years | 38.45% | 17.83% | 35.91% | 19.50% | 6.96% | 5.47% | 27.14% | 9.50% | 6.7% | 10.4% |
| 10 Years | 38.45% | 17.83% | 35.91% | 19.50% | 6.96% | 5.47% | 27.14% | 9.50% | 6.7% | 10.4% |