Carnival Corporation — CCL
| Close Price | Market Cap | P/E Ratio | Forward P/E Ratio | Implied Growth* | Implied Forward Growth* | Dividend | P/B Ratio |
|---|---|---|---|---|---|---|---|
| $28.06 | $38.87B | 12.4 | 10.8 | 6.6% | 5.2% | $0.30 1.1% | 3.0 |
Latest Headlines
- · Did You Know That Viking Holdings Has Doubled Over the Past Year?
- · 3 Reasons to Buy Carnival Stock in June
- · Carnival Data Breach Exposes Names, Addresses And Government ID Numbers After Cybercriminals Trick Employee In Social Engineering Attack
- · PVH Corp. to Report Q1 Earnings: What Surprise Awaits Investors?
- · Carnival Sees Fuel Cost Relief As Travel Interest Shows Early Strength
- · Carnival Insiders Sold US$13m Of Shares Suggesting Hesitancy
Revenue & Net Income
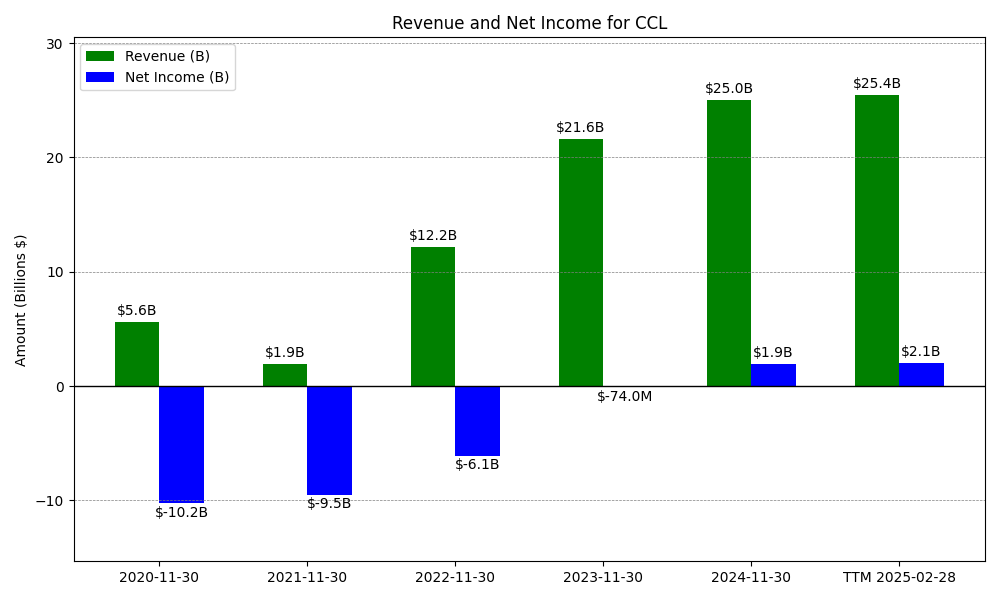
| Date | Revenue | Net_Income | EPS | Last_Updated | Revenue_Change | Net_Income_Change | EPS_Change | |
|---|---|---|---|---|---|---|---|---|
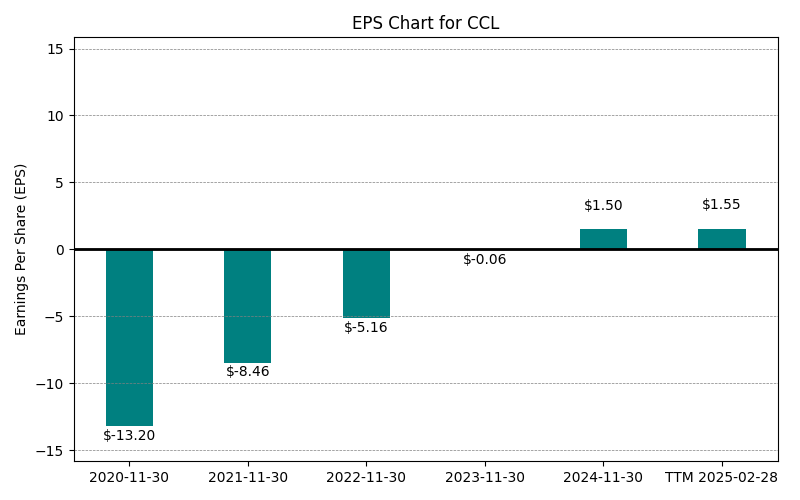
| 0 | 2020-11-30 | $5,594M | $-10,236M | $-13.20 | 2024-02-04 04:18:28 | N/A | N/A | N/A |
| 1 | 2021-11-30 | $1,908M | $-9,501M | $-8.46 | 2024-02-04 04:18:28 | -65.9% | -7.2% | -35.9% |
| 2 | 2022-11-30 | $12,169M | $-6,093M | $-5.16 | 2026-05-29 09:06:24 | 537.8% | -35.9% | -39.0% |
| 3 | 2023-11-30 | $21,593M | $-74M | $-0.06 | 2026-05-29 09:06:24 | 77.4% | -98.8% | -98.8% |
| 4 | 2024-11-30 | $25,021M | $1,916M | $1.50 | 2026-05-29 09:06:24 | 15.9% | -2689.2% | -2600.0% |
| 5 | 2025-11-30 | $26,621M | $2,760M | $2.10 | 2026-05-29 09:06:24 | 6.4% | 44.1% | 40.0% |
| 6 | TTM 2026-02-28 | $26,976M | $3,097M | $2.27 | 2026-04-02 08:47:18 | 1.3% | 12.2% | 8.1% |
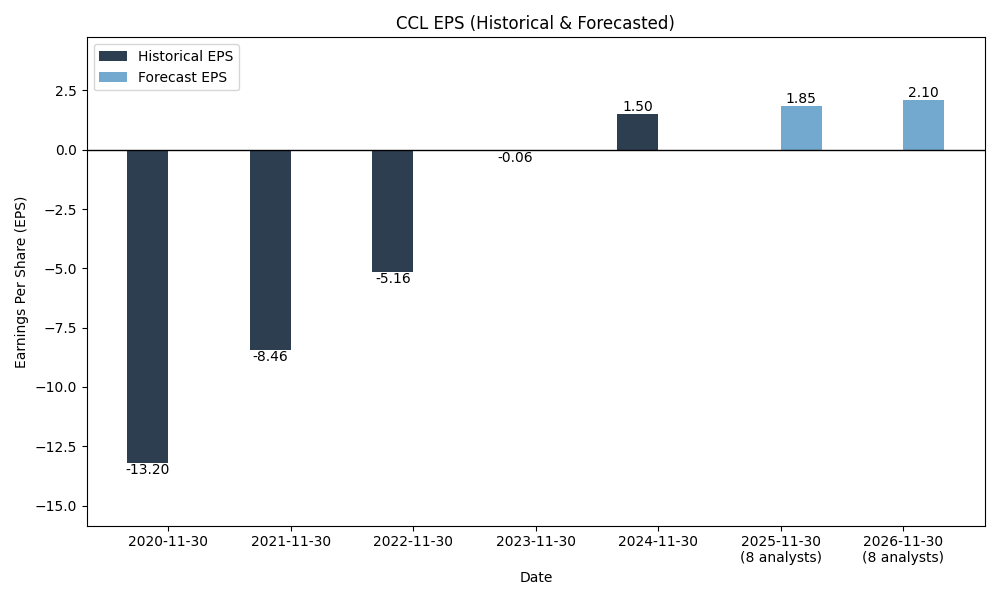
EPS
Forecasts
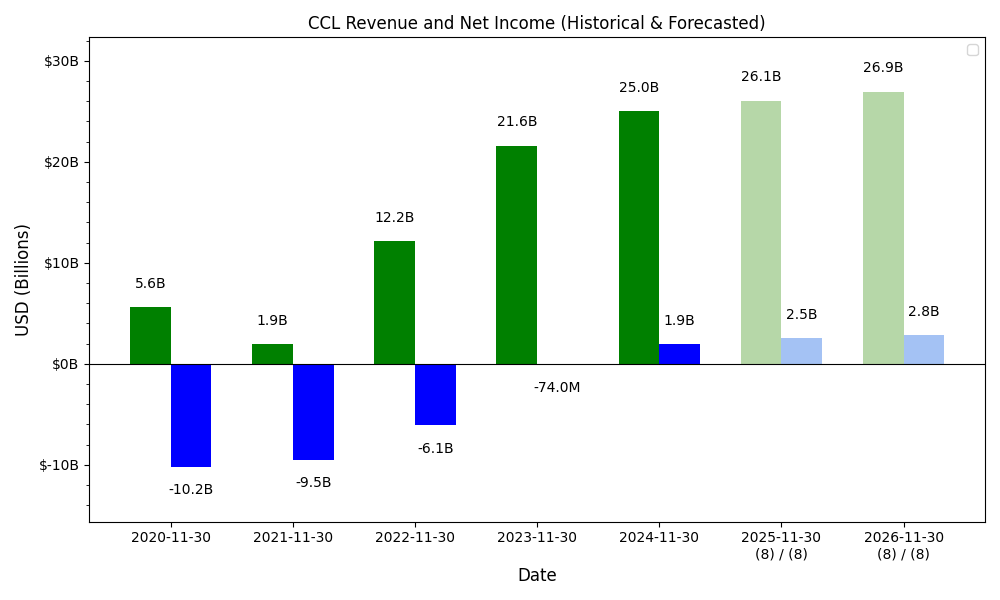
Y/Y % Change
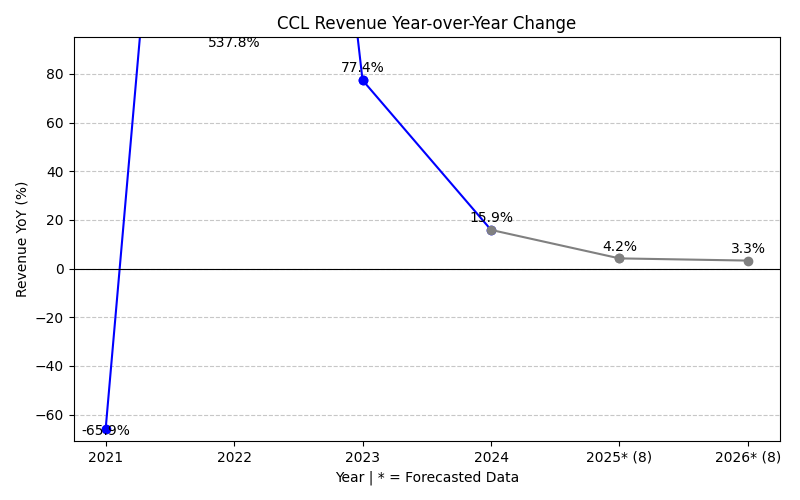
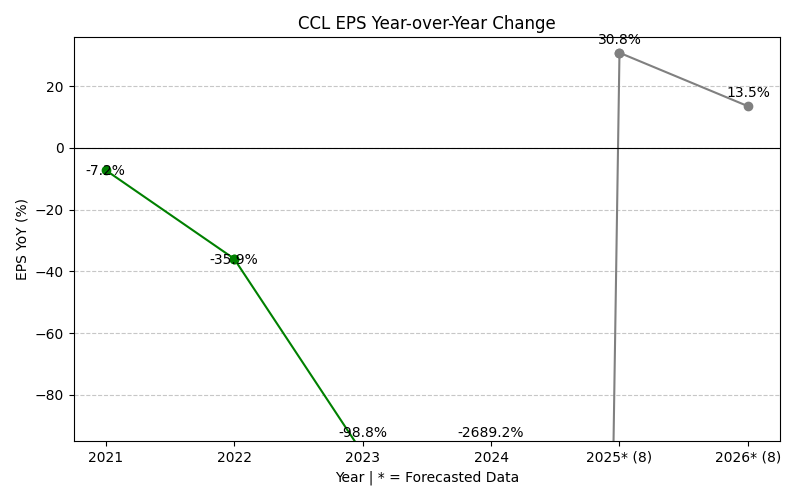
CCL Year-over-Year Growth
| 2020 | 2021 | 2022 | 2023 | 2024 | 2025 | 2026 | 2027 | Average | |
|---|---|---|---|---|---|---|---|---|---|
| Revenue Growth (%) | -65.9% | 537.8% | 77.4% | 15.9% | 6.4% | 4.6% | 3.4% | 82.8% | |
| Revenue Analysts (#) | 0 | 0 | 0 | 0 | 0 | 0 | 21 | 22 | |
| EPS Growth (%) | -7.2% | -35.9% | -98.8% | -2689.2% | 44.1% | 11.6% | 17.0% | -394.1% | |
| EPS Analysts (#) | 0 | 0 | 0 | 0 | 0 | 0 | 24 | 25 |
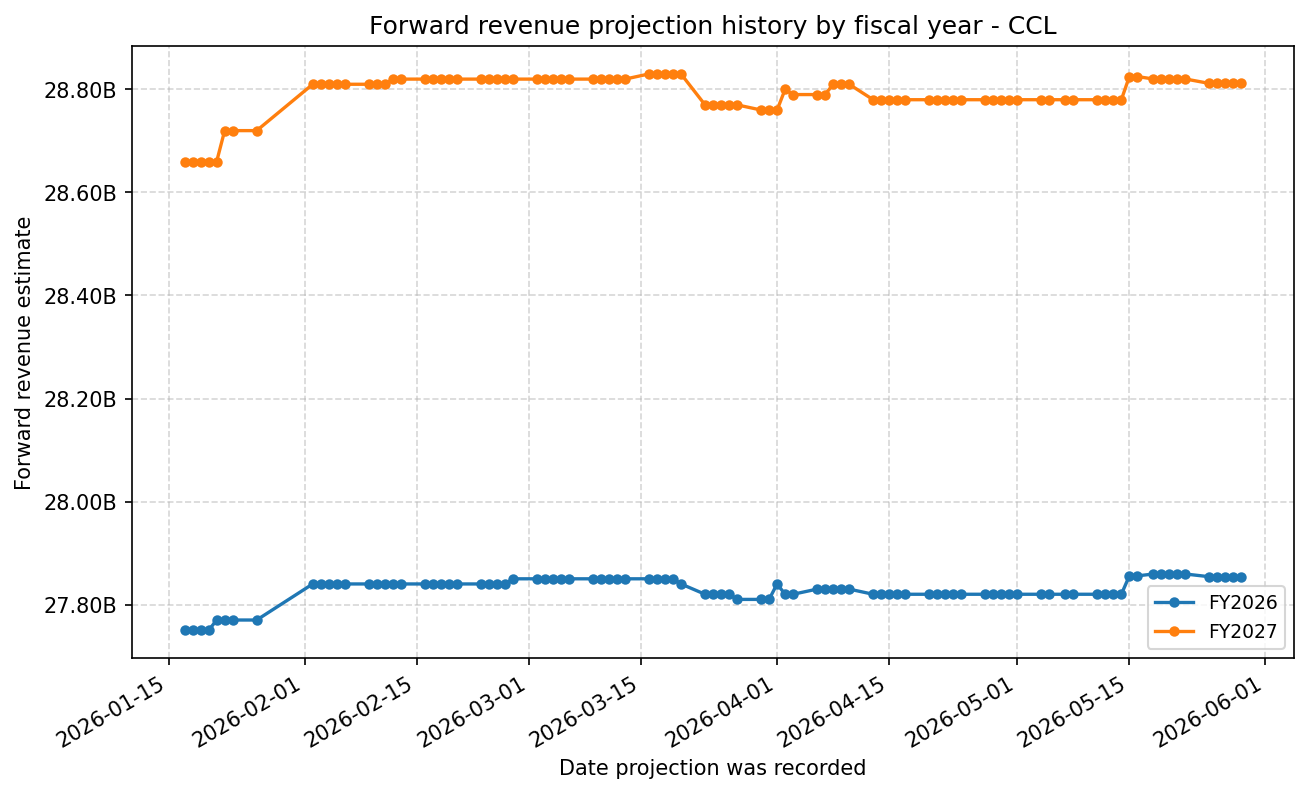
Forward Estimate History
How the next-FY EPS and revenue estimates have drifted over time. One line per fiscal year – past lines end when that FY became current.

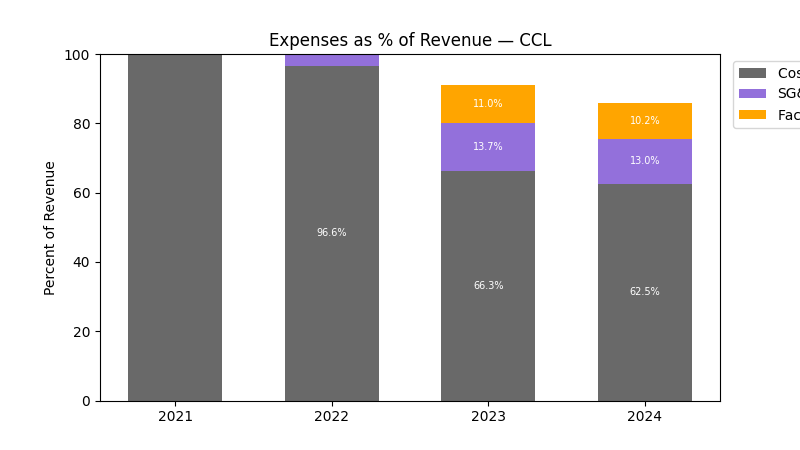
Expenses
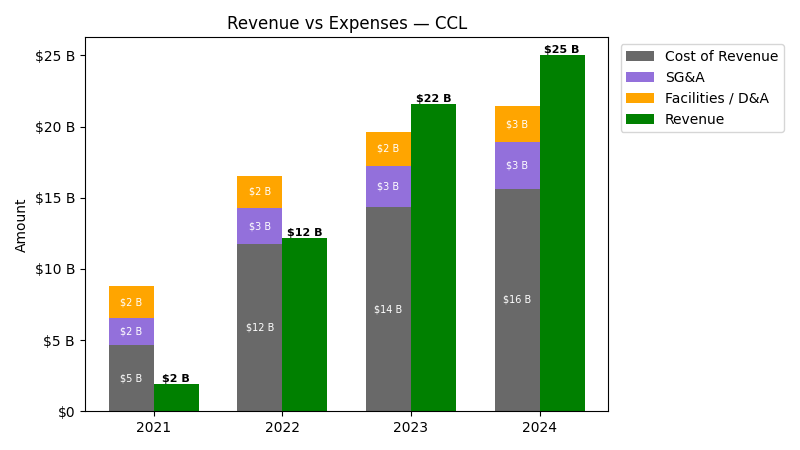
| Year | Revenue ($) | Cost of Revenue ($) | SG&A ($) | Facilities / D&A ($) |
|---|---|---|---|---|
| 2022 | $12.2B | $9.5B | $2.5B | $2.3B |
| 2023 | $21.6B | $11.9B | $3.0B | $2.4B |
| 2024 | $25.0B | $13.1B | $3.3B | $2.6B |
| 2025 | $26.6B | $13.2B | $3.4B | $2.8B |
| Year | Revenue Change (%) | Cost of Revenue Change (%) | SG&A Change (%) | Facilities / D&A Change (%) |
|---|---|---|---|---|
| 2023 | 77.44 | 26.00 | 17.30 | 4.18 |
| 2024 | 15.88 | 9.49 | 10.24 | 7.89 |
| 2025 | 6.39 | 0.58 | 4.61 | 9.11 |
No unmapped expenses.
Segment Performance
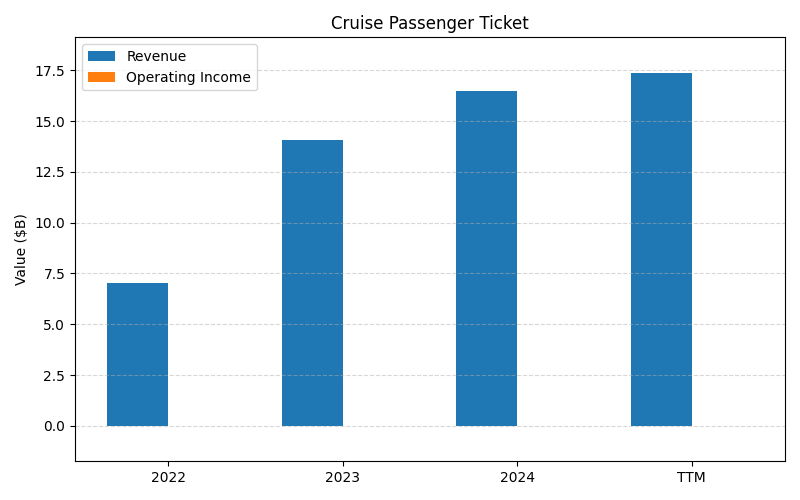
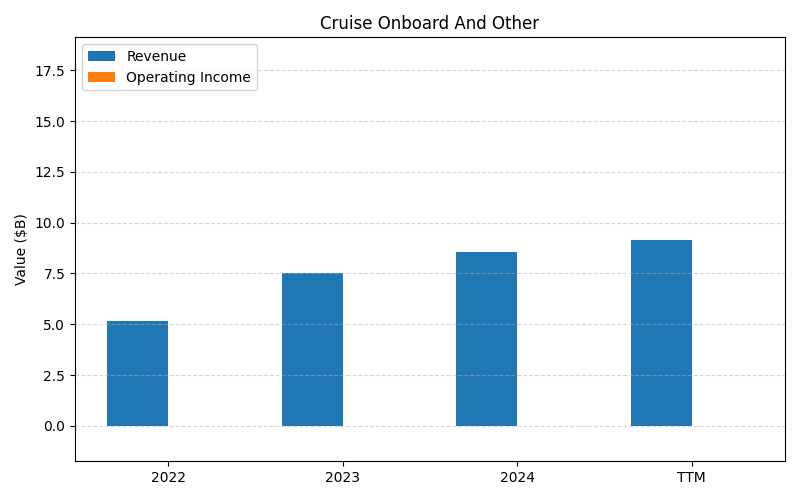
SEGMENTS v2025-09-09 · 2026-05-29 09:06 UTC — Units: $B. Rows list fiscal years (last 3 + TTM) with revenue for each segment; the final row shows the TTM revenue mix (operating income columns display “—” where mix is not applicable).
| Year | Cruise Passenger Ticket Rev | Cruise Onboard And Other Rev | Total Rev |
|---|---|---|---|
| 2023 | 14.1B | 7.53B | 21.6B |
| 2024 | 16.5B | 8.56B | 25B |
| 2025 | 17.4B | 9.20B | 26.6B |
| TTM | 41.7B | 21.9B | 63.6B |
| % of Total (TTM) | 65.6% | 34.4% | 100% |
Segment Performance (Axis 2)
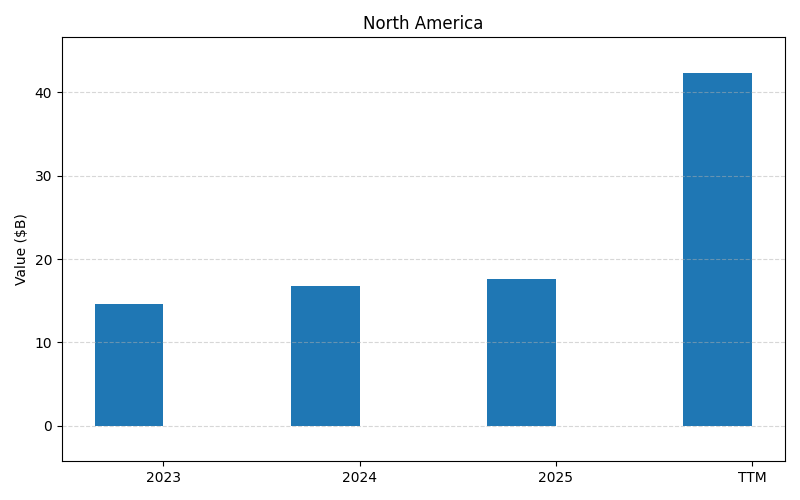
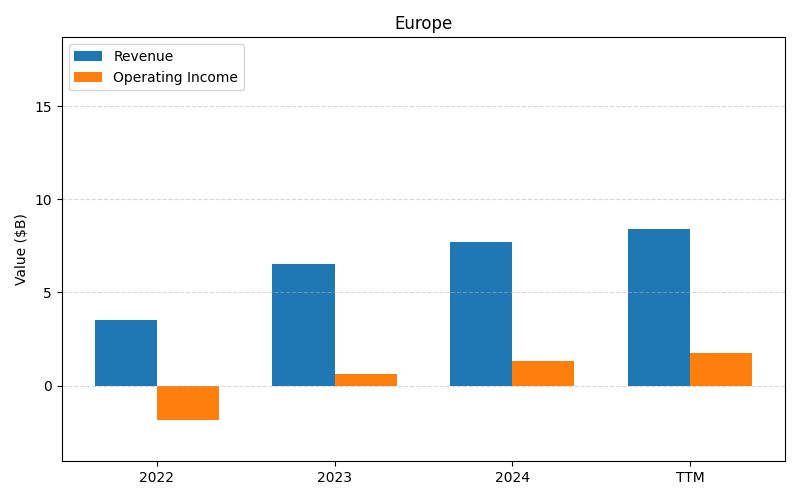
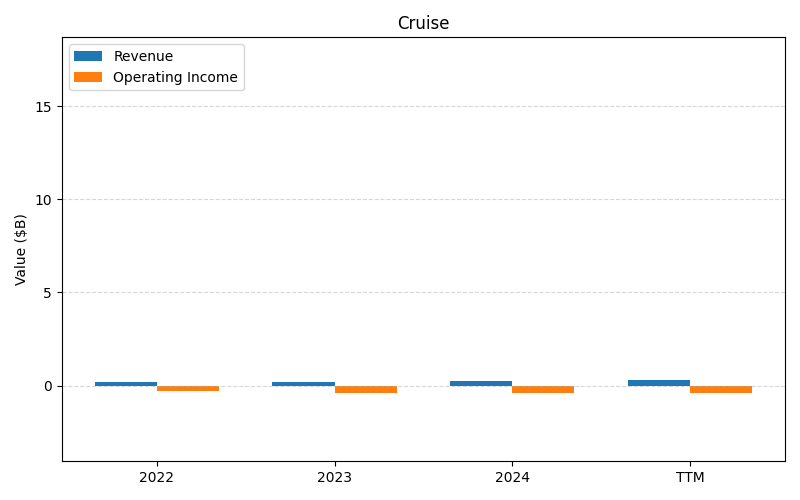
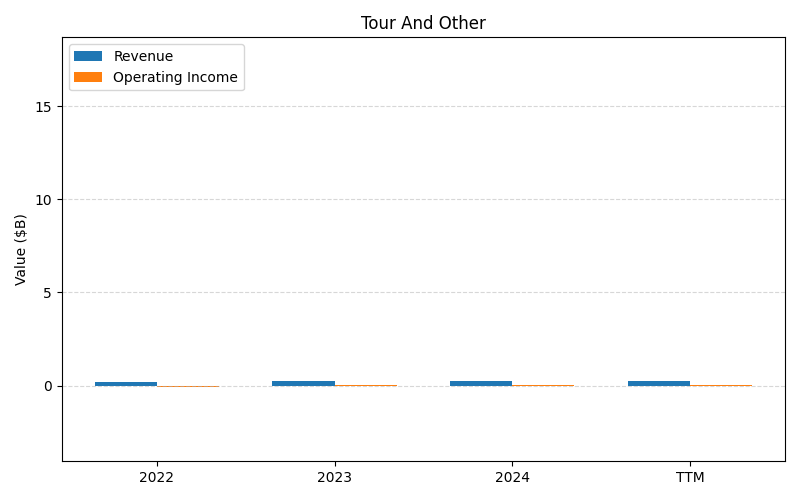
SEGMENTS v2025-09-09 · 2026-05-29 09:06 UTC — Units: $B. Rows list fiscal years (last 3 + TTM) with revenue for each segment; the final row shows the TTM revenue mix (operating income columns display “—” where mix is not applicable).
| Year | North America Rev | Europe Rev | Cruise Rev | Tour And Other Rev | Total Rev |
|---|---|---|---|---|---|
| 2023 | 14.6B | 6.54B | 0.21B | 0.27B | 21.6B |
| 2024 | 16.8B | 7.71B | 0.26B | 0.26B | 25B |
| 2025 | 17.6B | 8.47B | 0.31B | 0.24B | 26.6B |
| TTM | 42.3B | 20.1B | 0.71B | 0.50B | 63.6B |
| % of Total (TTM) | 66.5% | 31.6% | 1.1% | 0.8% | 100% |
Balance Sheet
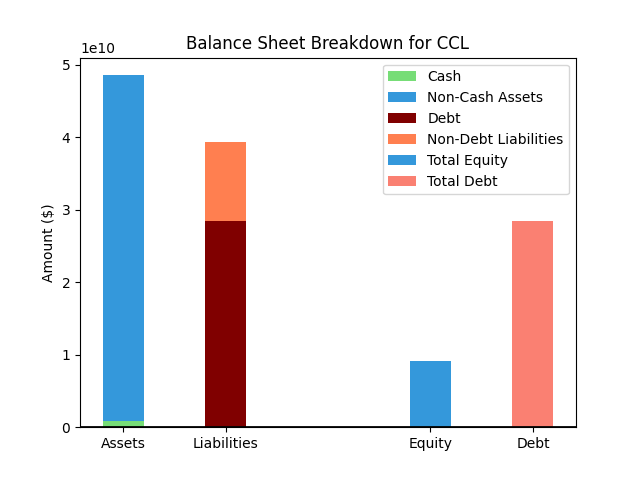
| Metric | Value | |
|---|---|---|
| 0 | Total Assets | $51,567M |
| 1 | Cash | $1,424M |
| 2 | Total Liabilities | $38,518M |
| 3 | Total Debt | $26,607M |
| 4 | Total Equity | $13,031M |
| 5 | Debt to Equity Ratio | 2.04 |
EPS & Dividend

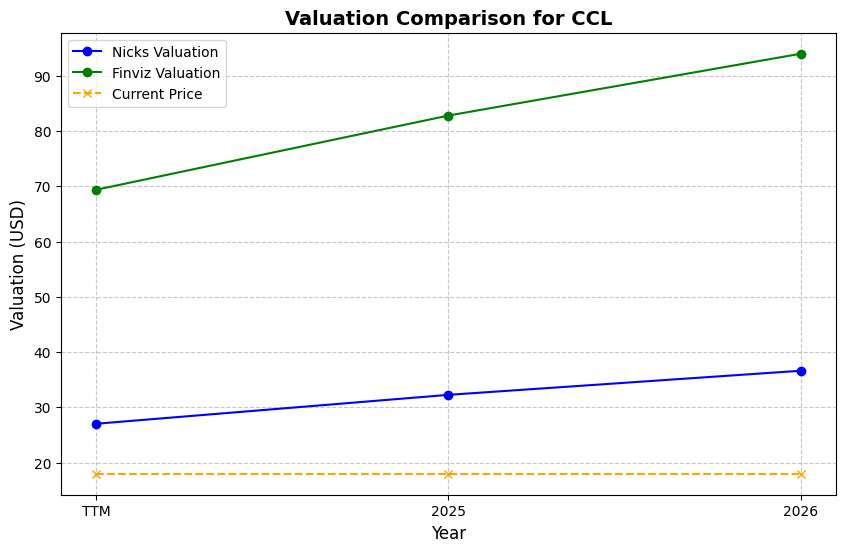
Valuation
| Share Price | Treasury Yield | Estimates | Fair Value (P/E) | Fair Value (P/S) | Current P/S | Current P/E |
|---|---|---|---|---|---|---|
| $28.06 | 4.5% | Nicks Growth: 10% Nick's Expected Margin: 2% FINVIZ Growth: 10% |
Nicks: 17 Finviz: 18 |
Nick's: 0.343 | 1.4 | 12.4 |
| Basis | Year | Nicks Valuation | Nicks vs Share Price | Finviz Valuation | Finviz vs Share Price |
|---|---|---|---|---|---|
| $2.27 EPS | TTM | $38.95 | 38.8% | $39.96 | 42.4% |
| $2.22 EPS | 2026 | $38.14 | 35.9% | $39.13 | 39.4% |
| $2.60 EPS | 2027 | $44.61 | 59.0% | $45.76 | 63.1% |
Implied Growth
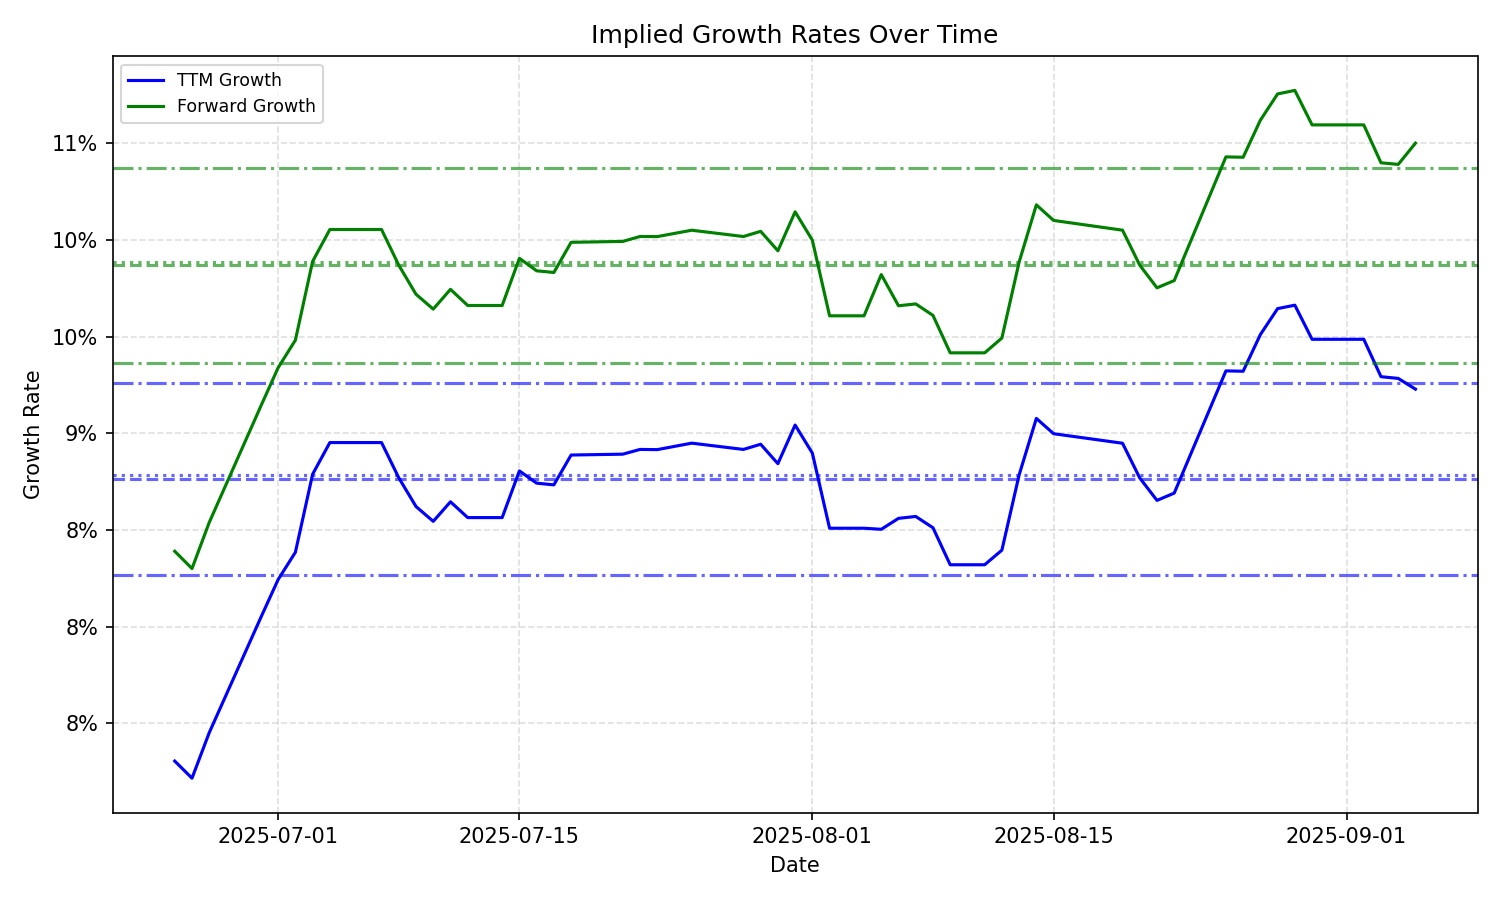
| Average | Median | Std Dev | Current | Percentile | ||||||
|---|---|---|---|---|---|---|---|---|---|---|
| TTM | Forward | TTM | Forward | TTM | Forward | TTM | Forward | TTM | Forward | |
| Timeframe | ||||||||||
| 1 Year | 7.78% | 7.27% | 8.12% | 8.27% | 1.21% | 2.56% | 6.55% | 5.18% | 20.0% | 34.2% |
| 3 Years | 7.78% | 7.27% | 8.12% | 8.27% | 1.21% | 2.56% | 6.55% | 5.18% | 20.0% | 34.2% |
| 5 Years | 7.78% | 7.27% | 8.12% | 8.27% | 1.21% | 2.56% | 6.55% | 5.18% | 20.0% | 34.2% |
| 10 Years | 7.78% | 7.27% | 8.12% | 8.27% | 1.21% | 2.56% | 6.55% | 5.18% | 20.0% | 34.2% |