Beyond Meat, Inc. — BYND
| Close Price | Market Cap | P/E Ratio | Forward P/E Ratio | Implied Growth* | Implied Forward Growth* | Dividend | P/B Ratio |
|---|---|---|---|---|---|---|---|
| $0.79 | $406.35M | - | -2.2 | N/A | - | - | -17.1 |
Latest Headlines
- · Beyond Meat Stock Is Down 12% in the Last Month. Wall Street Is Starting to Bet on Its Turnaround Story.
- · The quiet death of conscious consumerism, from Everlane and Allbirds to Beyond Meat
- · Beyond Meat (BYND) Reports Q1 Financial Results
- · Are Protein Drinks the Turnaround Catalyst That Beyond Meat Stock Needs?
- · Beyond Meat(R) Partners With Karen Carney to Drive Summer Demand for Tasty, Plant-Based Meals
- · Beyond Meat puts protein drinks at the center of turnaround plan
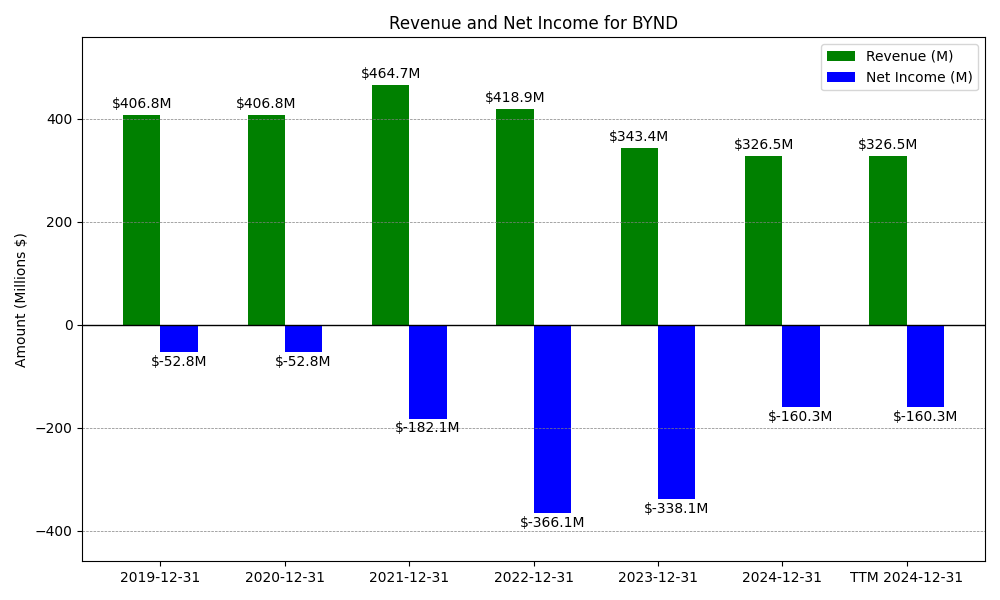
Revenue & Net Income
| Date | Revenue | Net_Income | EPS | Last_Updated | Revenue_Change | Net_Income_Change | EPS_Change | |
|---|---|---|---|---|---|---|---|---|
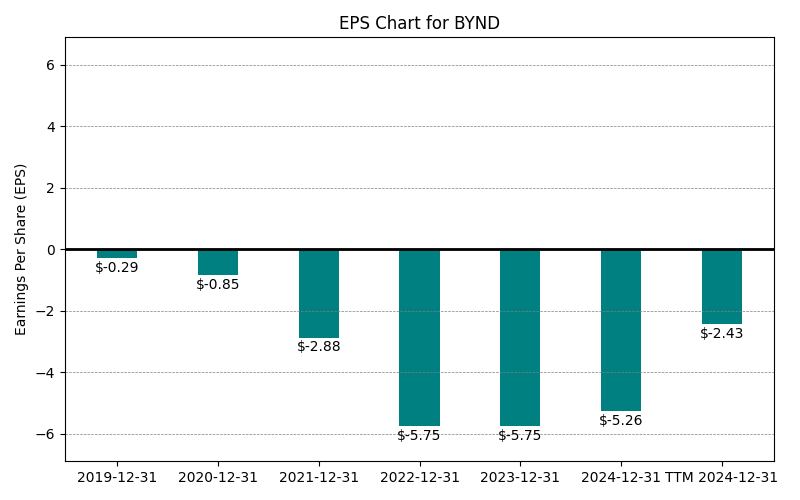
| 0 | 2019-12-31 | $407M | $-53M | $-0.29 | 2024-05-25 13:10:31 | N/A | N/A | N/A |
| 1 | 2020-12-31 | $407M | $-53M | $-0.85 | 2024-03-02 14:54:42 | 0.0% | 0.0% | 193.1% |
| 2 | 2021-12-31 | $465M | $-182M | $-2.88 | 2026-04-10 08:30:48 | 14.2% | 245.2% | 238.8% |
| 3 | 2022-12-31 | $419M | $-366M | $-5.75 | 2026-05-29 09:05:56 | -9.8% | 101.1% | 99.7% |
| 4 | 2023-12-31 | $343M | $-338M | $-5.26 | 2026-05-29 09:05:56 | -18.0% | -7.6% | -8.5% |
| 5 | 2024-12-31 | $326M | $-160M | $-2.43 | 2026-05-29 09:05:56 | -4.9% | -52.6% | -53.8% |
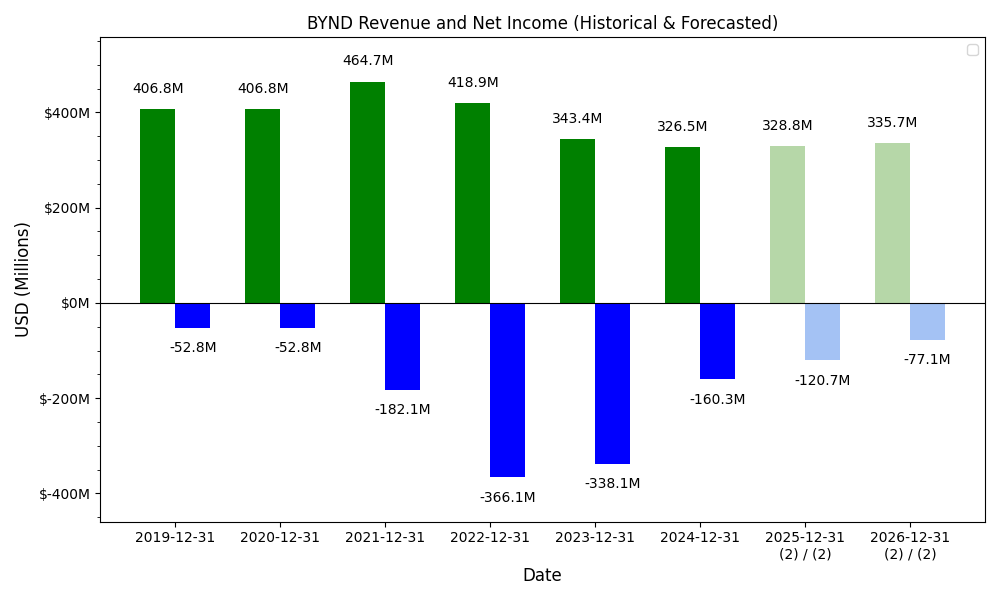
| 6 | 2025-12-31 | $275M | $178M | $1.15 | 2026-05-29 09:05:56 | -15.6% | -211.1% | -147.3% |
| 7 | TTM 2026-03-31 | $265M | $202M | $-1.09 | 2026-05-11 09:06:07 | -3.8% | 13.7% | -194.8% |
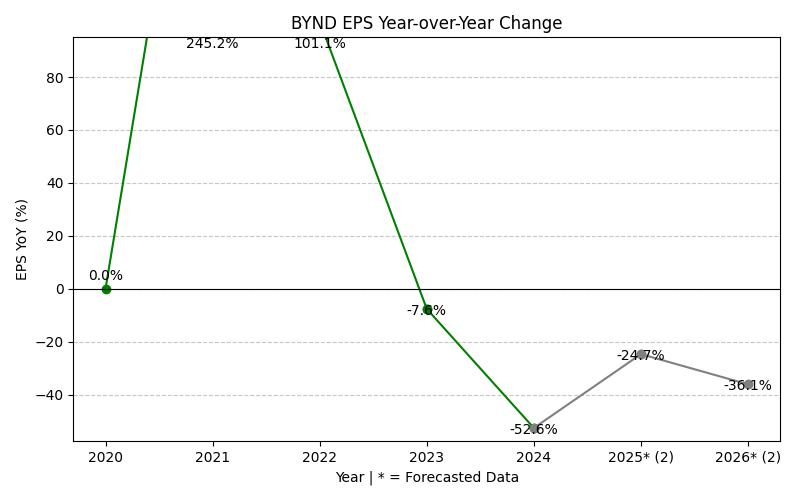
EPS
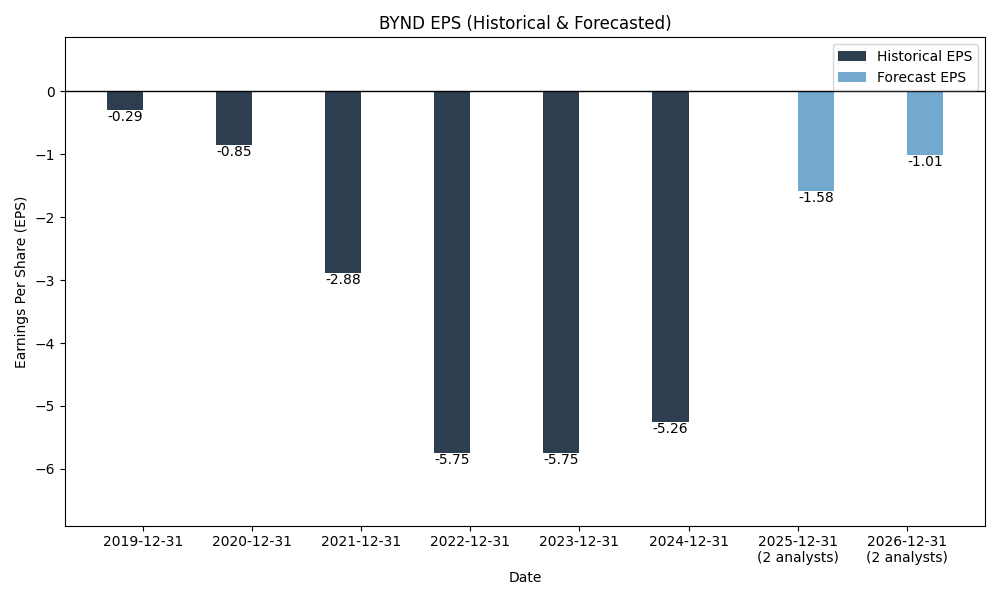
Forecasts
Y/Y % Change
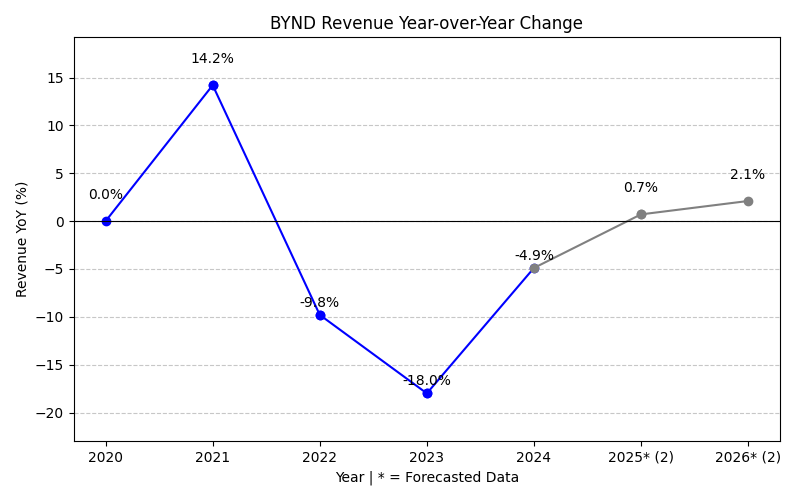
BYND Year-over-Year Growth
| 2019 | 2020 | 2021 | 2022 | 2023 | 2024 | 2025 | 2026 | 2027 | Average | |
|---|---|---|---|---|---|---|---|---|---|---|
| Revenue Growth (%) | 0.0% | 14.2% | -9.8% | -18.0% | -4.9% | -15.6% | -10.2% | -0.5% | -5.6% | |
| Revenue Analysts (#) | 0 | 0 | 0 | 0 | 0 | 0 | 0 | 5 | 5 | |
| EPS Growth (%) | 0.0% | 245.2% | 101.1% | -7.6% | -52.6% | -211.1% | -198.1% | 5.6% | -14.7% | |
| EPS Analysts (#) | 0 | 0 | 0 | 0 | 0 | 0 | 0 | 2 | 3 |
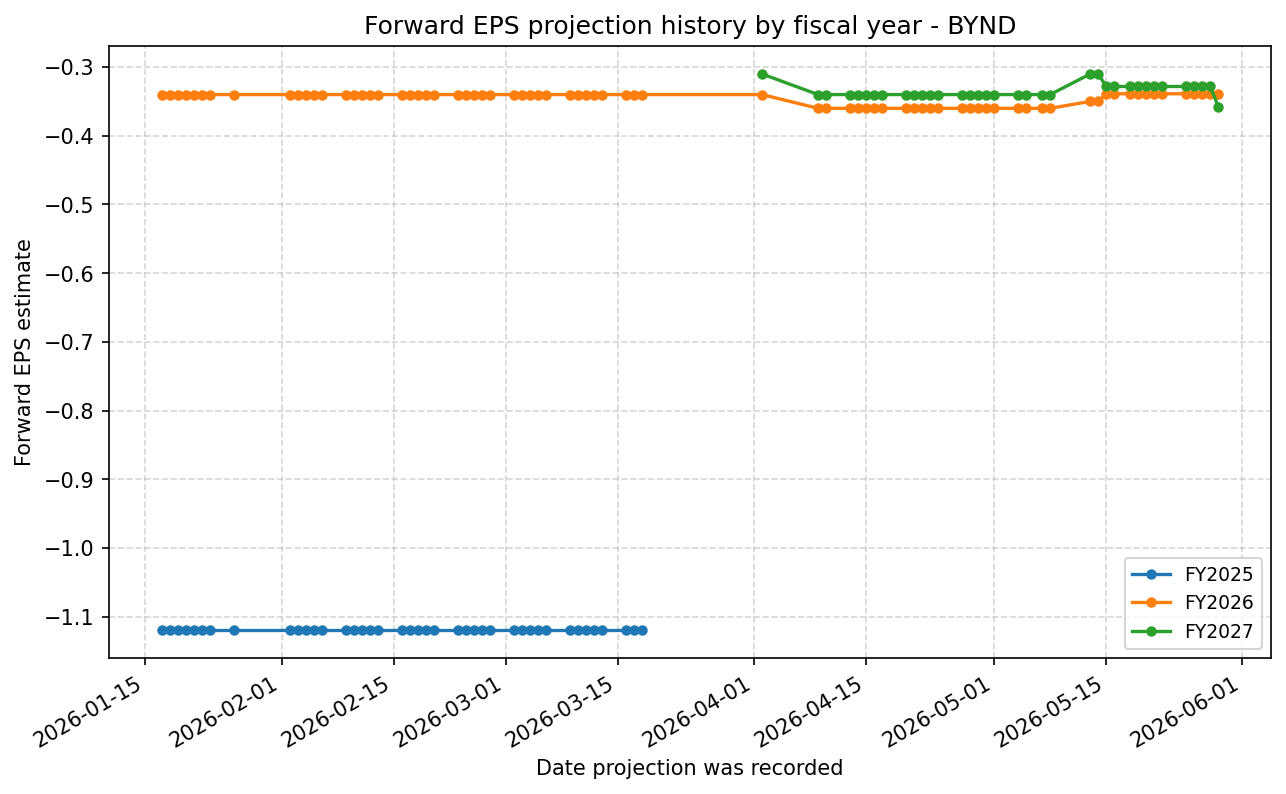
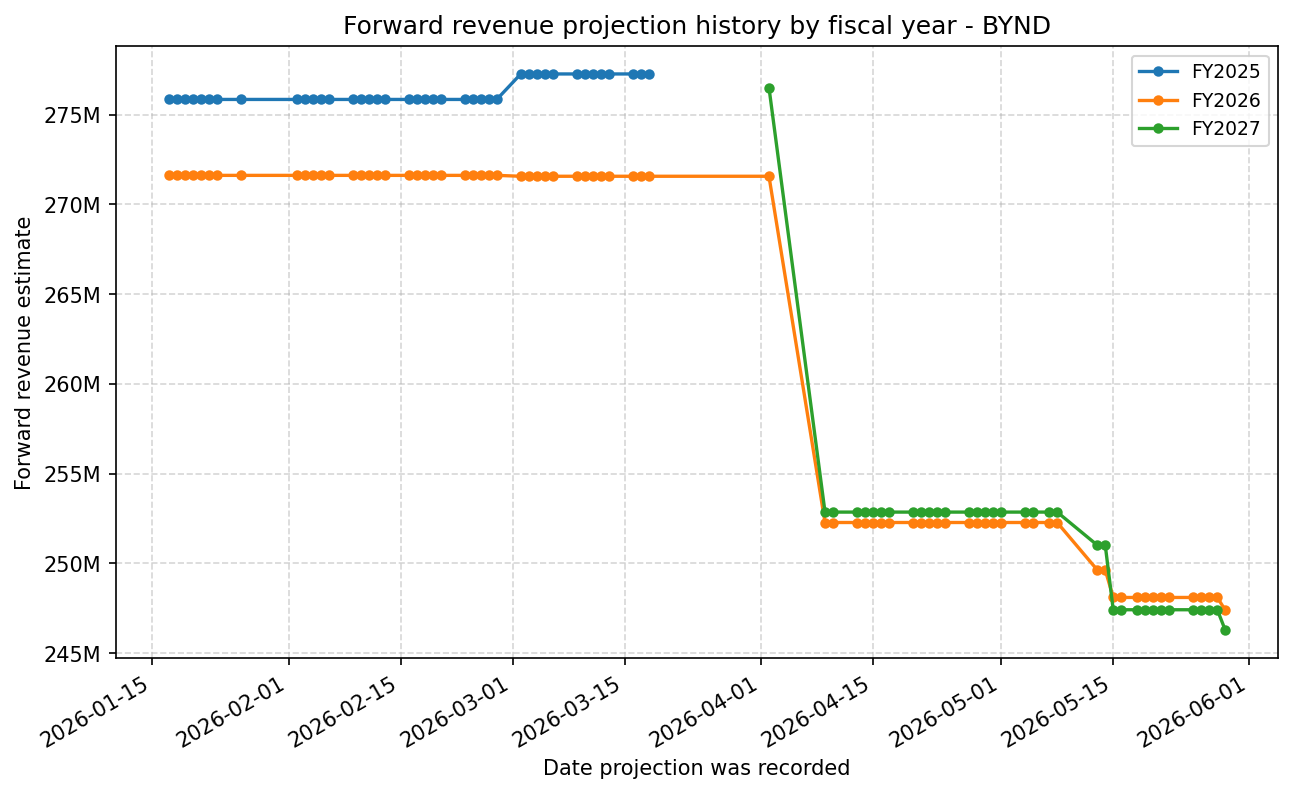
Forward Estimate History
How the next-FY EPS and revenue estimates have drifted over time. One line per fiscal year – past lines end when that FY became current.
Expenses
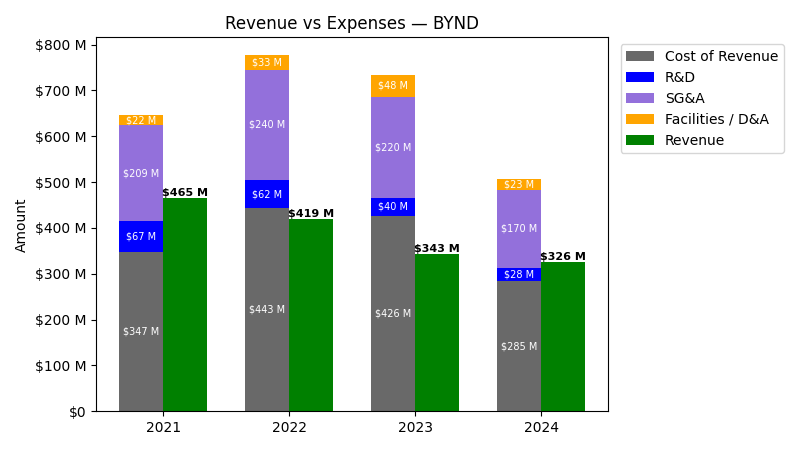
| Year | Revenue ($) | Cost of Revenue ($) | R&D ($) | SG&A ($) | Facilities / D&A ($) |
|---|---|---|---|---|---|
| 2022 | $418.9M | $410.1M | $62.3M | $239.5M | $32.6M |
| 2023 | $343.4M | $377.9M | $39.5M | $203.7M | $48.1M |
| 2024 | $326.5M | $261.6M | $28.1M | $169.7M | $23.1M |
| 2025 | $275.5M | $235.1M | $23.2M | $217.8M | $32.8M |
| TTM | $265.0M | $222.1M | $21.0M | $208.0M | $32.2M |
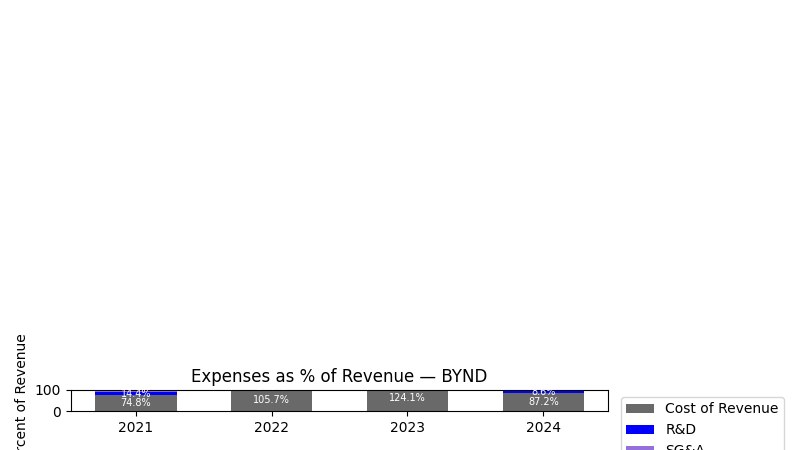
| Year | Revenue Change (%) | Cost of Revenue Change (%) | R&D Change (%) | SG&A Change (%) | Facilities / D&A Change (%) |
|---|---|---|---|---|---|
| 2023 | -18.04 | -7.84 | -36.51 | -14.95 | 47.61 |
| 2024 | -4.93 | -30.77 | -28.79 | -16.71 | -51.93 |
| 2025 | -15.61 | -10.15 | -17.46 | 28.34 | 41.75 |
| TTM | -3.82 | -5.52 | -9.65 | -4.50 | -1.81 |
No unmapped expenses.
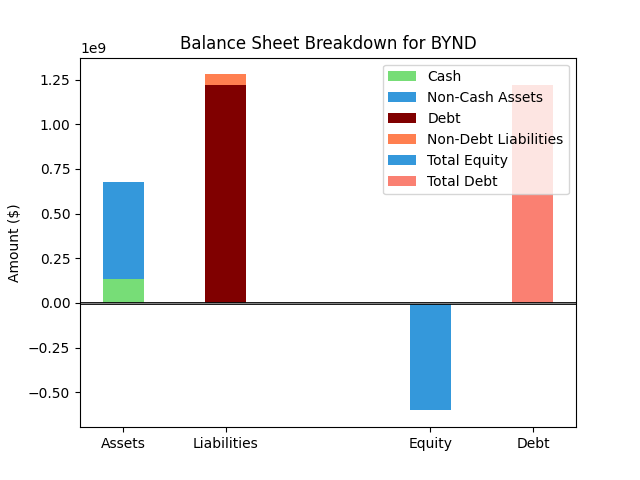
Balance Sheet
| Metric | Value | |
|---|---|---|
| 0 | Total Assets | $579M |
| 1 | Cash | $191M |
| 2 | Total Liabilities | $601M |
| 3 | Total Debt | $501M |
| 4 | Total Equity | $-21M |
| 5 | Debt to Equity Ratio | -23.76 |
EPS & Dividend

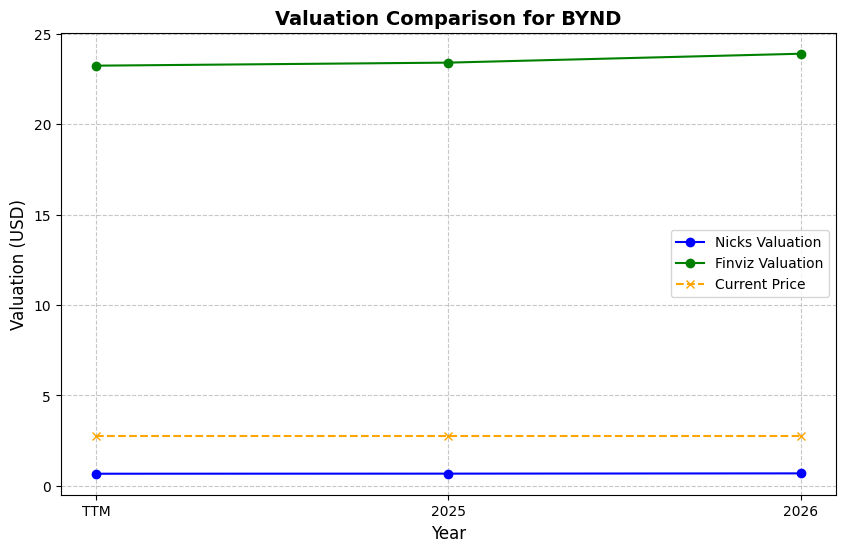
Valuation
| Share Price | Treasury Yield | Estimates | Fair Value (P/E) | Fair Value (P/S) | Current P/S | Current P/E |
|---|---|---|---|---|---|---|
| $0.79 | 4.5% | Nicks Growth: -2% Nick's Expected Margin: 3% FINVIZ Growth: 43% |
Nicks: 5 Finviz: 255 |
Nick's: 0.154 | 1.5 | - |
| Basis | Year | Nicks Valuation | Nicks vs Share Price | Finviz Valuation | Finviz vs Share Price |
|---|---|---|---|---|---|
| $0.51 Revenue | TTM | $0.08 | -90.0% | $3.93 | 398.9% |
| $0.48 Revenue | 2026 | $0.07 | -90.6% | $3.67 | 365.8% |
| $0.48 Revenue | 2027 | $0.07 | -90.7% | $3.66 | 363.7% |
Implied Growth

No implied growth data available.