Anheuser-Busch Inbev SA Sponsor — BUD
| Close Price | Market Cap | P/E Ratio | Forward P/E Ratio | Implied Growth* | Implied Forward Growth* | Dividend | P/B Ratio |
|---|---|---|---|---|---|---|---|
| $79.99 | $154.85B | 22.2 | 16.3 | 12.7% | 9.4% | $1.35 1.7% | 10.7 |
Latest Headlines
- · Anheuser-Busch InBev to Invest Over $10 Million in US Breweries
- · European Equities Traded in the US as American Depositary Receipts Edge Lower Thursday
- · Brown-Forman Q4 Earnings Around the Corner: Is a Beat Likely?
- · A Look At Anheuser Busch InBev’s Valuation After New Michelob ULTRA Investment In Williamsburg
- · How to Invest Now If You Want to Profit from the 2026 World Cup
- · Our $100,000 Blue-Chip Value Portfolio Pays $6,500 per Year and Offers Boomers Big Passive Income
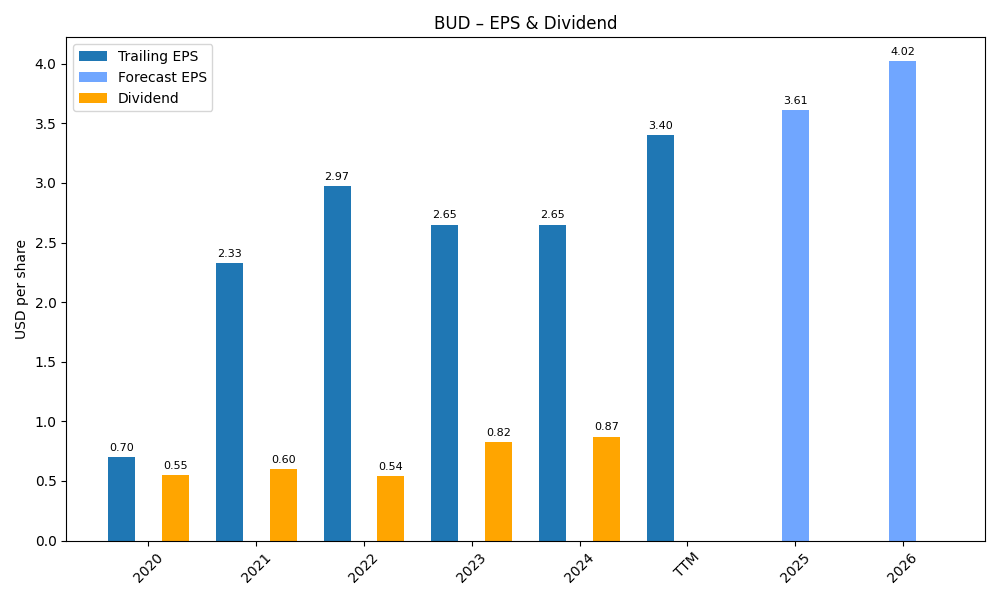
Revenue & Net Income
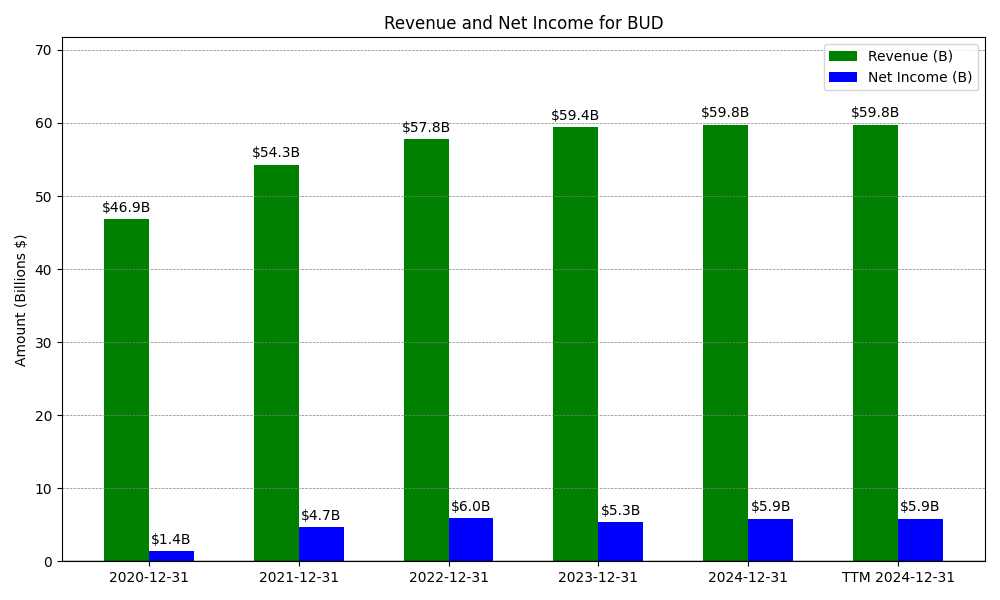
| Date | Revenue | Net_Income | EPS | Last_Updated | Revenue_Change | Net_Income_Change | EPS_Change | |
|---|---|---|---|---|---|---|---|---|
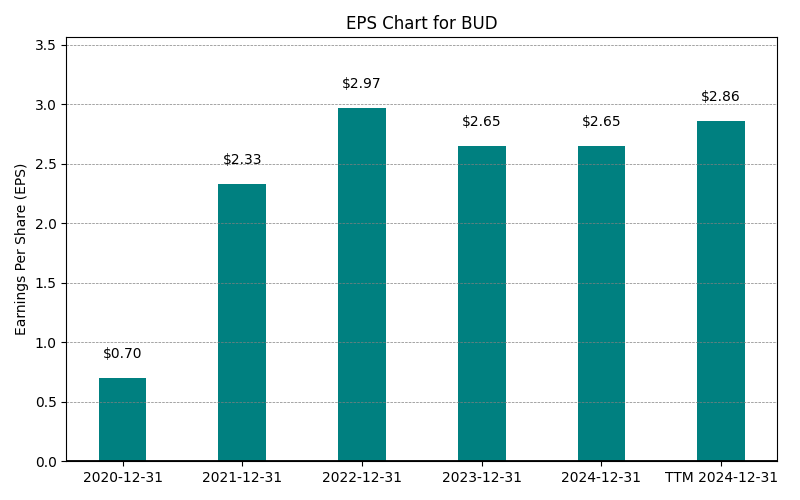
| 0 | 2020-12-31 | $46,881M | $1,405M | $0.70 | 2024-02-09 04:06:54 | N/A | N/A | N/A |
| 1 | 2021-12-31 | $54,304M | $4,670M | $2.33 | 2026-02-16 08:37:55 | 15.8% | 232.4% | 232.9% |
| 2 | 2022-12-31 | $57,786M | $5,969M | $2.97 | 2026-05-29 09:05:53 | 6.4% | 27.8% | 27.5% |
| 3 | 2023-12-31 | $59,380M | $5,341M | $2.65 | 2026-05-29 09:05:53 | 2.8% | -10.5% | -10.8% |
| 4 | 2024-12-31 | $59,768M | $5,855M | $2.92 | 2026-05-29 09:05:53 | 0.7% | 9.6% | 10.2% |
| 5 | 2025-12-31 | $59,320M | $6,837M | $3.45 | 2026-05-29 09:05:53 | -0.7% | 16.8% | 18.2% |
| 6 | TTM 2026-03-31 | $60,959M | $7,252M | $3.61 | 2026-05-08 08:31:13 | 2.8% | 6.1% | 4.6% |
EPS
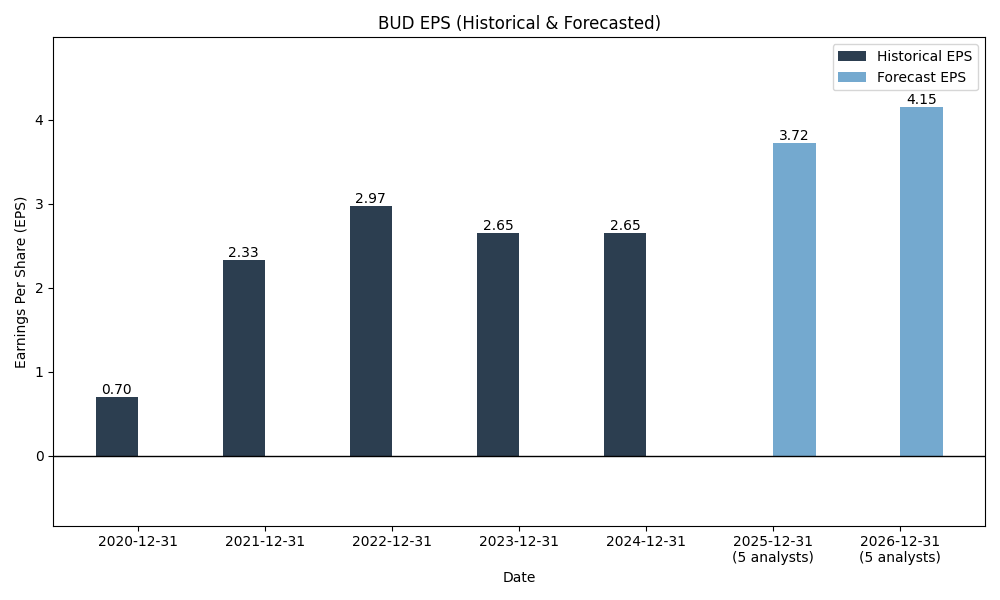
Forecasts
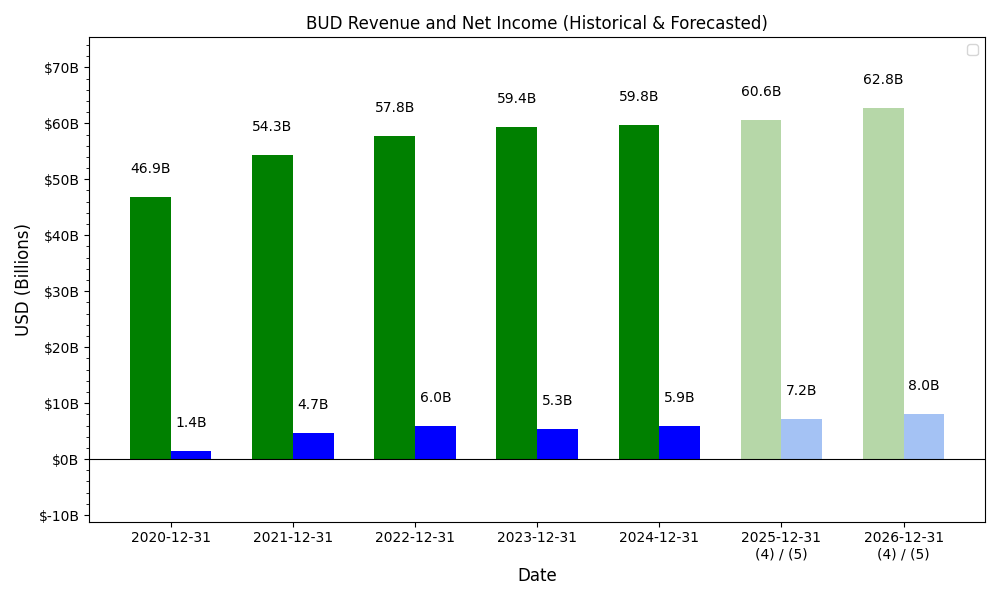
Y/Y % Change
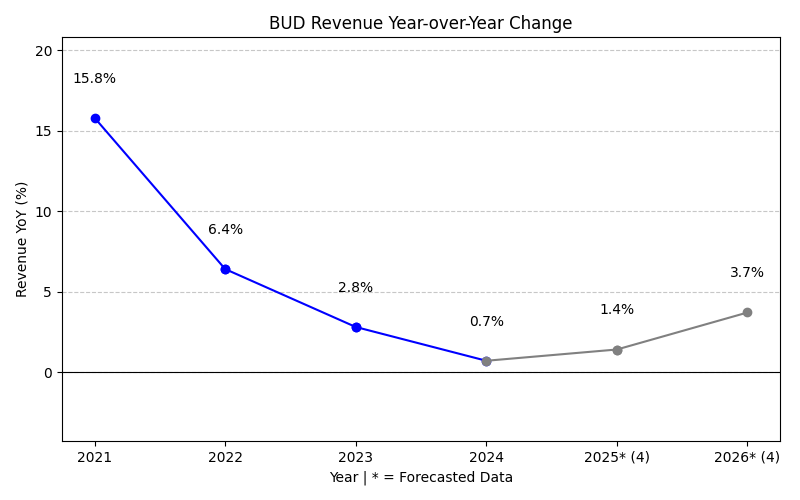
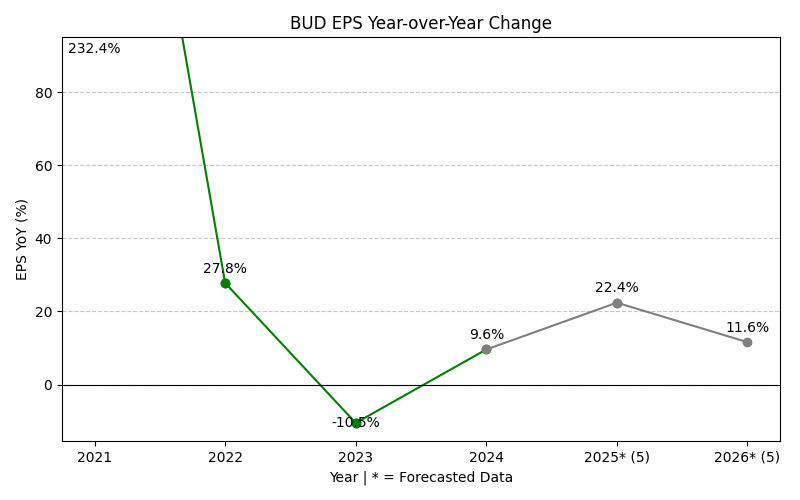
BUD Year-over-Year Growth
| 2020 | 2021 | 2022 | 2023 | 2024 | 2025 | 2026 | 2027 | Average | |
|---|---|---|---|---|---|---|---|---|---|
| Revenue Growth (%) | 15.8% | 6.4% | 2.8% | 0.7% | -0.7% | 8.6% | 3.8% | 5.3% | |
| Revenue Analysts (#) | 0 | 0 | 0 | 0 | 0 | 0 | 24 | 24 | |
| EPS Growth (%) | 232.4% | 27.8% | -10.5% | 9.6% | 16.8% | 24.5% | 11.9% | 44.6% | |
| EPS Analysts (#) | 0 | 0 | 0 | 0 | 0 | 0 | 9 | 9 |
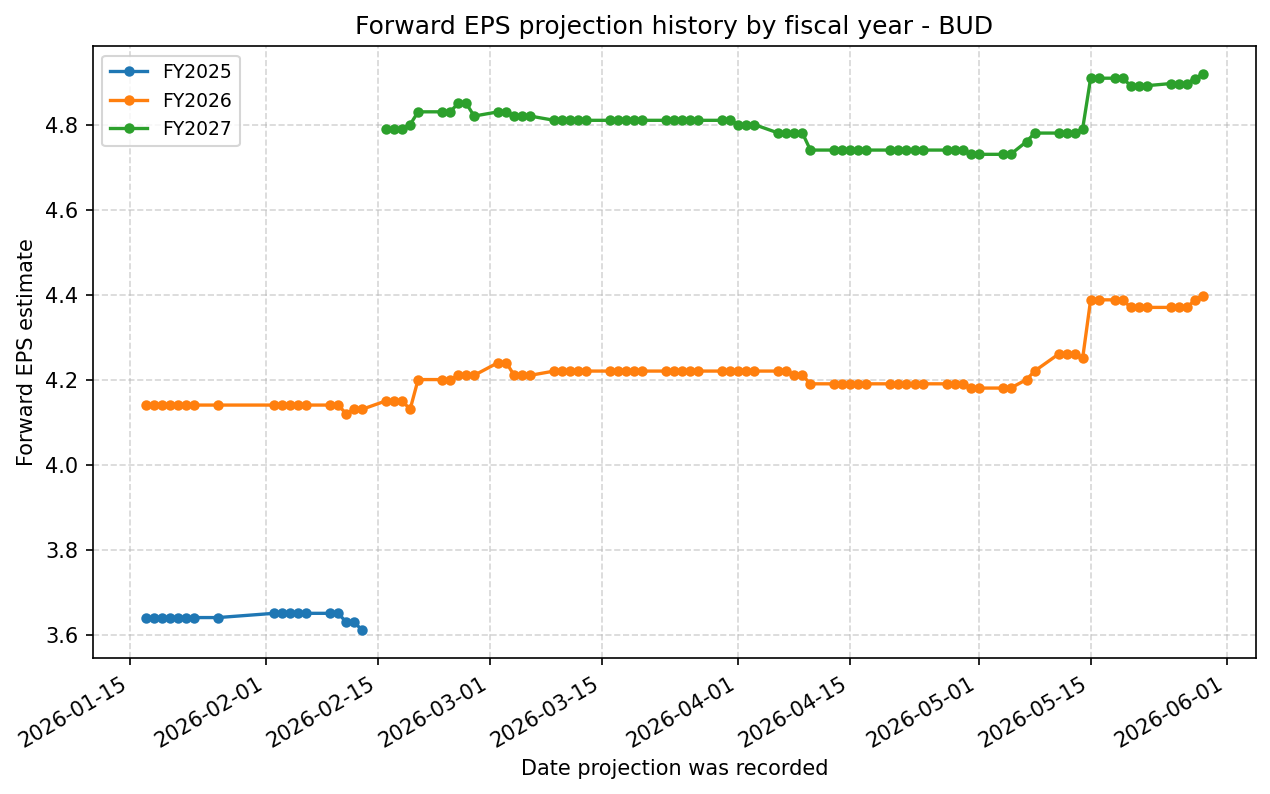
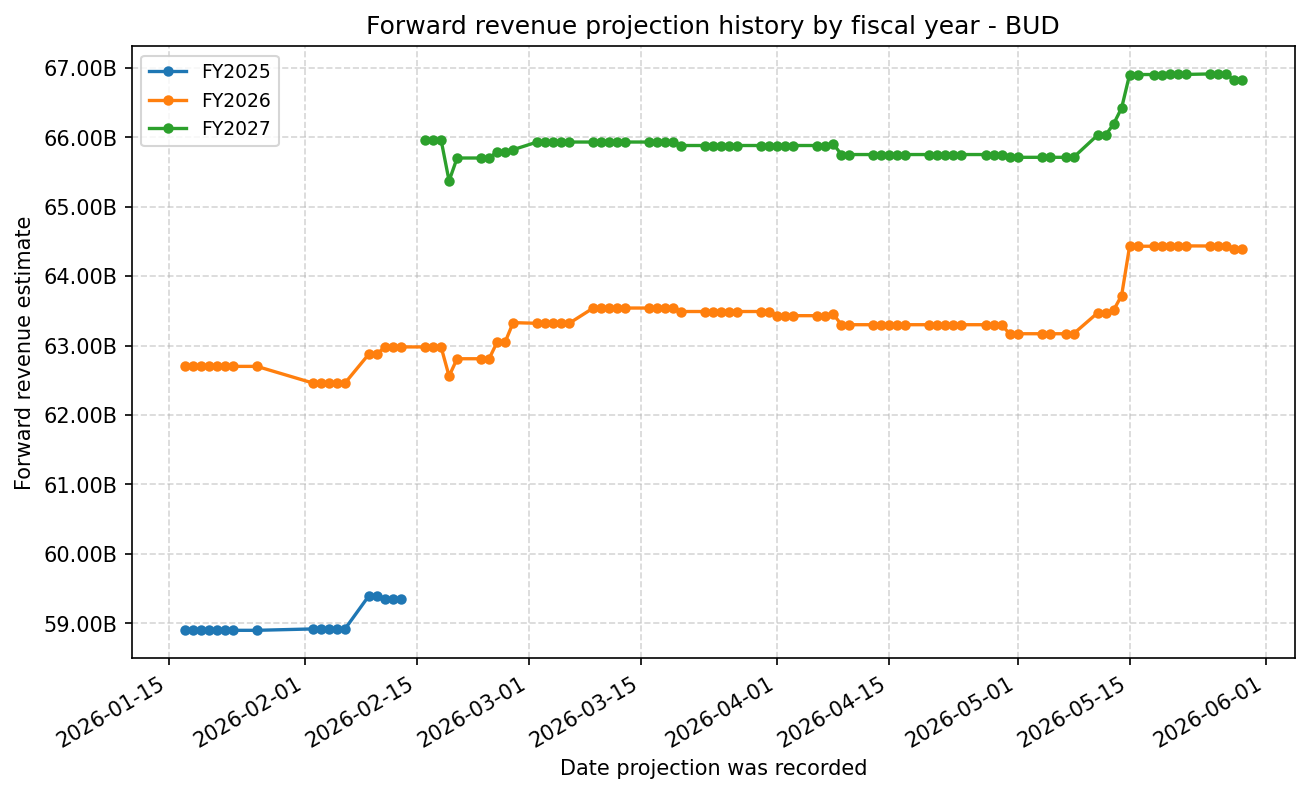
Forward Estimate History
How the next-FY EPS and revenue estimates have drifted over time. One line per fiscal year – past lines end when that FY became current.
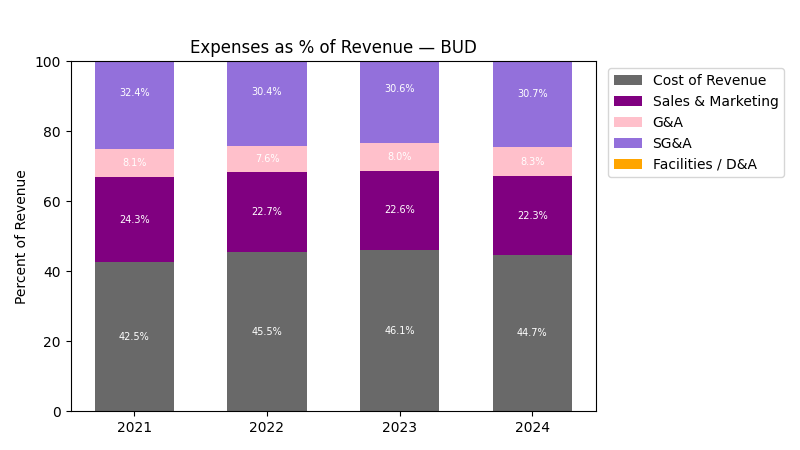
Expenses
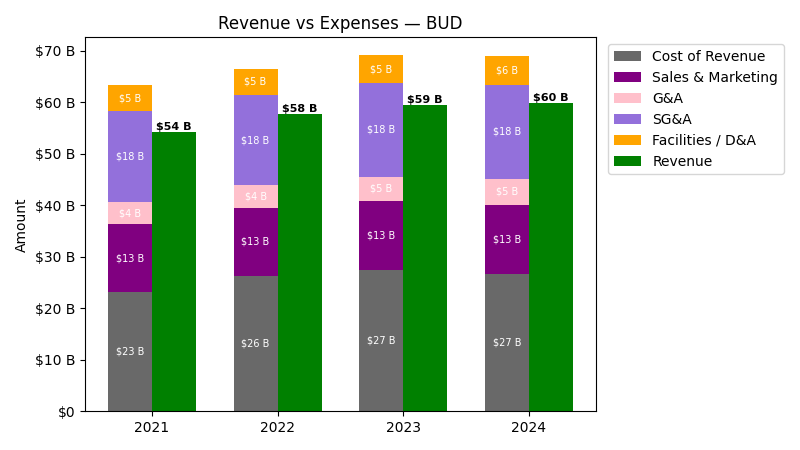
| Year | Revenue ($) | Cost of Revenue ($) | Sales & Marketing ($) | G&A ($) | SG&A ($) | Facilities / D&A ($) |
|---|---|---|---|---|---|---|
| 2022 | $57.8B | $21.2B | $13.1B | $4.4B | $17.6B | $5.1B |
| 2023 | $59.4B | $22.0B | $13.4B | $4.7B | $18.2B | $5.4B |
| 2024 | $59.8B | $21.2B | $13.4B | $5.0B | $18.3B | $5.5B |
| 2025 | $59.3B | $20.5B | $13.5B | $4.7B | $18.1B | $5.7B |
| TTM | $61.0B | $26.7B | $0.0 | $0.0 | $18.7B | $0.0 |
| Year | Revenue Change (%) | Cost of Revenue Change (%) | Sales & Marketing Change (%) | G&A Change (%) | SG&A Change (%) | Facilities / D&A Change (%) |
|---|---|---|---|---|---|---|
| 2023 | 2.76 | 3.57 | 2.24 | 7.34 | 3.52 | 6.56 |
| 2024 | 0.65 | -3.57 | -0.58 | 5.17 | 0.92 | 2.46 |
| 2025 | -0.75 | -3.35 | 0.82 | -6.34 | -1.13 | 1.95 |
| TTM | 2.76 | 30.40 | -100.00 | -100.00 | 3.06 | -100.00 |
No unmapped expenses.
Balance Sheet
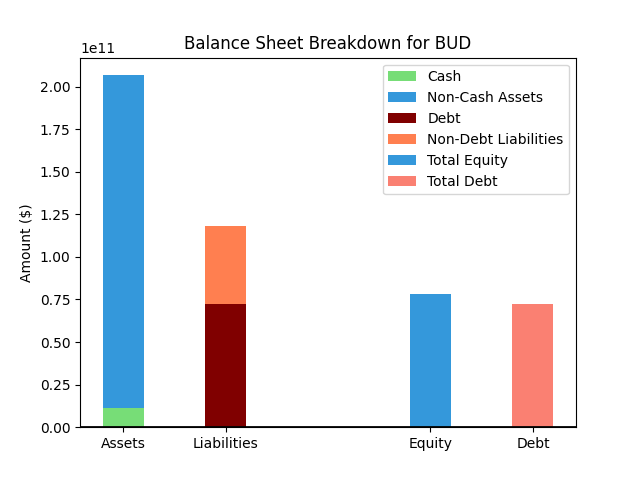
| Metric | Value | |
|---|---|---|
| 0 | Total Assets | $218,808M |
| 1 | Cash | $11,532M |
| 2 | Total Liabilities | $121,072M |
| 3 | Total Debt | $73,027M |
| 4 | Total Equity | $87,287M |
| 5 | Debt to Equity Ratio | 0.84 |
EPS & Dividend
Valuation
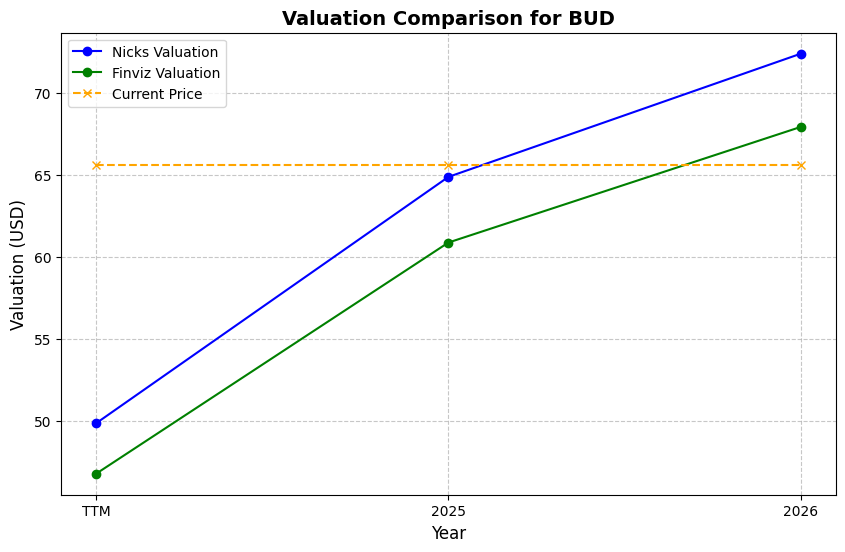
| Share Price | Treasury Yield | Estimates | Fair Value (P/E) | Fair Value (P/S) | Current P/S | Current P/E |
|---|---|---|---|---|---|---|
| $79.99 | 4.5% | Nicks Growth: 10% Nick's Expected Margin: 9% FINVIZ Growth: 13% |
Nicks: 17 Finviz: 22 |
Nick's: 1.544 | 2.5 | 22.2 |
| Basis | Year | Nicks Valuation | Nicks vs Share Price | Finviz Valuation | Finviz vs Share Price |
|---|---|---|---|---|---|
| $3.61 EPS | TTM | $61.94 | -22.6% | $80.11 | 0.1% |
| $4.40 EPS | 2026 | $75.45 | -5.7% | $97.58 | 22.0% |
| $4.92 EPS | 2027 | $84.40 | 5.5% | $109.16 | 36.5% |
Implied Growth
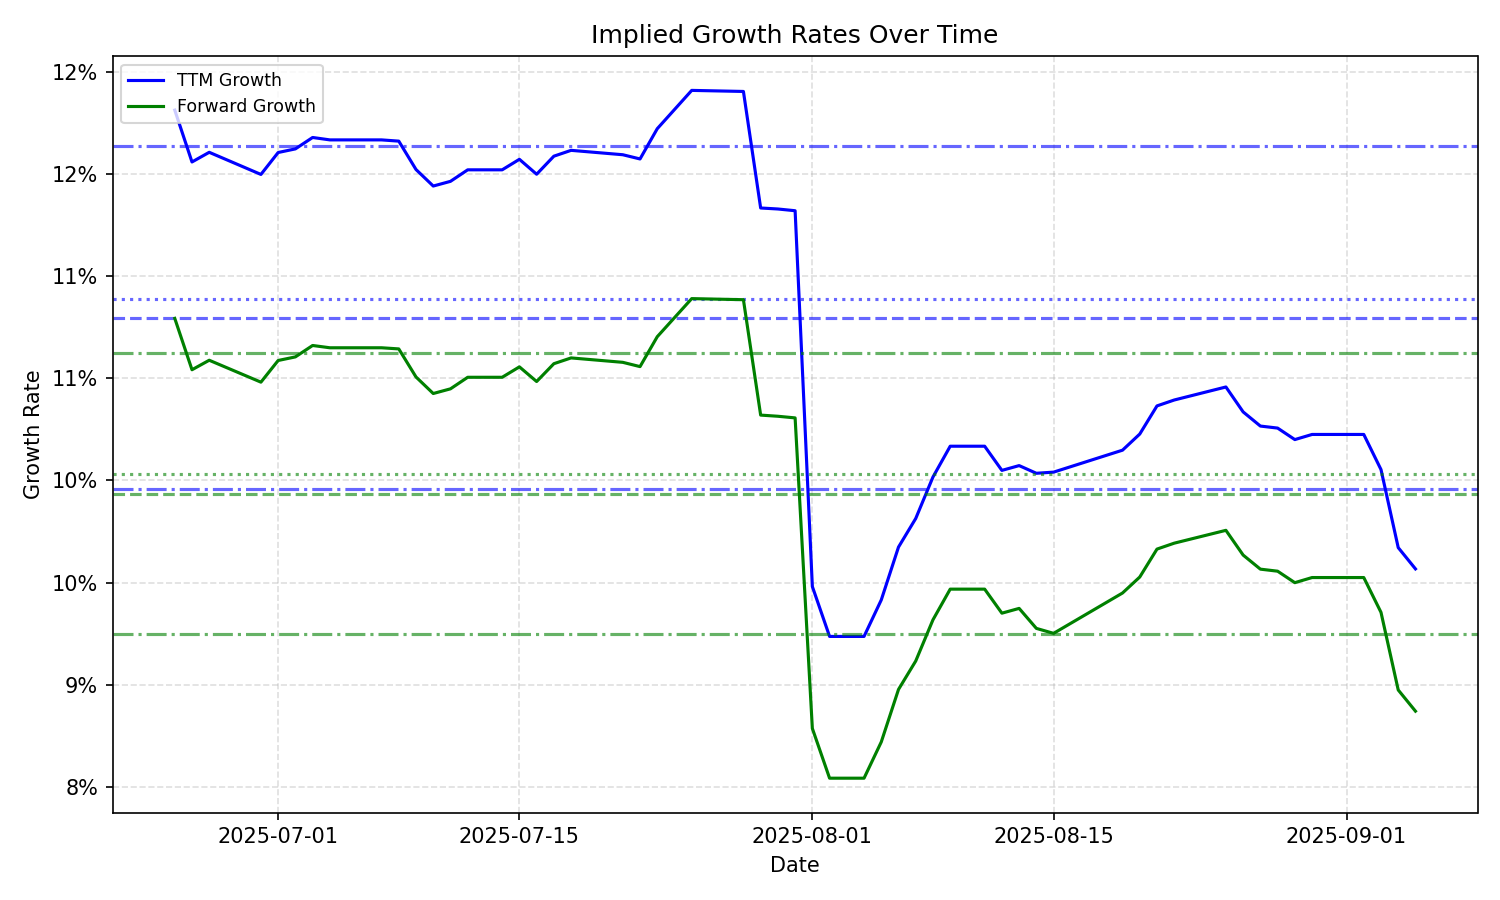
| Average | Median | Std Dev | Current | Percentile | ||||||
|---|---|---|---|---|---|---|---|---|---|---|
| TTM | Forward | TTM | Forward | TTM | Forward | TTM | Forward | TTM | Forward | |
| Timeframe | ||||||||||
| 1 Year | 11.47% | 9.18% | 11.65% | 9.10% | 1.27% | 0.73% | 13.00% | 9.70% | 92.9% | 80.4% |
| 3 Years | 11.47% | 9.18% | 11.65% | 9.10% | 1.27% | 0.73% | 13.00% | 9.70% | 92.9% | 80.4% |
| 5 Years | 11.47% | 9.18% | 11.65% | 9.10% | 1.27% | 0.73% | 13.00% | 9.70% | 92.9% | 80.4% |
| 10 Years | 11.47% | 9.18% | 11.65% | 9.10% | 1.27% | 0.73% | 13.00% | 9.70% | 92.9% | 80.4% |