Berkshire Hathaway Inc. New — BRK-B
| Close Price | Market Cap | P/E Ratio | Forward P/E Ratio | Implied Growth* | Implied Forward Growth* | Dividend | P/B Ratio |
|---|---|---|---|---|---|---|---|
| $474.48 | $1.02T | 14.1 | 22.3 | 8.0% | 12.8% | - | 0.0 |
Latest Headlines
- · Why Occidental Petroleum Is a Buy Despite Falling Oil Prices
- · Why Berkshire Hathaway Is Now My Favorite Stock for 2026 and Beyond
- · Jim Cramer on Berkshire Hathaway: “People Are Going to Get Bored With Owning This Stock”
- · Jim Cramer Says Meta “Has Not Excelled in a Visible Way”
- · 5 Warren Buffett Stocks to Hold Forever
- · The No. 1 Holding in Warren Buffett's $786 Million "Secret" Portfolio Is a Bona Fide Millionaire-Maker (but There's a Catch)
Revenue & Net Income
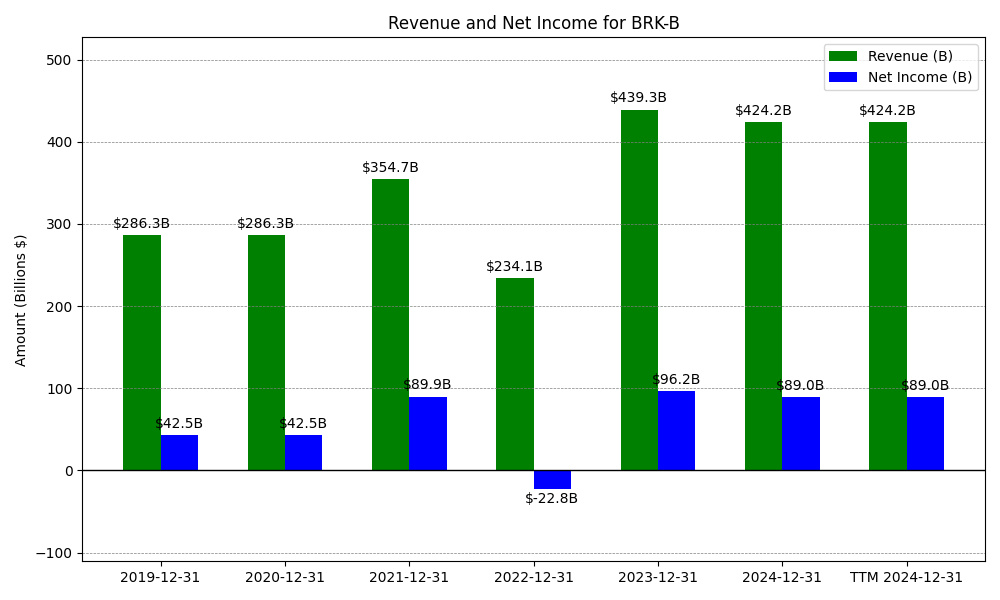
| Date | Revenue | Net_Income | EPS | Last_Updated | Revenue_Change | Net_Income_Change | EPS_Change | |
|---|---|---|---|---|---|---|---|---|
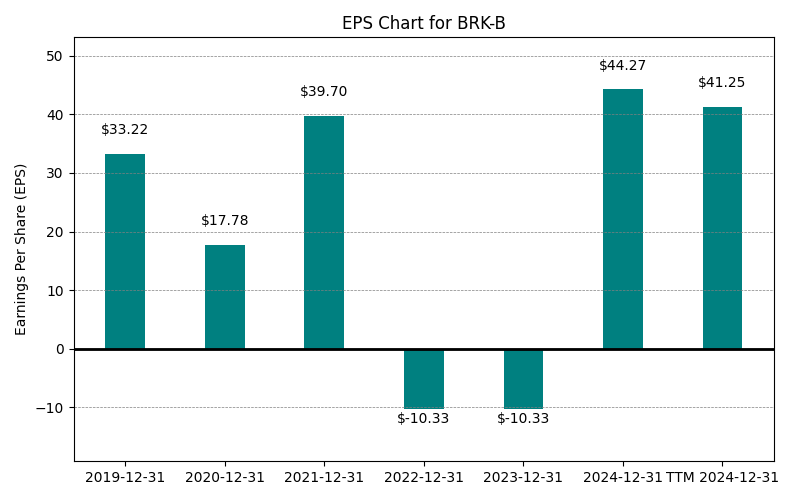
| 0 | 2019-12-31 | $286,325M | $42,521M | $33.22 | 2024-05-25 13:04:58 | N/A | N/A | N/A |
| 1 | 2020-12-31 | $286,325M | $42,521M | $17.78 | 2024-02-03 03:17:10 | 0.0% | 0.0% | -46.5% |
| 2 | 2021-12-31 | $234,121M | $-22,759M | $39.70 | 2026-05-29 09:05:40 | -18.2% | -153.5% | 123.3% |
| 3 | 2022-12-31 | $234,121M | $-22,759M | $-10.33 | 2026-05-29 09:05:40 | 0.0% | 0.0% | -126.0% |
| 4 | 2023-12-31 | $439,337M | $96,223M | $44.27 | 2026-05-29 09:05:40 | 87.7% | -522.8% | -528.6% |
| 5 | 2024-12-31 | $424,232M | $88,995M | $41.27 | 2026-05-29 09:05:40 | -3.4% | -7.5% | -6.8% |
| 6 | 2025-12-31 | $410,522M | $66,968M | $41.27 | 2026-05-29 09:05:40 | -3.2% | -24.8% | 0.0% |
| 7 | TTM 2026-03-31 | $302,391M | $41,675M | $33.61 | 2026-05-07 08:53:43 | -26.3% | -37.8% | -18.6% |
EPS
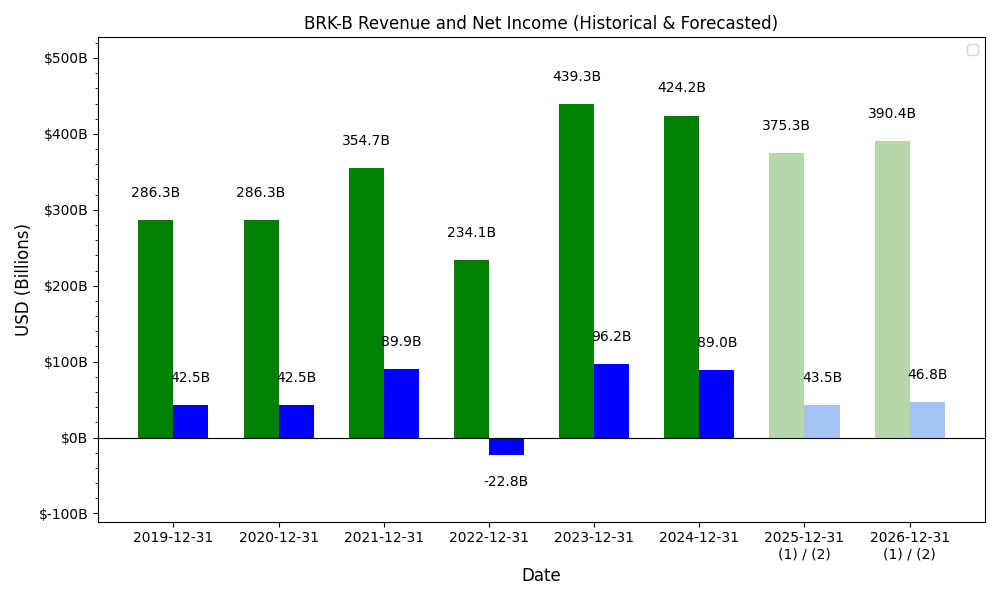
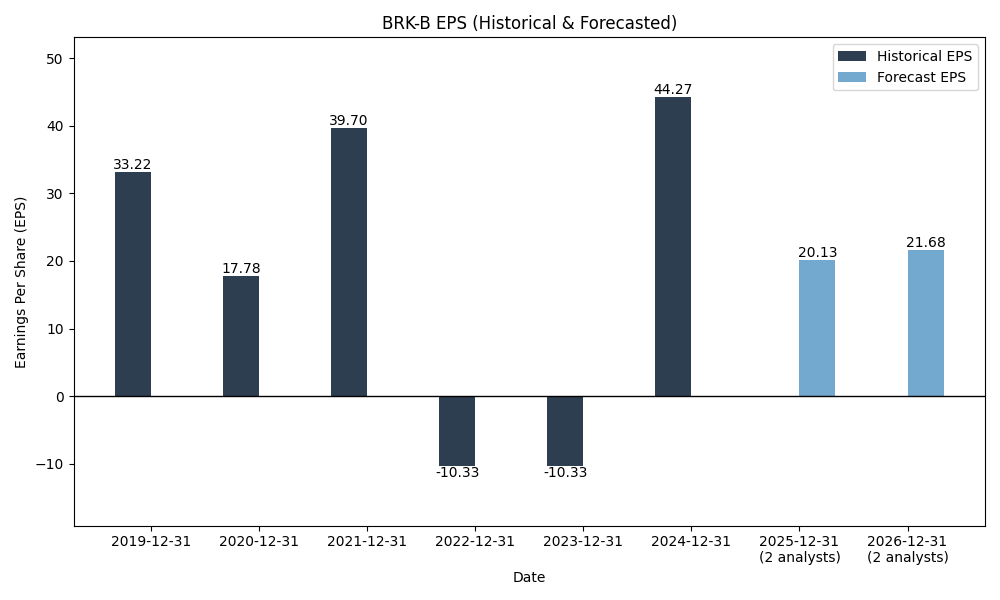
Forecasts
Y/Y % Change
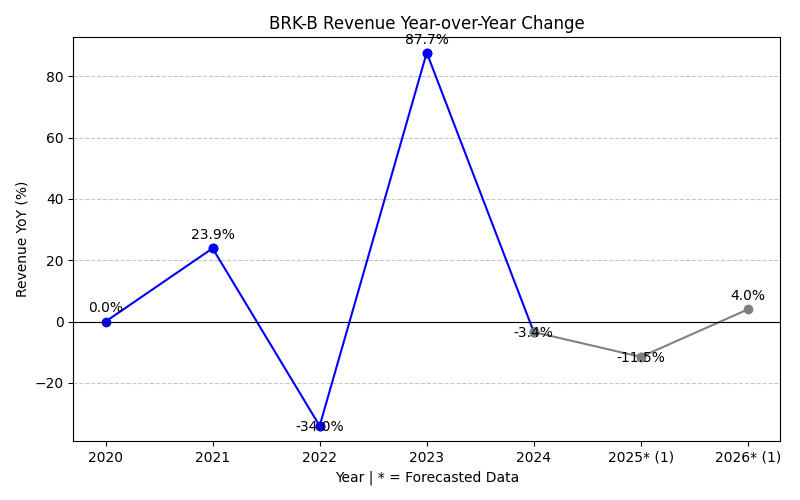
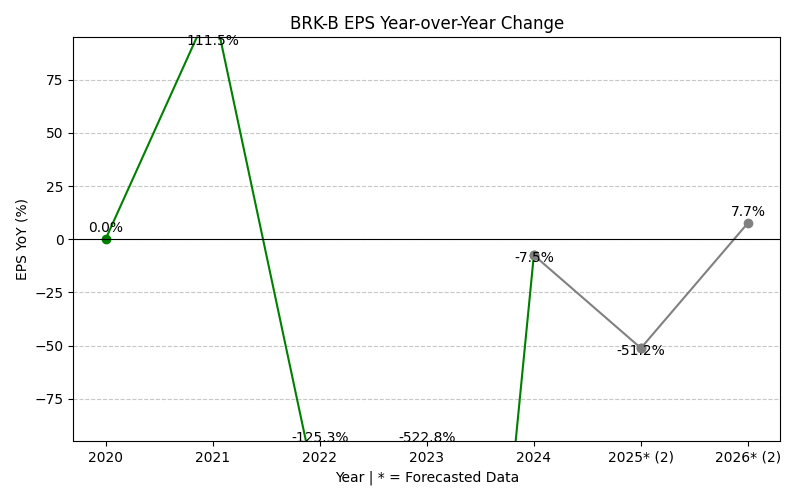
BRK-B Year-over-Year Growth
| 2019 | 2020 | 2021 | 2022 | 2023 | 2024 | 2025 | 2026 | 2027 | Average | |
|---|---|---|---|---|---|---|---|---|---|---|
| Revenue Growth (%) | 0.0% | -18.2% | 0.0% | 87.7% | -3.4% | -3.2% | -5.6% | 3.5% | 7.6% | |
| Revenue Analysts (#) | 0 | 0 | 0 | 0 | 0 | 0 | 0 | 2 | 2 | |
| EPS Growth (%) | 0.0% | -153.5% | 0.0% | -522.8% | -7.5% | -24.8% | -34.3% | 4.5% | -92.3% | |
| EPS Analysts (#) | 0 | 0 | 0 | 0 | 0 | 0 | 0 | 2 | 3 |
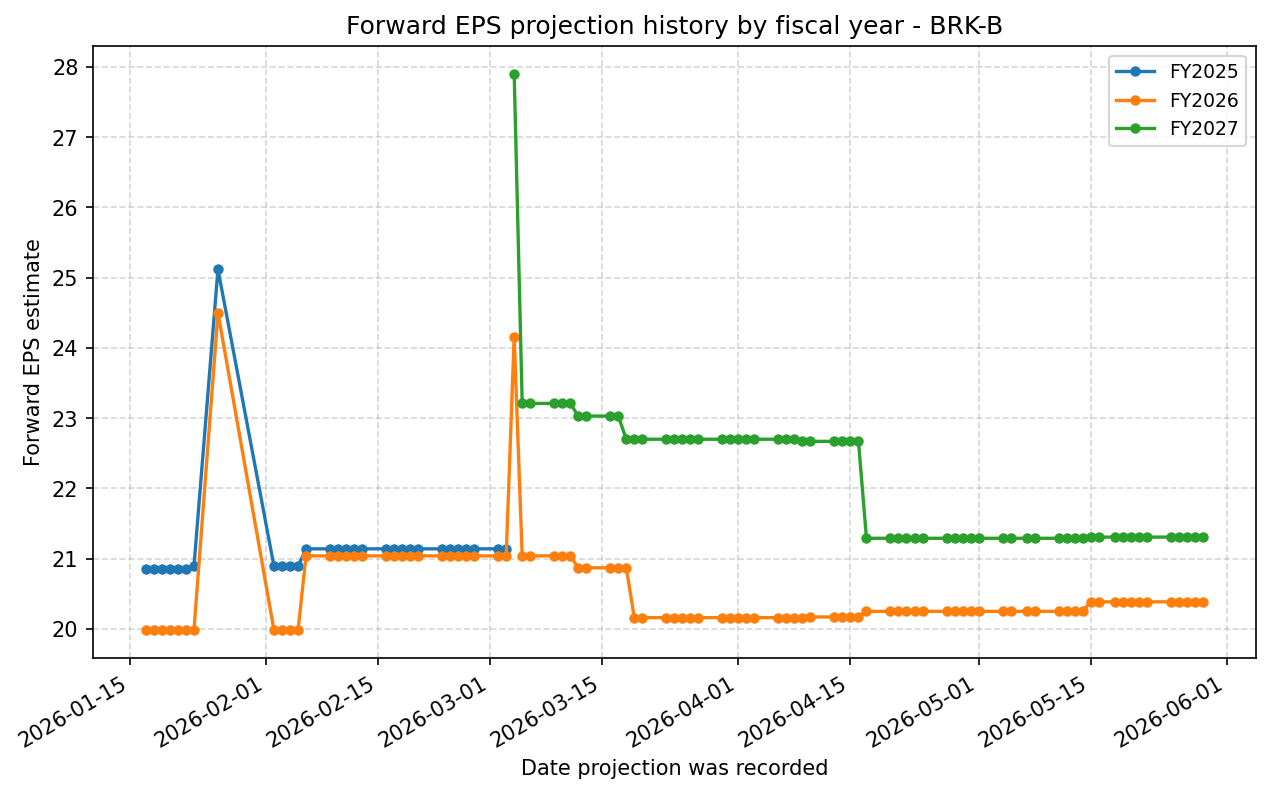
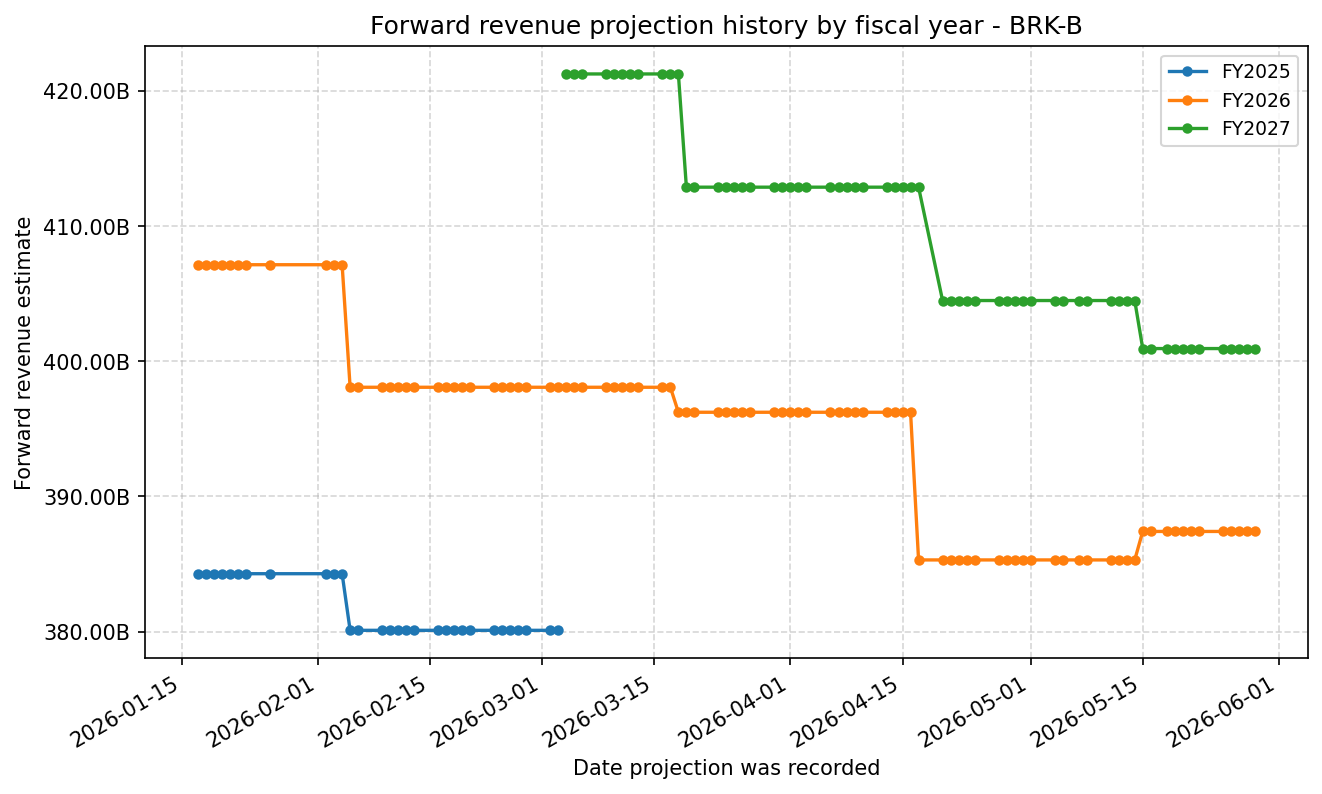
Forward Estimate History
How the next-FY EPS and revenue estimates have drifted over time. One line per fiscal year – past lines end when that FY became current.
Expenses
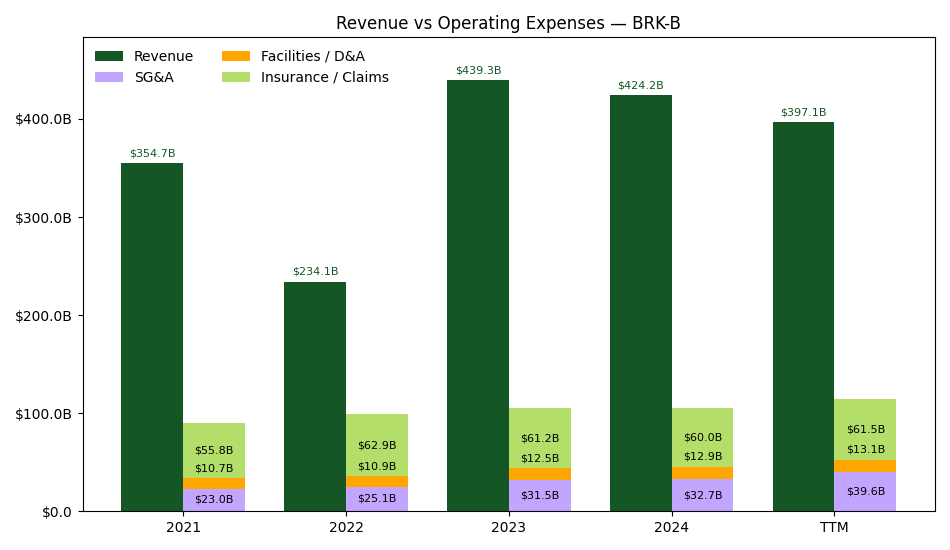
| Year | Revenue ($) | Sales & Marketing ($) | G&A ($) | SG&A ($) | Facilities / D&A ($) | Insurance / Claims ($) |
|---|---|---|---|---|---|---|
| 2022 | $234.1B | $19.5B | $25.1B | $25.1B | $10.9B | $62.9B |
| 2023 | $439.3B | $25.5B | $31.5B | $31.5B | $12.5B | $61.2B |
| 2024 | $424.2B | $25.6B | $32.7B | $32.7B | $12.9B | $60.0B |
| 2025 | $410.5B | $0.0 | $37.4B | $37.4B | $13.5B | $61.7B |
| TTM | $302.4B | $0.0 | $28.3B | $28.3B | $10.4B | $46.3B |
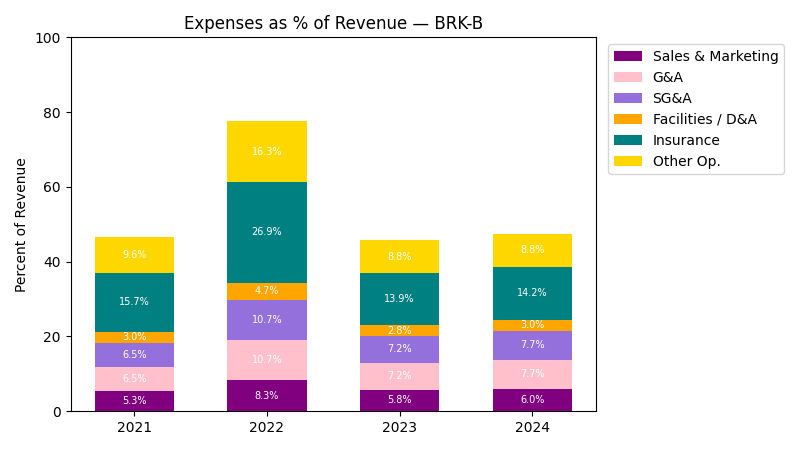
| Year | Revenue Change (%) | Sales & Marketing Change (%) | G&A Change (%) | SG&A Change (%) | Facilities / D&A Change (%) | Insurance / Claims Change (%) |
|---|---|---|---|---|---|---|
| 2023 | 87.65 | 30.51 | 25.70 | 25.70 | 14.56 | -2.66 |
| 2024 | -3.44 | 0.72 | 3.86 | 3.86 | 2.96 | -1.91 |
| 2025 | -3.23 | -100.00 | 14.40 | 14.40 | 4.83 | 2.73 |
| TTM | -26.34 | NaN | -24.44 | -24.44 | -22.91 | -24.87 |
No unmapped expenses.
Segment Performance
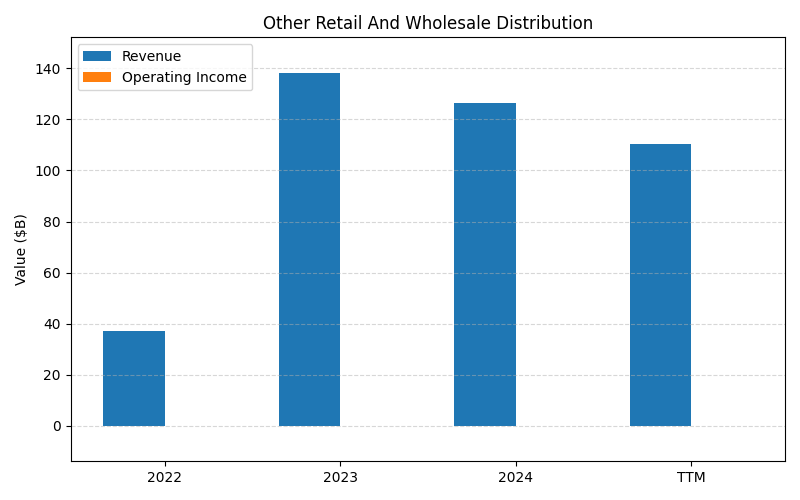
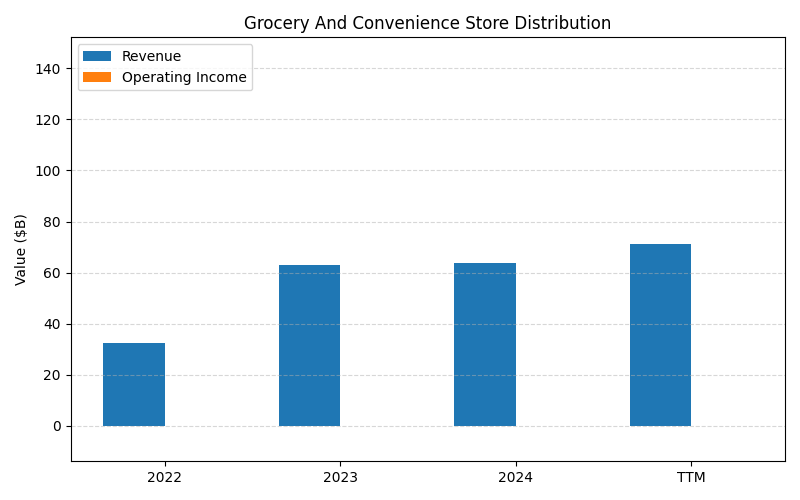
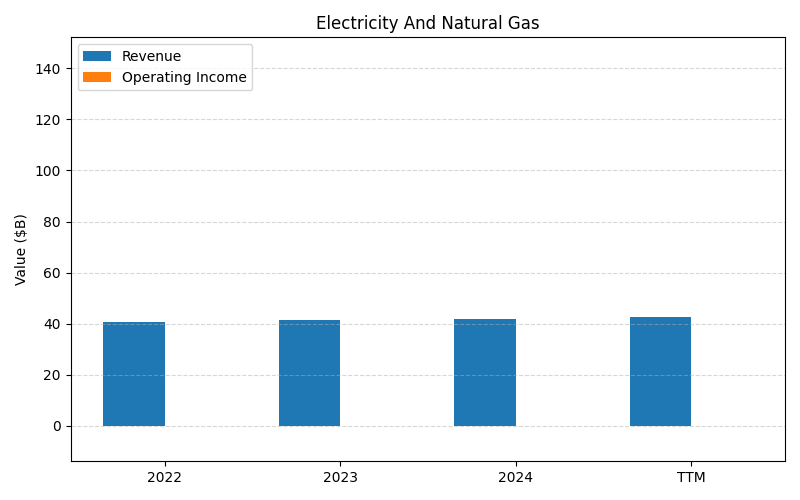
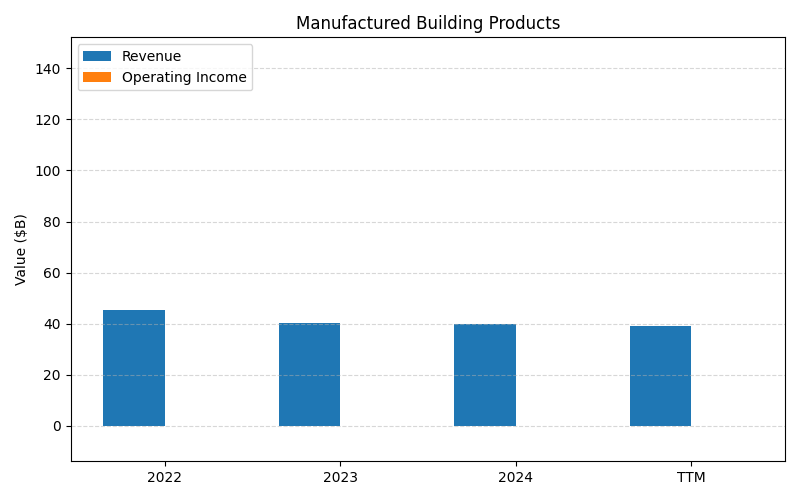
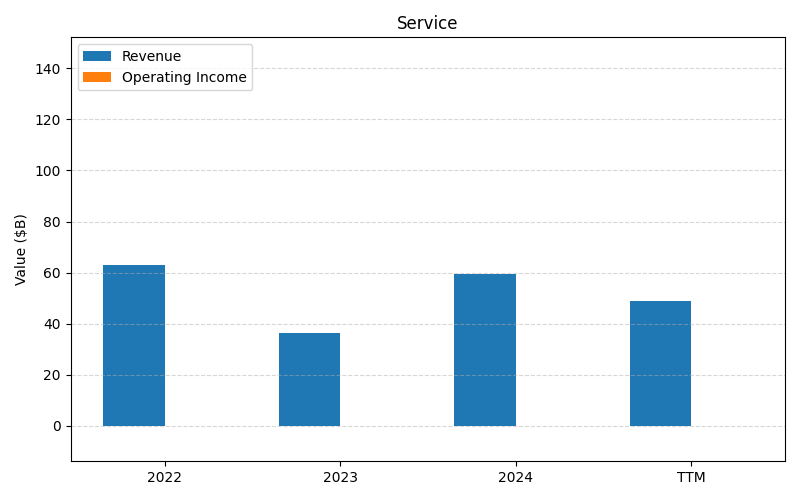
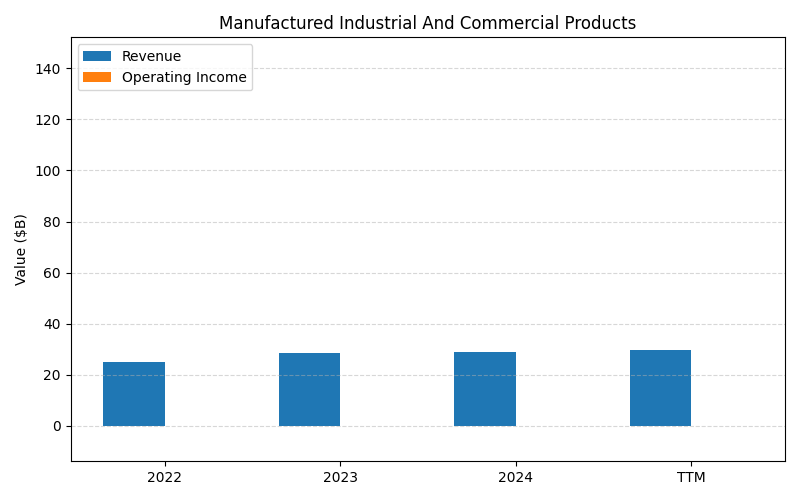
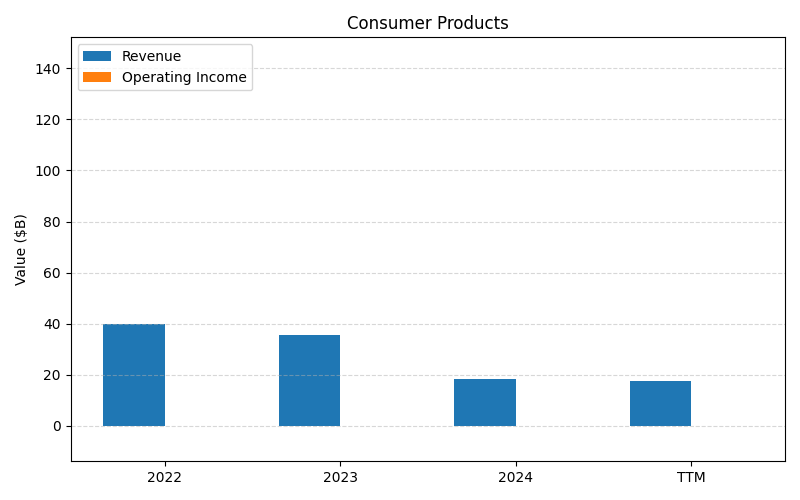
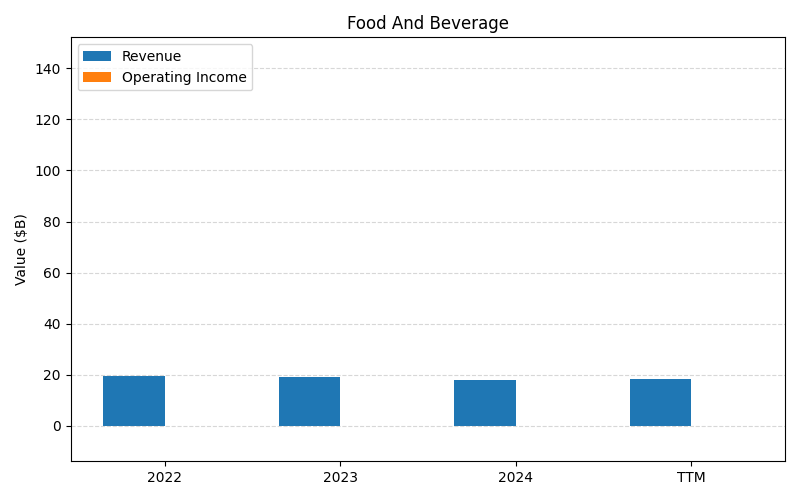
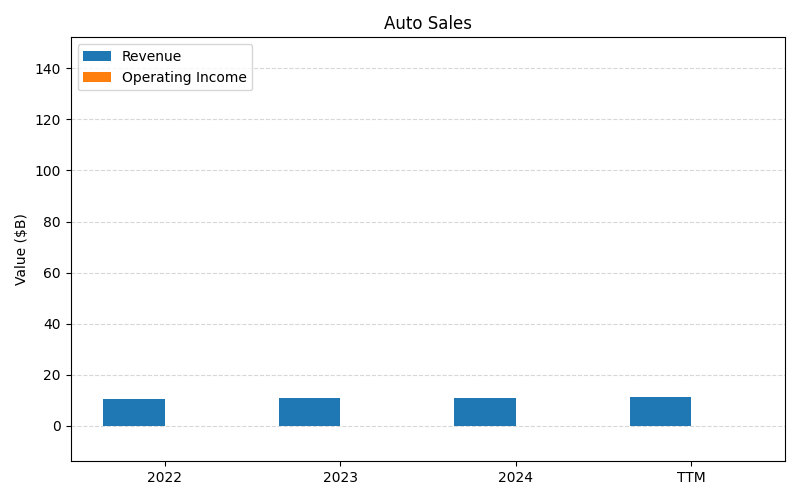
SEGMENTS v2025-09-09 · 2026-05-29 09:05 UTC — Units: $B. Rows list fiscal years (last 3 + TTM) with revenue for each segment; the final row shows the TTM revenue mix (operating income columns display “—” where mix is not applicable).
| Year | Other Retail And Wholesale Distribution Rev | Grocery And Convenience Store Distribution Rev | Electricity And Natural Gas Rev | Manufactured Building Products Rev | Services Rev | Manufactured Industrial And Commercial Products Rev | Consumer Products Rev | Food And Beverage Rev | Auto Sales Rev | Total Rev |
|---|---|---|---|---|---|---|---|---|---|---|
| 2023 | 138.3B | 31.5B | 41.3B | 40.2B | 60B | 28.5B | 35.4B | 19B | 10.7B | 405.1B |
| 2024 | 126.3B | 63.7B | 42B | 39.8B | 36.2B | 29.1B | 18.2B | 18.1B | 10.8B | 384.2B |
| 2025 | 117.5B | 30.7B | 42.7B | 39.2B | 37.1B | 30.5B | 17.9B | 18.6B | 11.3B | 345.5B |
| TTM | 303.7B | 116.1B | 106.7B | 97.5B | 91.3B | 76.4B | 52.7B | 45.7B | 27.4B | 917.5B |
| % of Total (TTM) | 33.1% | 12.6% | 11.6% | 10.6% | 10.0% | 8.3% | 5.7% | 5.0% | 3.0% | 100% |
Segment Performance (Axis 2)
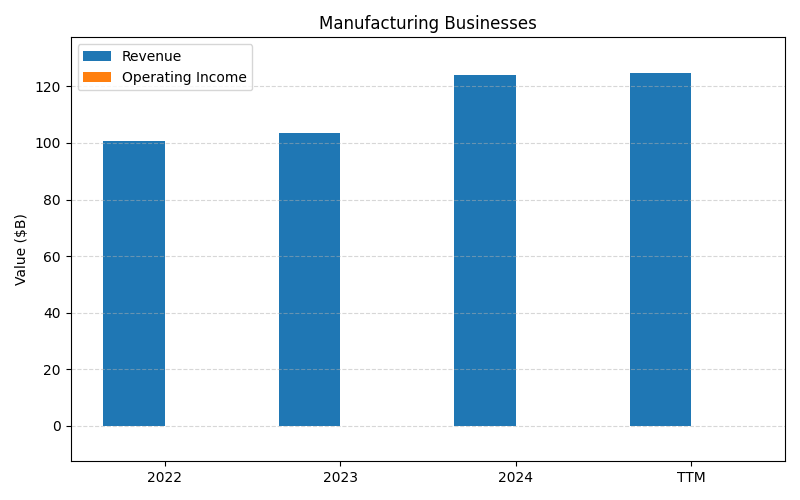
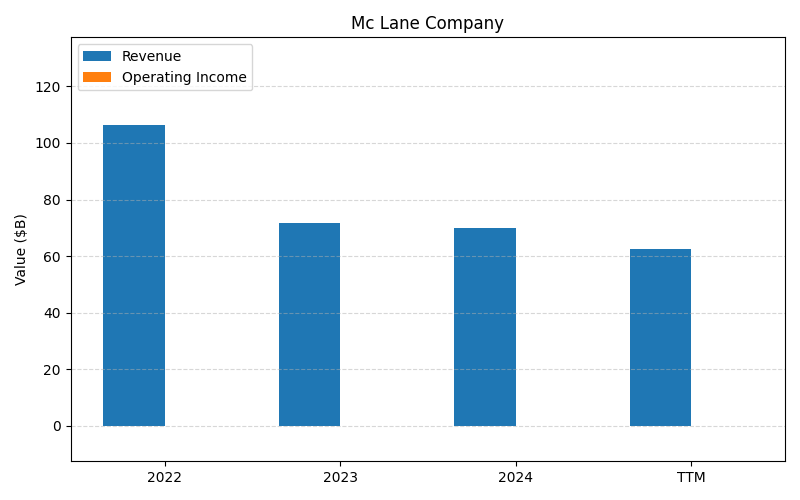
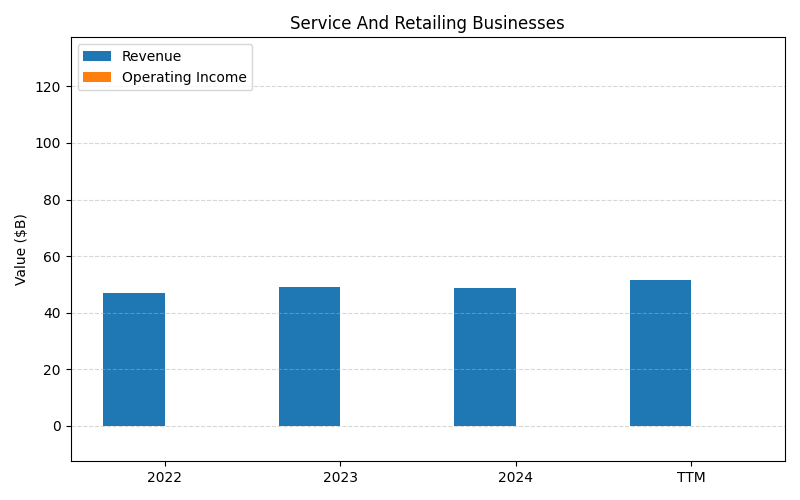
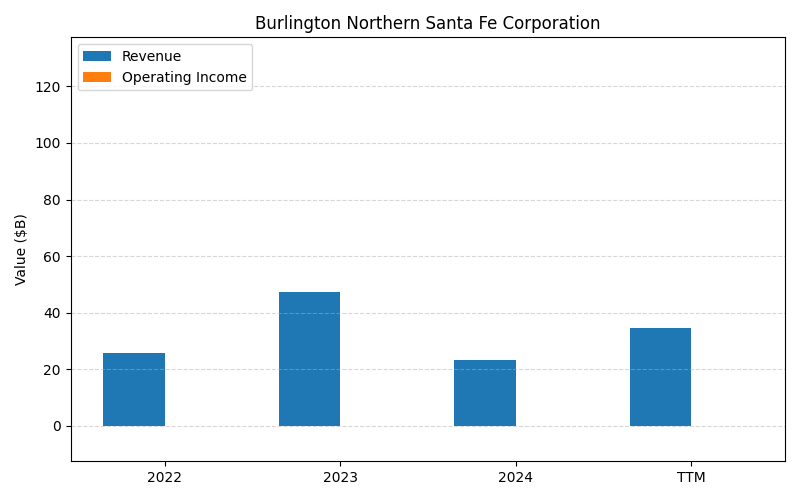
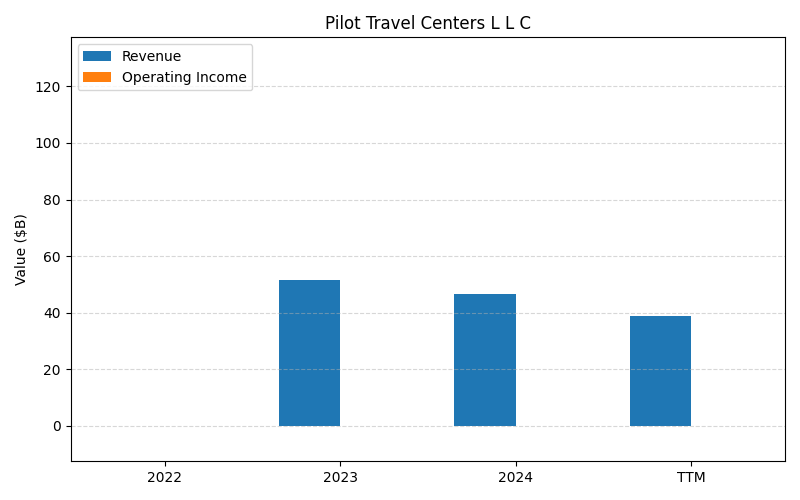
SEGMENTS v2025-09-09 · 2026-05-29 09:05 UTC — Units: $B. Rows list fiscal years (last 3 + TTM) with revenue for each segment; the final row shows the TTM revenue mix (operating income columns display “—” where mix is not applicable).
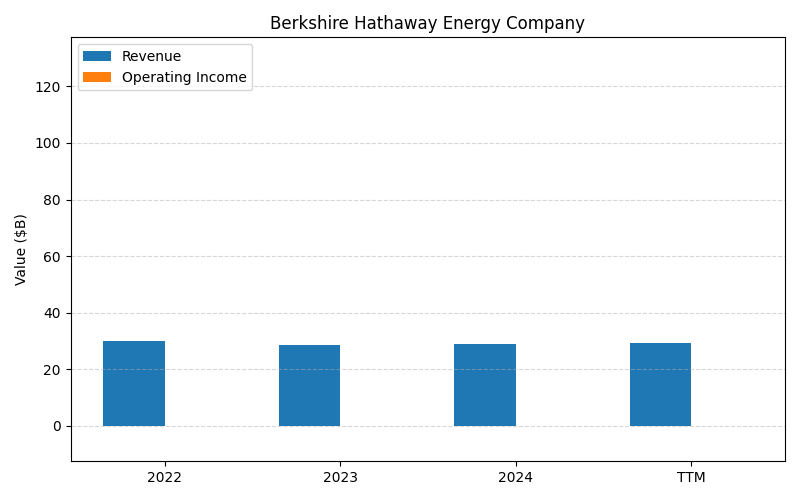
| Year | Manufacturing Businesses Rev | Mc Lane Company Rev | Service And Retailing Businesses Rev | Burlington Northern Santa Fe Corporation Rev | Pilot Travel Centers L L C Rev | Berkshire Hathaway Energy Company Rev | Total Rev |
|---|---|---|---|---|---|---|---|
| 2023 | 103.4B | 103.3B | 49B | 23.7B | 51.5B | 28.8B | 359.6B |
| 2024 | 124B | 70B | 48.6B | 46.6B | 46.7B | 29.1B | 365B |
| 2025 | 126.1B | 100.4B | 52B | 46.5B | 41.9B | 29.4B | 396.2B |
| TTM | 305.7B | 210.4B | 126B | 116.2B | 110B | 72.7B | 940.9B |
| % of Total (TTM) | 32.5% | 22.4% | 13.4% | 12.4% | 11.7% | 7.7% | 100% |
Balance Sheet
| Metric | Value | |
|---|---|---|
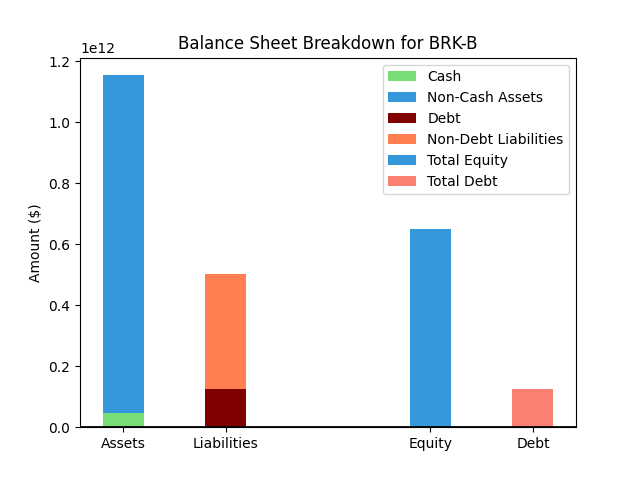
| 0 | Total Assets | $1,252,271M |
| 1 | Cash | $58,122M |
| 2 | Total Liabilities | $522,821M |
| 3 | Total Debt | $128,886M |
| 4 | Total Equity | $727,181M |
| 5 | Debt to Equity Ratio | 0.18 |
EPS & Dividend

Valuation
| Share Price | Treasury Yield | Estimates | Fair Value (P/E) | Fair Value (P/S) | Current P/S | Current P/E |
|---|---|---|---|---|---|---|
| $474.48 | 4.5% | Nicks Growth: 8% Nick's Expected Margin: 14% FINVIZ Growth: 2% |
Nicks: 14 Finviz: 8 |
Nick's: 1.984 | 3.4 | 14.1 |
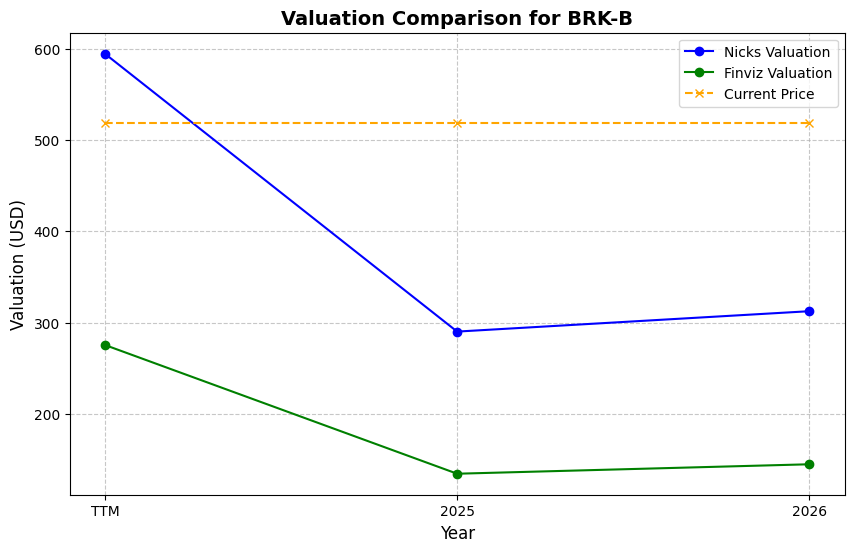
| Basis | Year | Nicks Valuation | Nicks vs Share Price | Finviz Valuation | Finviz vs Share Price |
|---|---|---|---|---|---|
| $33.61 EPS | TTM | $476.26 | 0.4% | $255.28 | -46.2% |
| $20.39 EPS | 2026 | $288.87 | -39.1% | $154.84 | -67.4% |
| $21.31 EPS | 2027 | $301.92 | -36.4% | $161.83 | -65.9% |
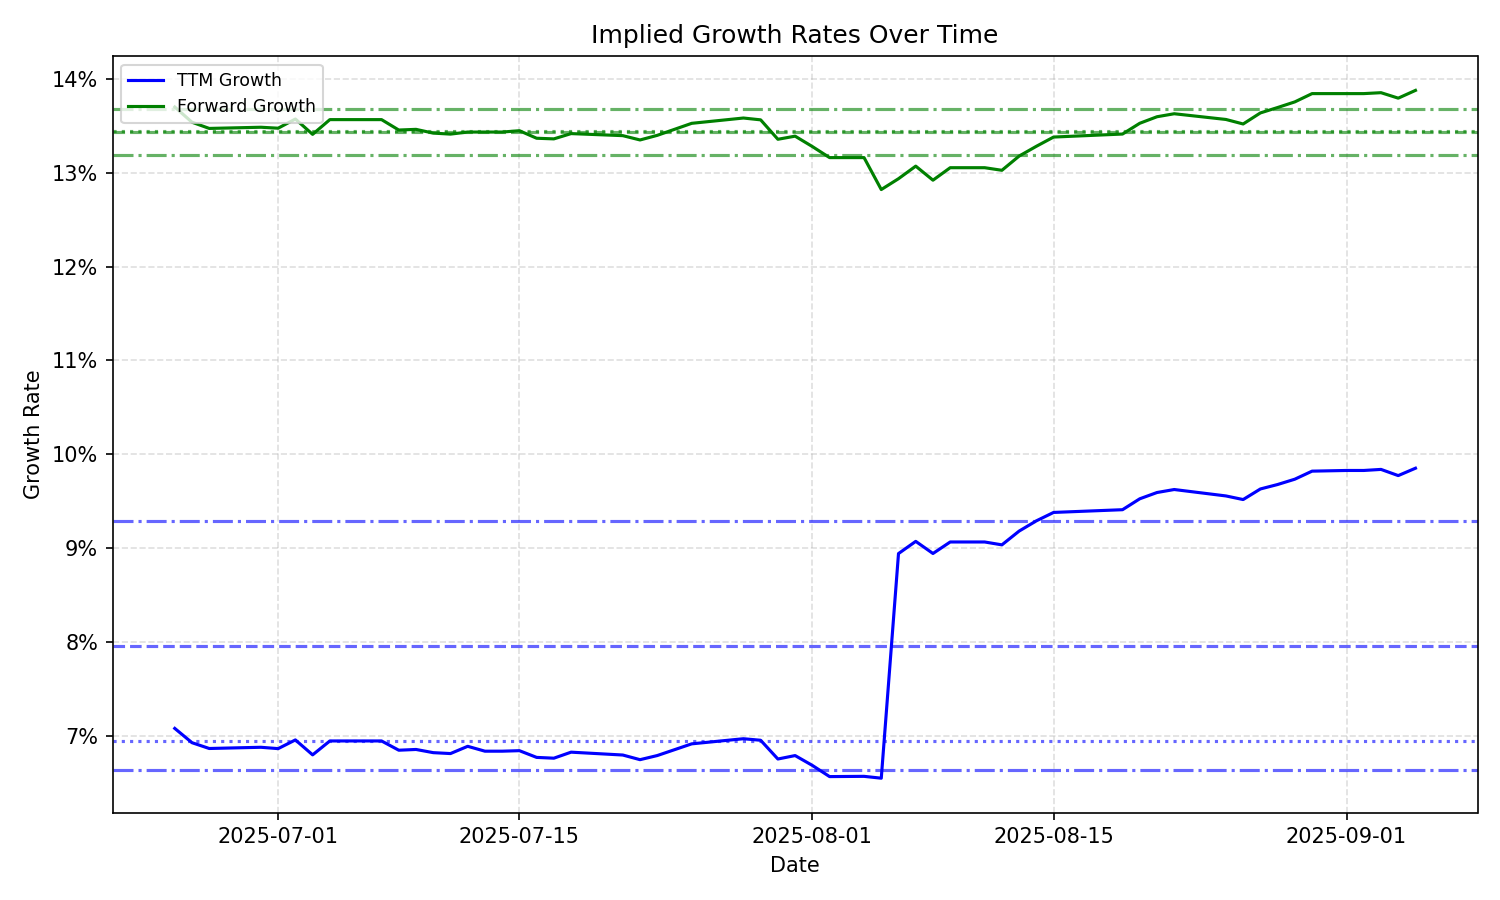
Implied Growth
| Average | Median | Std Dev | Current | Percentile | ||||||
|---|---|---|---|---|---|---|---|---|---|---|
| TTM | Forward | TTM | Forward | TTM | Forward | TTM | Forward | TTM | Forward | |
| Timeframe | ||||||||||
| 1 Year | 8.69% | 12.93% | 8.92% | 13.17% | 0.86% | 0.77% | 8.03% | 12.86% | 16.2% | 38.7% |
| 3 Years | 8.69% | 12.93% | 8.92% | 13.17% | 0.86% | 0.77% | 8.03% | 12.86% | 16.2% | 38.7% |
| 5 Years | 8.69% | 12.93% | 8.92% | 13.17% | 0.86% | 0.77% | 8.03% | 12.86% | 16.2% | 38.7% |
| 10 Years | 8.69% | 12.93% | 8.92% | 13.17% | 0.86% | 0.77% | 8.03% | 12.86% | 16.2% | 38.7% |