Allbirds, Inc. — BIRD
| Close Price | Market Cap | P/E Ratio | Forward P/E Ratio | Implied Growth* | Implied Forward Growth* | Dividend | P/B Ratio |
|---|---|---|---|---|---|---|---|
| $4.12 | $36.28M | - | -0.6 | N/A | - | - | 2.2 |
Latest Headlines
- · From biotech to orbit: Rocket One's AI and space rebrand sends shares flying
- · The quiet death of conscious consumerism, from Everlane and Allbirds to Beyond Meat
- · What Everlane’s Sale to Shein Means for Sustainable Fashion
- · Not the Allbirds effect: Japan’s top bidet maker Toto has been quietly making chip supplies for decades, and the stock market finally noticed
- · Companies are hyping AI the same way they talked up sustainability, but there are ways to fix that
- · Bernstein Says Snap Inc. (SNAP) Faces a Complex AI Turning Point
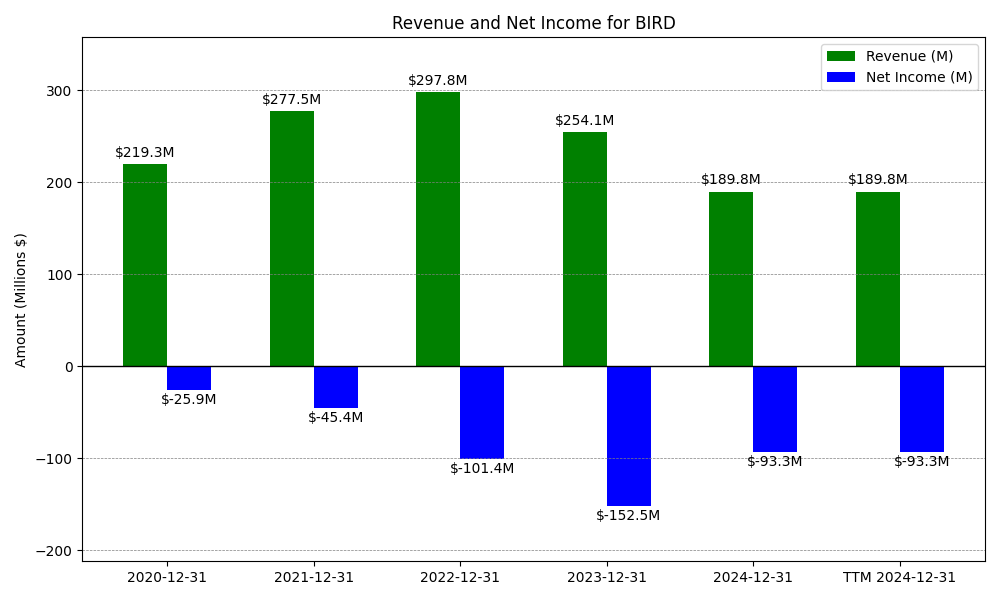
Revenue & Net Income
| Date | Revenue | Net_Income | EPS | Last_Updated | Revenue_Change | Net_Income_Change | EPS_Change | |
|---|---|---|---|---|---|---|---|---|
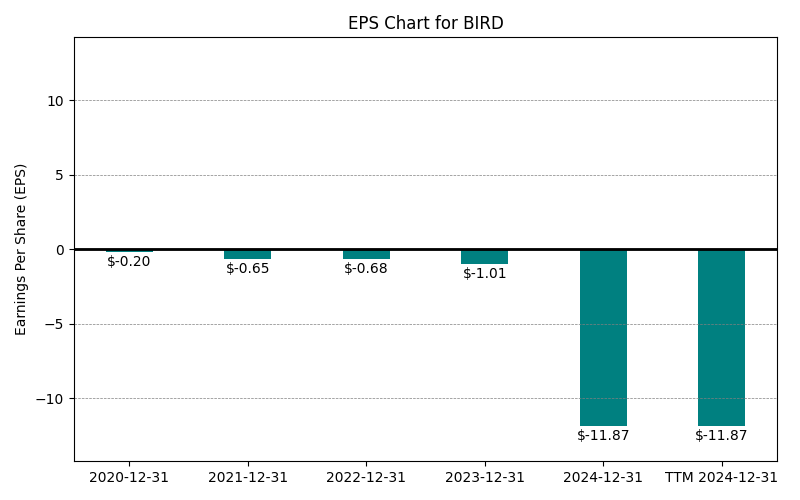
| 0 | 2020-12-31 | $219M | $-26M | $-0.20 | 2024-02-03 03:17:10 | N/A | N/A | N/A |
| 1 | 2021-12-31 | $277M | $-45M | $-13.00 | 2026-04-01 08:56:06 | 26.5% | 75.4% | 6284.0% |
| 2 | 2022-12-31 | $298M | $-101M | $-13.60 | 2026-05-29 09:05:36 | 7.3% | 123.4% | 4.6% |
| 3 | 2023-12-31 | $254M | $-152M | $-20.20 | 2026-05-29 09:05:36 | -14.7% | 50.4% | 48.5% |
| 4 | 2024-12-31 | $190M | $-93M | $-11.87 | 2026-05-29 09:05:36 | -25.3% | -38.8% | -41.2% |
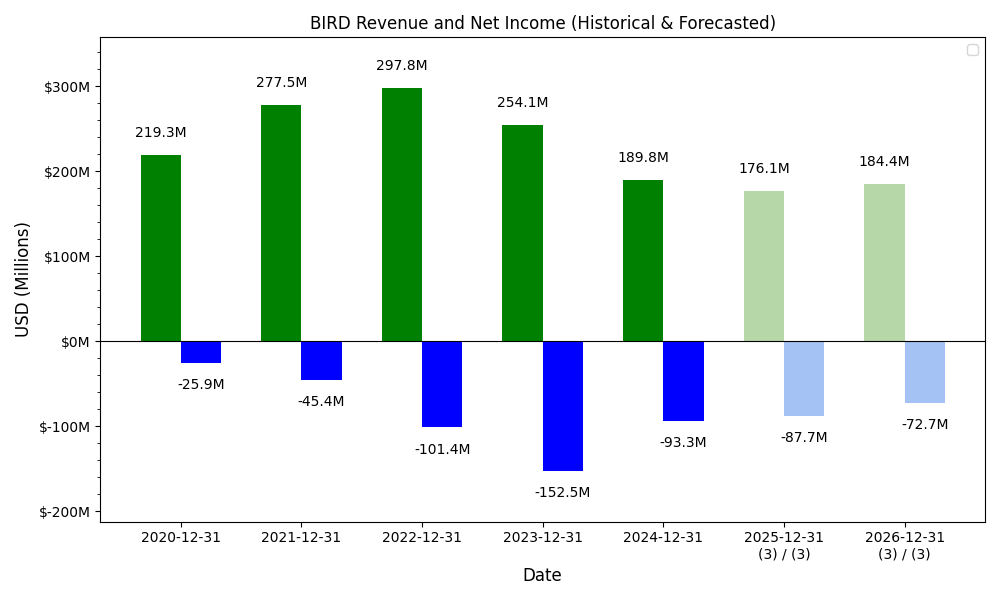
| 5 | 2025-12-31 | $152M | $-77M | $-9.47 | 2026-05-29 09:05:36 | -19.7% | -17.2% | -20.2% |
| 6 | TTM 2026-03-31 | $143M | $-76M | $-9.11 | 2026-05-21 09:04:37 | -6.4% | -1.5% | -3.8% |
EPS
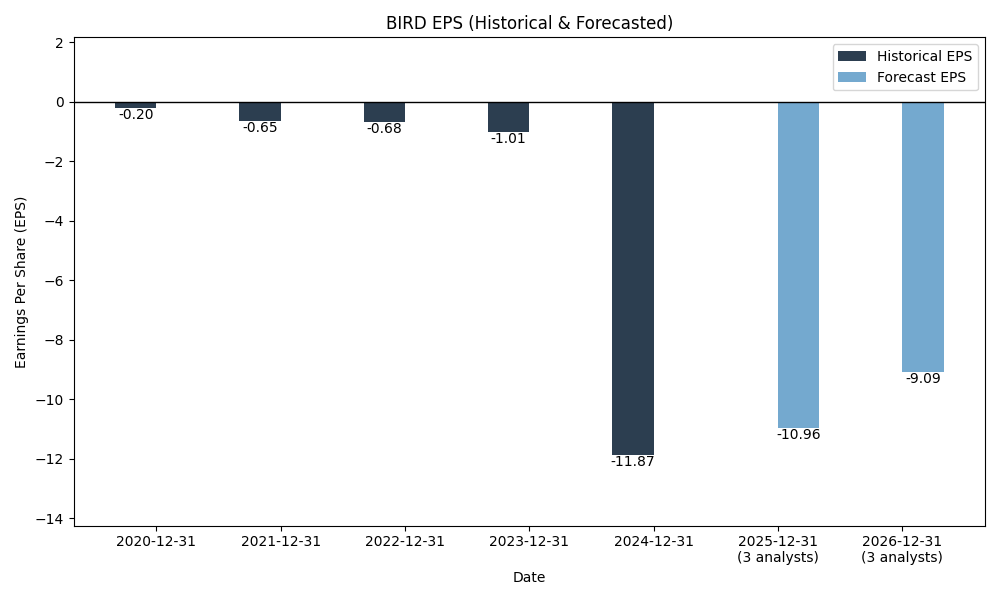
Forecasts
Y/Y % Change
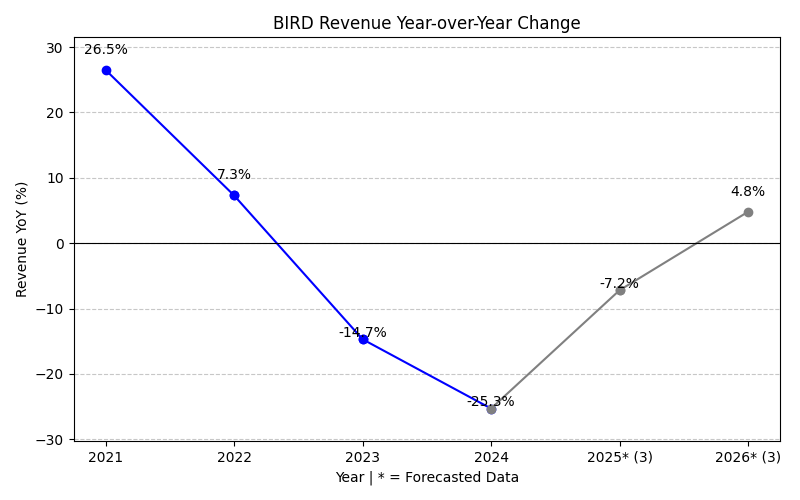
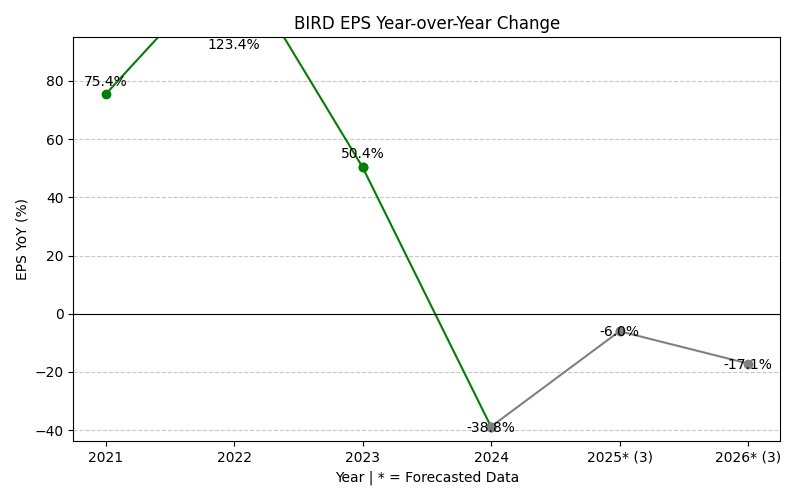
BIRD Year-over-Year Growth
| 2020 | 2021 | 2022 | 2023 | 2024 | 2025 | 2026 | 2027 | Average | |
|---|---|---|---|---|---|---|---|---|---|
| Revenue Growth (%) | 26.5% | 7.3% | -14.7% | -25.3% | -19.7% | -18.0% | -100.0% | -20.6% | |
| Revenue Analysts (#) | 0 | 0 | 0 | 0 | 0 | 0 | 1 | 0 | |
| EPS Growth (%) | 75.4% | 123.4% | 50.4% | -38.8% | -17.2% | -39.5% | -100.0% | 7.7% | |
| EPS Analysts (#) | 0 | 0 | 0 | 0 | 0 | 0 | 1 | 0 |
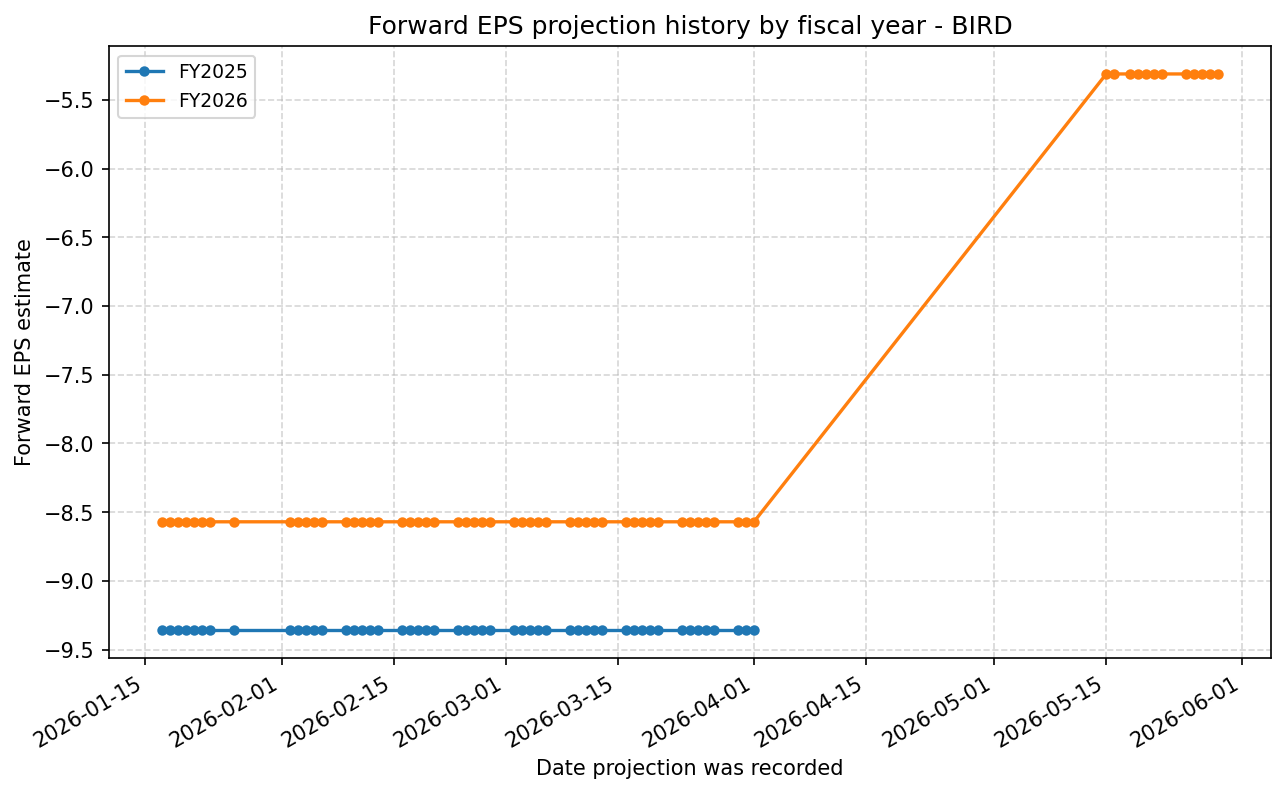
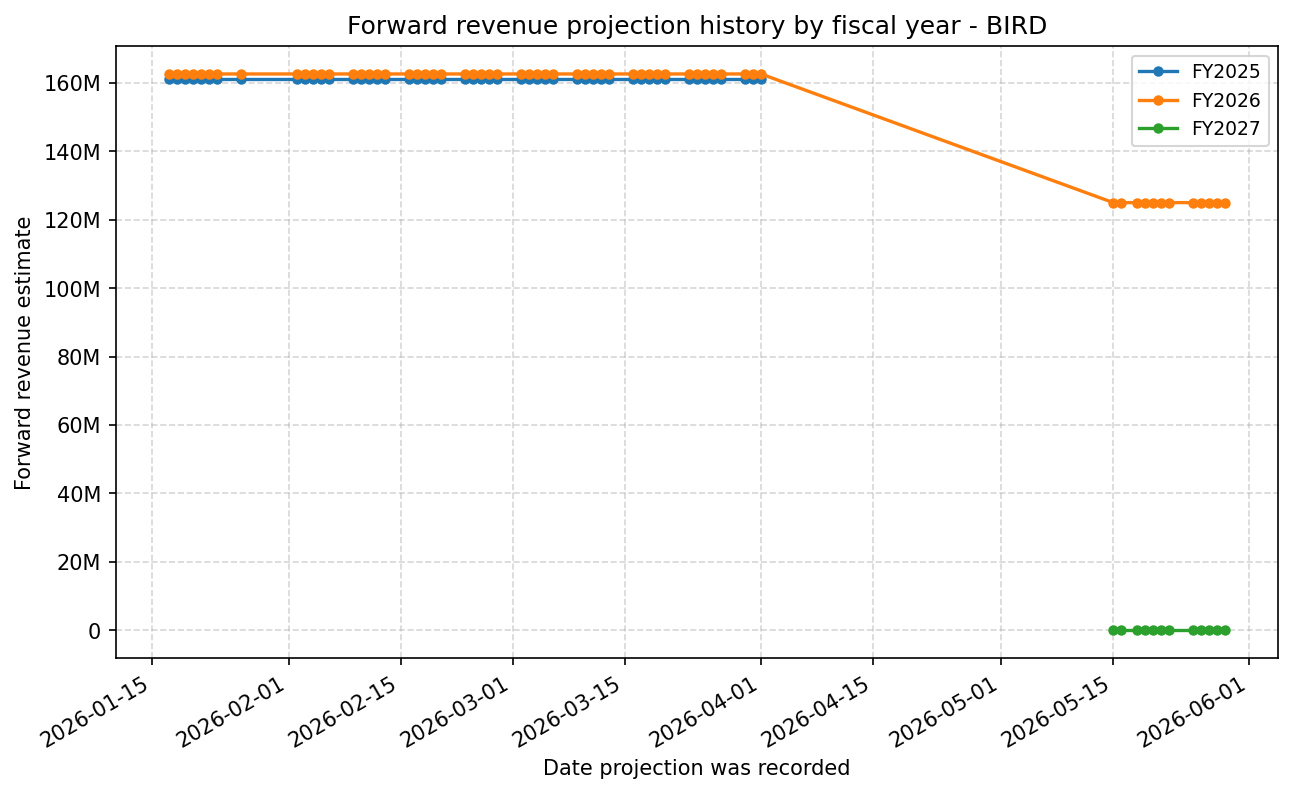
Forward Estimate History
How the next-FY EPS and revenue estimates have drifted over time. One line per fiscal year – past lines end when that FY became current.
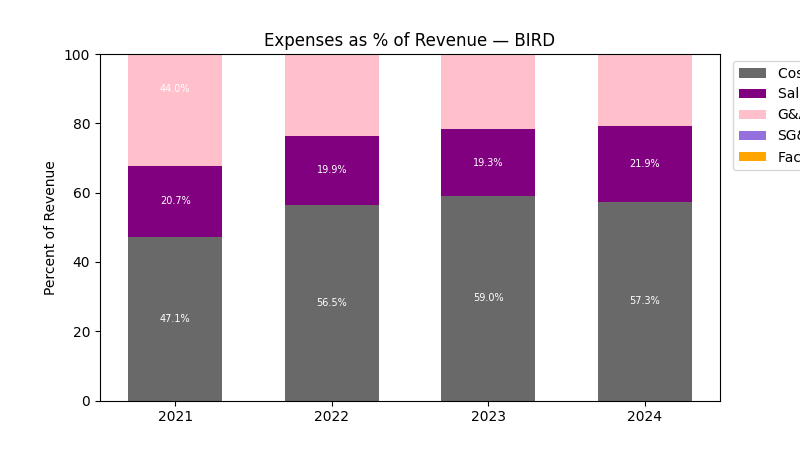
Expenses
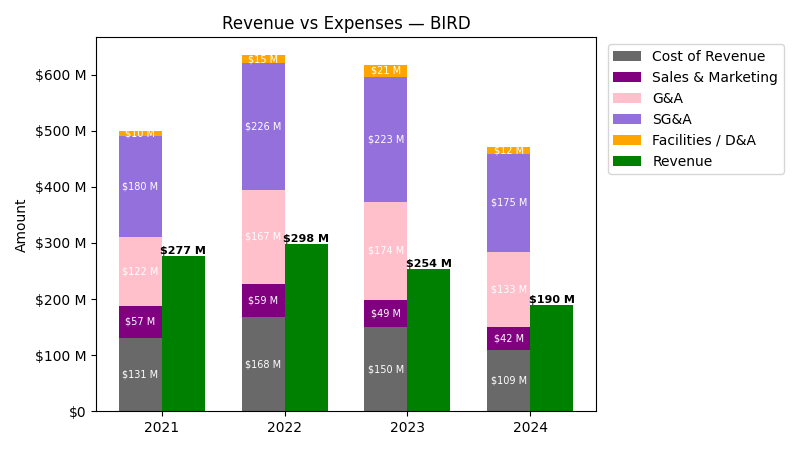
| Year | Revenue ($) | Cost of Revenue ($) | Sales & Marketing ($) | G&A ($) | SG&A ($) | Facilities / D&A ($) |
|---|---|---|---|---|---|---|
| 2022 | $297.8M | $153.5M | $59.1M | $166.7M | $225.8M | $14.7M |
| 2023 | $254.1M | $128.8M | $49.0M | $174.0M | $223.1M | $21.0M |
| 2024 | $189.8M | $96.3M | $41.6M | $133.4M | $175.0M | $12.4M |
| 2025 | $152.5M | $81.9M | $45.2M | $92.5M | $137.7M | $8.0M |
| TTM | $142.7M | $80.8M | $40.3M | $86.1M | $126.4M | $7.5M |
| Year | Revenue Change (%) | Cost of Revenue Change (%) | Sales & Marketing Change (%) | G&A Change (%) | SG&A Change (%) | Facilities / D&A Change (%) |
|---|---|---|---|---|---|---|
| 2023 | -14.68 | -16.05 | -17.03 | 4.38 | -1.22 | 43.10 |
| 2024 | -25.31 | -25.25 | -15.10 | -23.36 | -21.55 | -40.99 |
| 2025 | -19.65 | -14.95 | 8.65 | -30.66 | -21.31 | -35.31 |
| TTM | -6.42 | -1.31 | -10.81 | -6.94 | -8.21 | -6.56 |
No unmapped expenses.
Balance Sheet
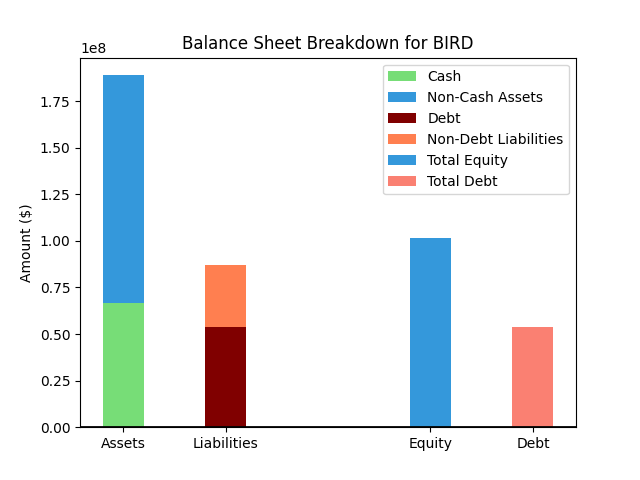
| Metric | Value | |
|---|---|---|
| 0 | Total Assets | $85M |
| 1 | Cash | $14M |
| 2 | Total Liabilities | $68M |
| 3 | Total Debt | $33M |
| 4 | Total Equity | $16M |
| 5 | Debt to Equity Ratio | 2.04 |
EPS & Dividend

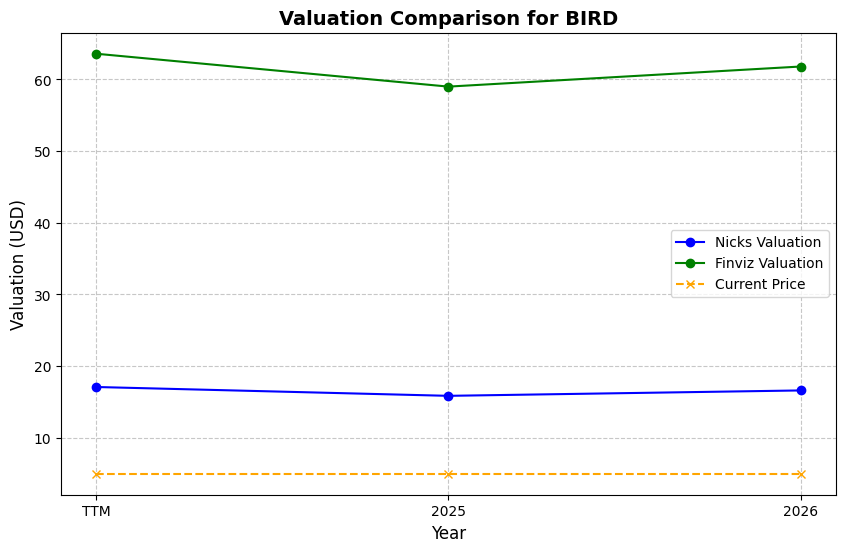
Valuation
| Share Price | Treasury Yield | Estimates | Fair Value (P/E) | Fair Value (P/S) | Current P/S | Current P/E |
|---|---|---|---|---|---|---|
| $4.12 | 4.5% | Nicks Growth: 8% Nick's Expected Margin: 5% FINVIZ Growth: 27% |
Nicks: 14 Finviz: 77 |
Nick's: 0.709 | 0.3 | - |
| Basis | Year | Nicks Valuation | Nicks vs Share Price | Finviz Valuation | Finviz vs Share Price |
|---|---|---|---|---|---|
| $16.20 Revenue | TTM | $11.48 | 178.6% | $62.08 | 1406.9% |
| $14.19 Revenue | 2026 | $10.06 | 144.1% | $54.39 | 1220.2% |
| $0.00 Revenue | 2027 | $0.00 | -100.0% | $0.00 | -100.0% |
Implied Growth

No implied growth data available.