Boeing Company (The) — BA
| Close Price | Market Cap | P/E Ratio | Forward P/E Ratio | Implied Growth* | Implied Forward Growth* | Dividend | P/B Ratio |
|---|---|---|---|---|---|---|---|
| $231.15 | $182.22B | 91.0 | 55.3 | 29.2% | 23.1% | - | 30.5 |
Latest Headlines
- · 3 Aerospace Stocks Ready to Ride the Aftermarket Rebound
- · Tema ETFs launches $NASA, the first pure-play space fund with SpaceX exposure
- · Park Aerospace Corp (PKE) Q4 2026 Earnings Call Highlights: Strong Partnerships and Financial ...
- · Boeing’s SkyGrid Moves Into U Space And Advanced Air Mobility
- · Think Together Awarded $125,000 Grant from Boeing to Expand STEM and Workforce Readiness Programs in Afterschool and Expanded Learning Programs
- · 9 ‘Hidden’ Space Stocks Haven’t Joined SpaceX IPO Bubble Yet
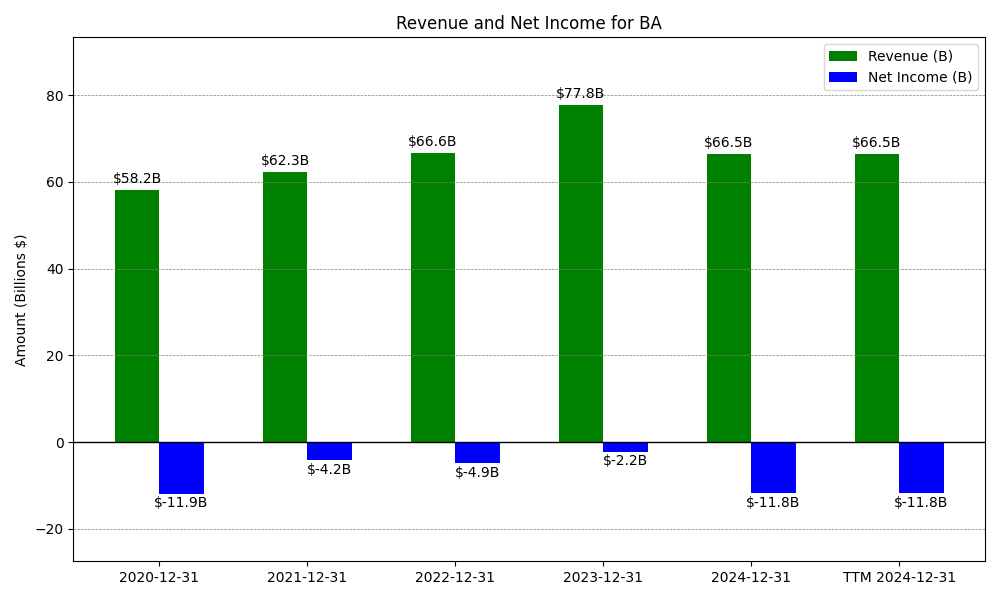
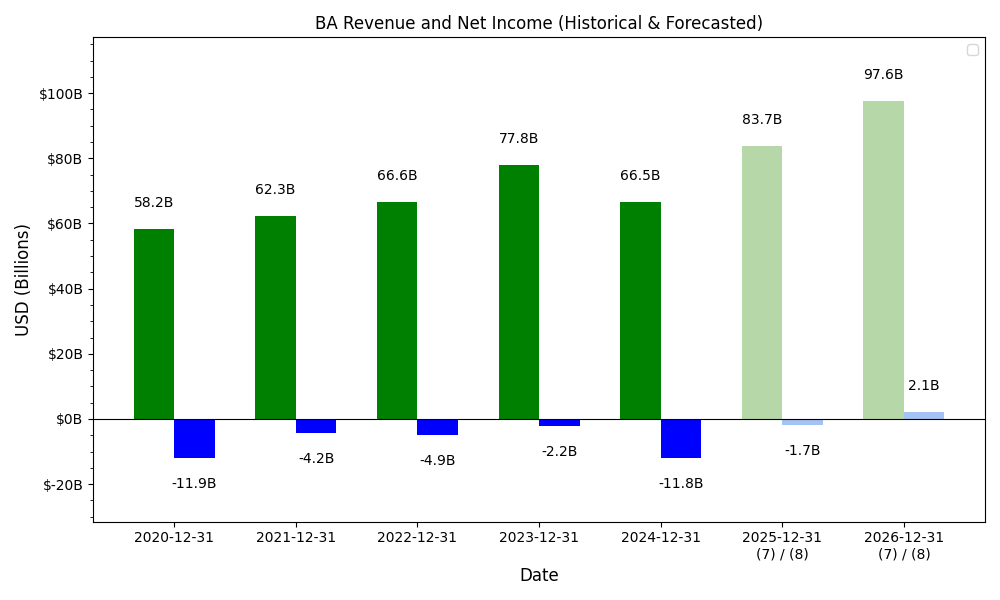
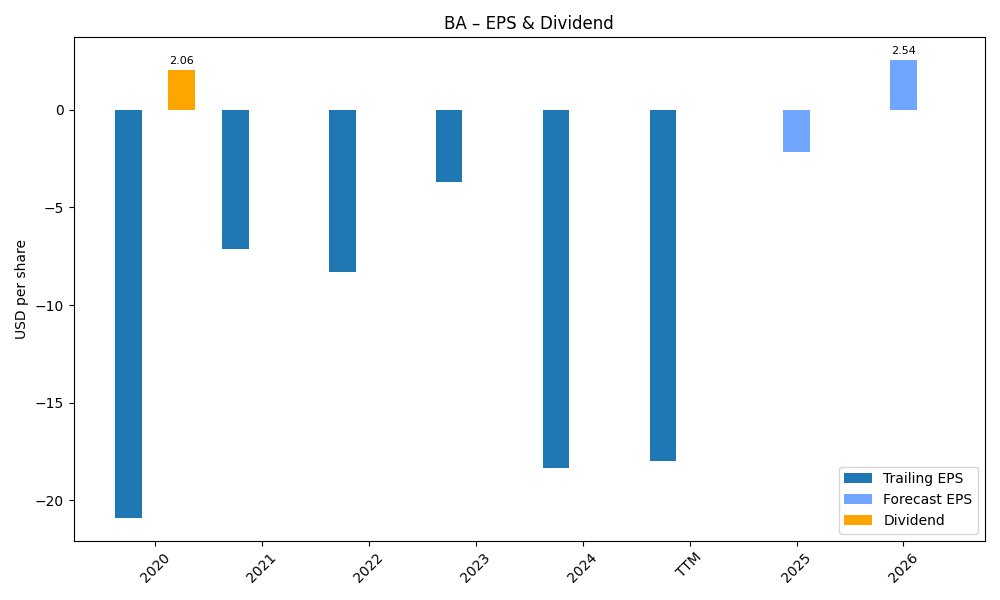
Revenue & Net Income
| Date | Revenue | Net_Income | EPS | Last_Updated | Revenue_Change | Net_Income_Change | EPS_Change | |
|---|---|---|---|---|---|---|---|---|
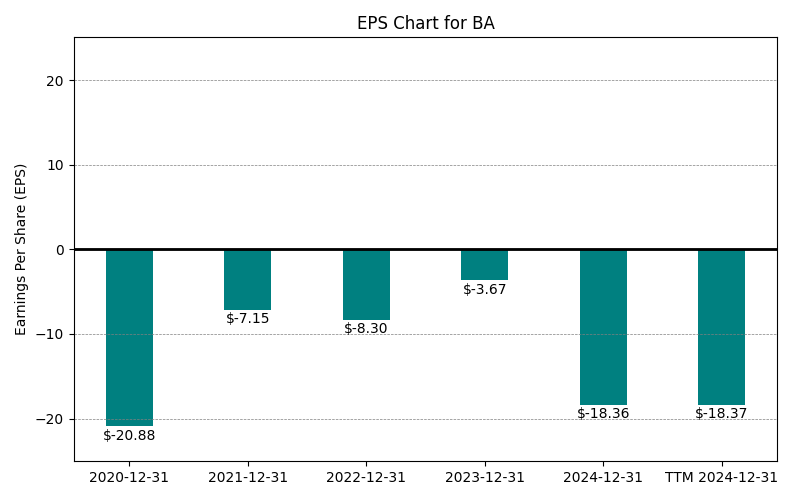
| 0 | 2020-12-31 | $58,158M | $-11,941M | $-20.88 | 2024-02-03 03:17:10 | N/A | N/A | N/A |
| 1 | 2021-12-31 | $62,286M | $-4,202M | $-7.15 | 2024-02-03 03:17:10 | 7.1% | -64.8% | -65.8% |
| 2 | 2022-12-31 | $66,608M | $-4,935M | $-8.30 | 2026-05-29 09:05:02 | 6.9% | 17.4% | 16.1% |
| 3 | 2023-12-31 | $77,794M | $-2,222M | $-3.67 | 2026-05-29 09:05:02 | 16.8% | -55.0% | -55.8% |
| 4 | 2024-12-31 | $66,517M | $-11,817M | $-18.36 | 2026-05-29 09:05:02 | -14.5% | 431.8% | 400.3% |
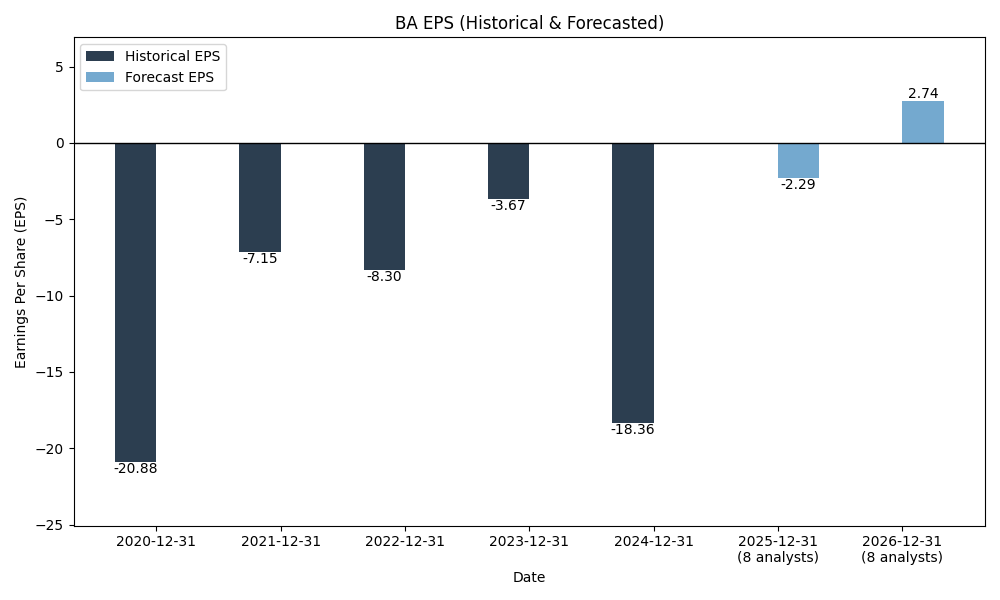
| 5 | 2025-12-31 | $89,463M | $2,235M | $2.49 | 2026-05-29 09:05:02 | 34.5% | -118.9% | -113.6% |
| 6 | TTM 2026-03-31 | $92,184M | $2,268M | $2.54 | 2026-04-24 08:39:50 | 3.0% | 1.5% | 2.0% |
EPS
Forecasts
Y/Y % Change
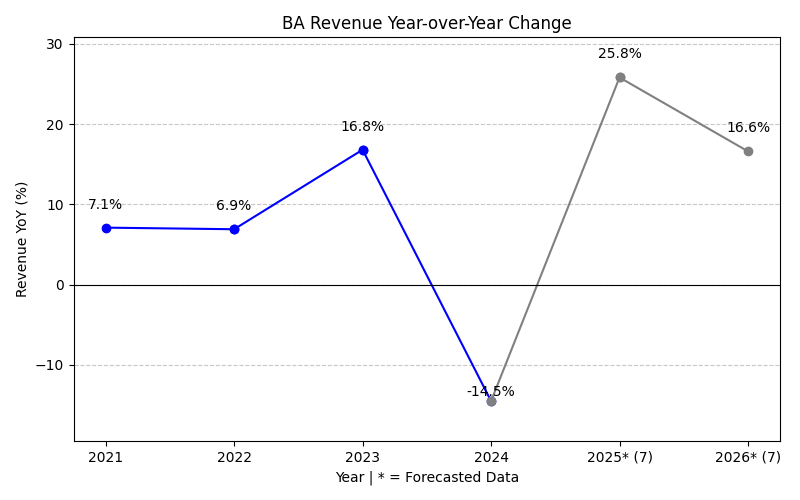
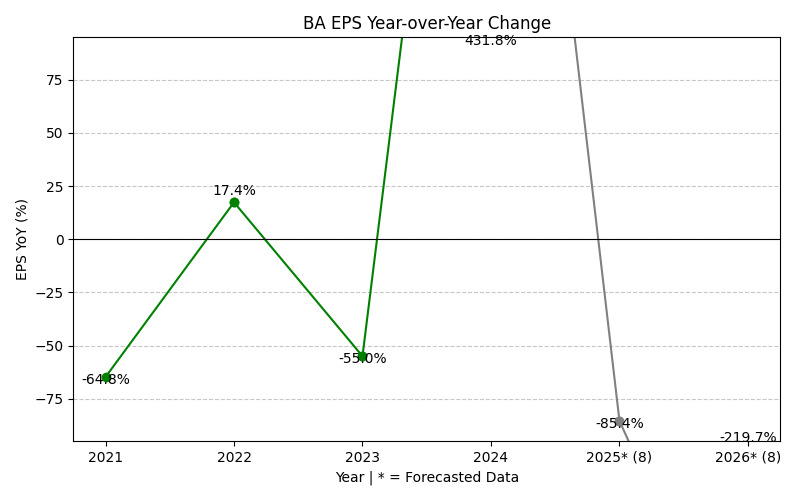
BA Year-over-Year Growth
| 2020 | 2021 | 2022 | 2023 | 2024 | 2025 | 2026 | 2027 | Average | |
|---|---|---|---|---|---|---|---|---|---|
| Revenue Growth (%) | 7.1% | 6.9% | 16.8% | -14.5% | 34.5% | 9.1% | 15.0% | 10.7% | |
| Revenue Analysts (#) | 0 | 0 | 0 | 0 | 0 | 0 | 25 | 25 | |
| EPS Growth (%) | -64.8% | 17.4% | -55.0% | 431.8% | -118.9% | -113.8% | -1166.6% | -152.8% | |
| EPS Analysts (#) | 0 | 0 | 0 | 0 | 0 | 0 | 22 | 22 |
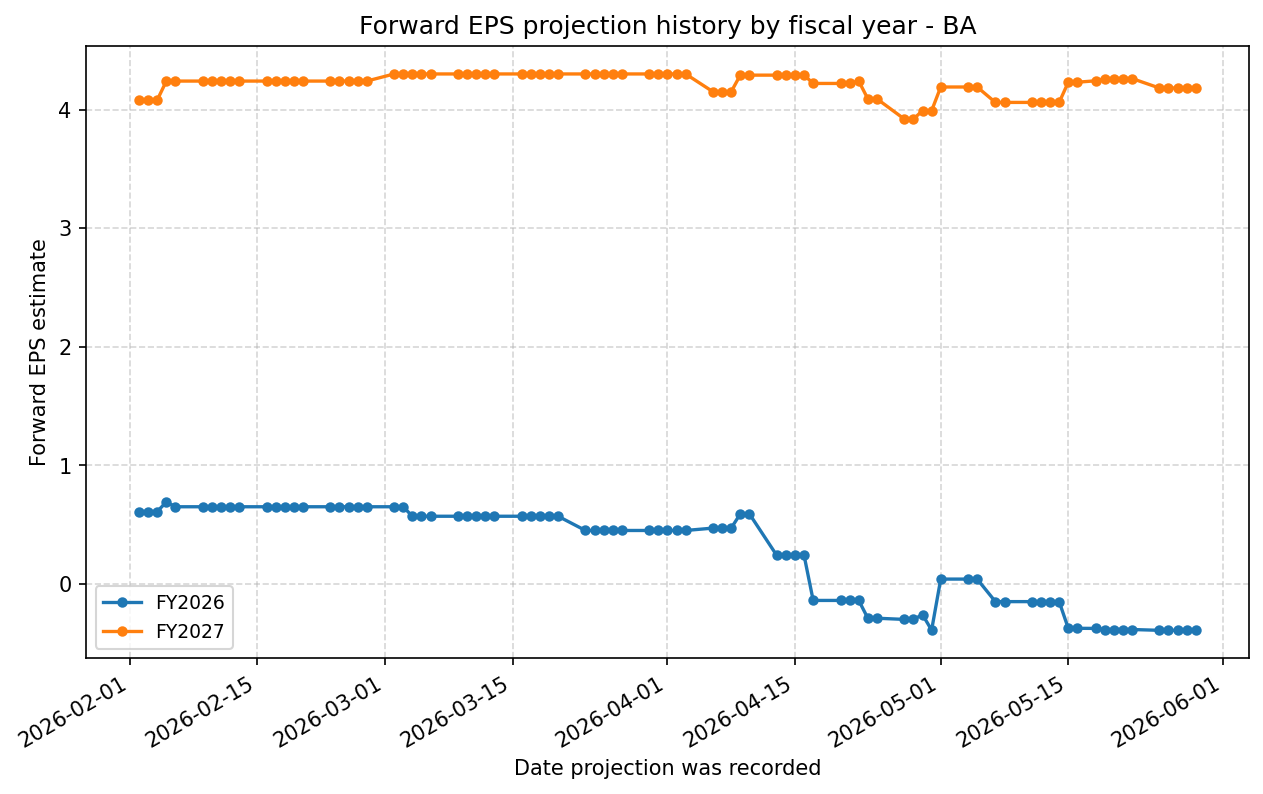
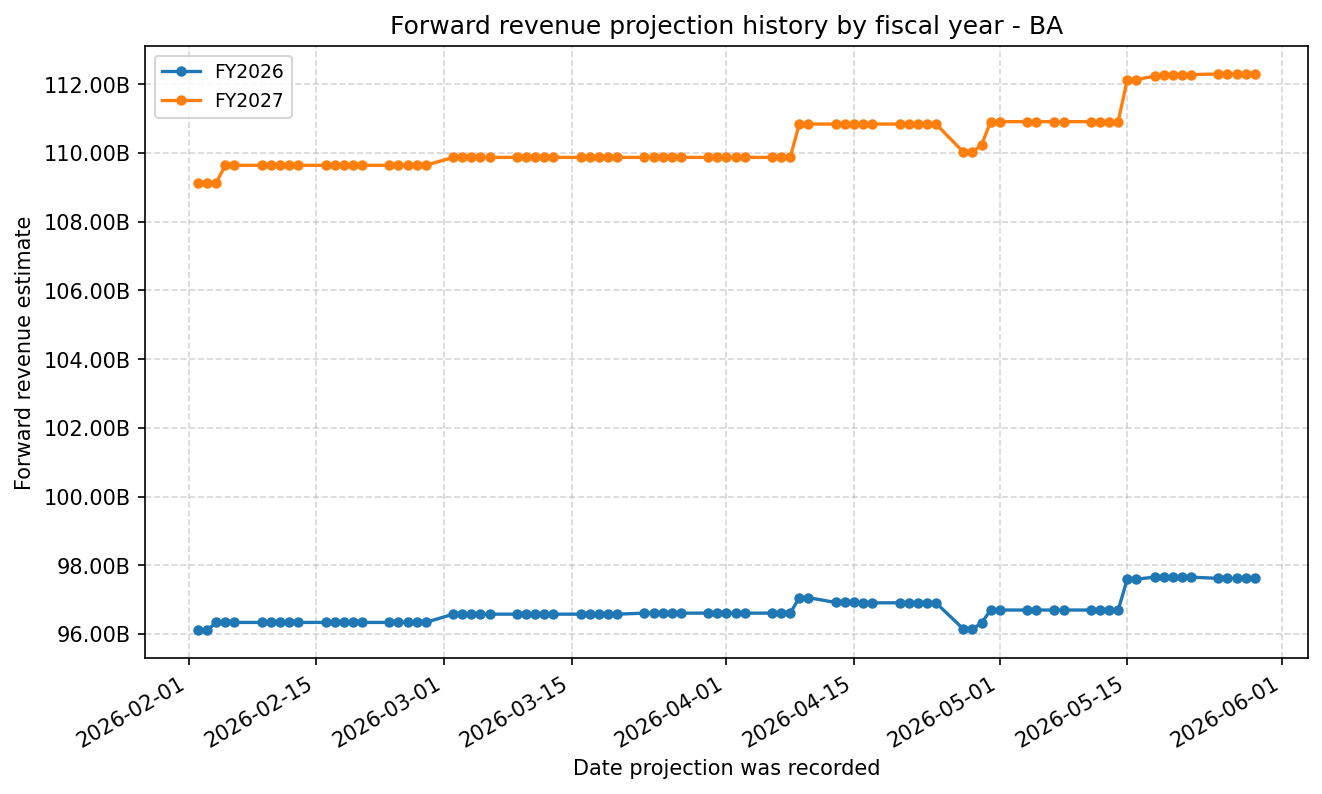
Forward Estimate History
How the next-FY EPS and revenue estimates have drifted over time. One line per fiscal year – past lines end when that FY became current.
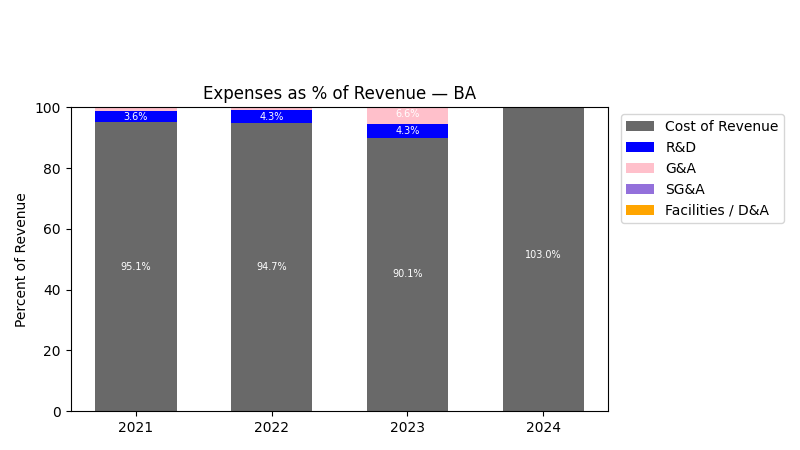
Expenses
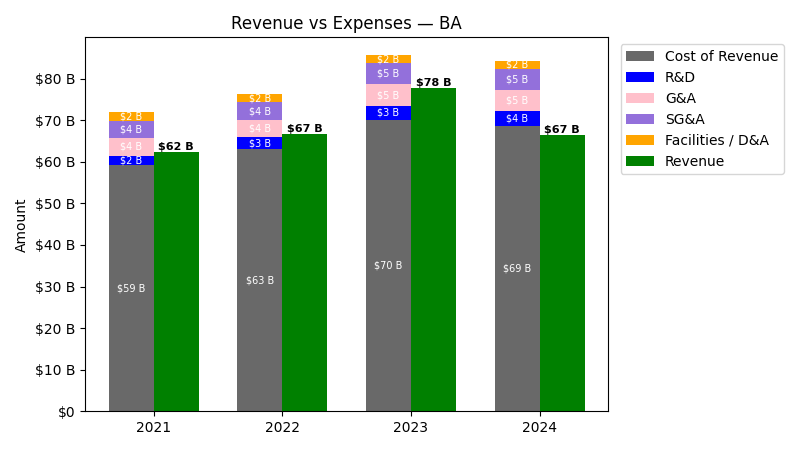
| Year | Revenue ($) | Cost of Revenue ($) | R&D ($) | G&A ($) | SG&A ($) | Facilities / D&A ($) |
|---|---|---|---|---|---|---|
| 2021 | $62.3B | $57.1B | $2.2B | $4.2B | $4.2B | $2.1B |
| 2022 | $66.6B | $61.1B | $2.9B | $4.2B | $4.2B | $2.0B |
| 2023 | $77.8B | $68.2B | $3.4B | $5.2B | $5.2B | $1.9B |
| 2024 | $66.5B | $66.7B | $3.8B | $5.0B | $5.0B | $1.8B |
| 2025 | $89.5B | $83.2B | $3.6B | $6.1B | $6.1B | $2.0B |
| TTM | $92.2B | $85.7B | $3.7B | $6.2B | $6.2B | $2.1B |
| Year | Revenue Change (%) | Cost of Revenue Change (%) | R&D Change (%) | G&A Change (%) | SG&A Change (%) | Facilities / D&A Change (%) |
|---|---|---|---|---|---|---|
| 2022 | 6.94 | 7.02 | 26.81 | 0.72 | 0.72 | -7.70 |
| 2023 | 16.79 | 11.64 | 18.41 | 23.43 | 23.43 | -5.96 |
| 2024 | -14.50 | -2.25 | 12.88 | -2.84 | -2.84 | -1.34 |
| 2025 | 34.50 | 24.82 | -5.17 | 21.29 | 21.29 | 6.37 |
| TTM | 3.04 | 2.99 | 1.63 | 1.40 | 1.40 | 5.48 |
No unmapped expenses.
Segment Performance
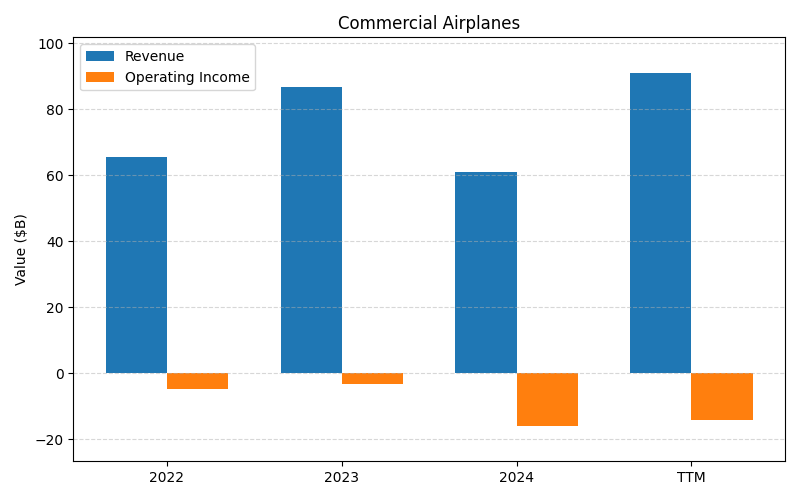
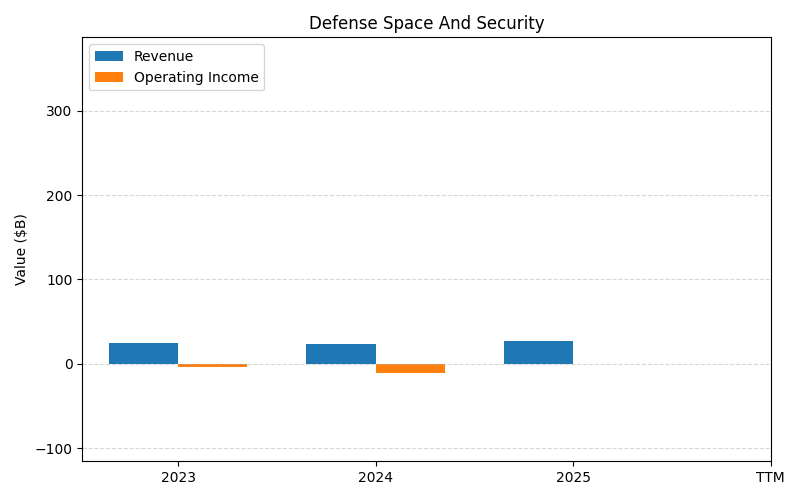
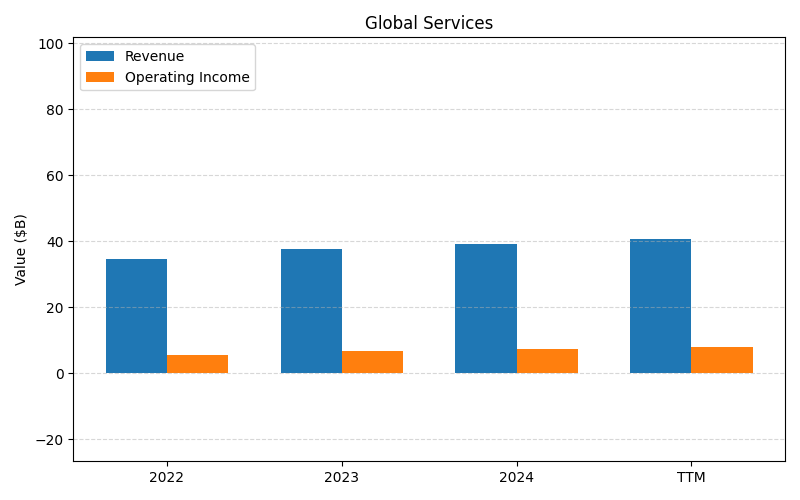
SEGMENTS v2025-09-09 · 2026-05-29 09:05 UTC — Units: $B. Rows list fiscal years (last 3 + TTM) with revenue and operating income for each segment; the final row shows the TTM revenue mix (operating income columns display “—” where mix is not applicable).
| Year | Commercial Airplanes Rev | Commercial Airplanes OI | Defense Space And Security Rev | Defense Space And Security OI | Global Services Rev | Global Services OI | Total Rev | Total OI |
|---|---|---|---|---|---|---|---|---|
| 2023 | 86.8B | -3.27B | 24.9B | -3.53B | 37.5B | 6.66B | 149.3B | -0.14B |
| 2024 | 60.9B | -15.9B | 23.9B | -10.8B | 39.1B | 7.24B | 123.9B | -19.5B |
| 2025 | 107.6B | -14.2B | 27.2B | -0.26B | 41B | 26.9B | 175.9B | 12.5B |
| TTM | 213.1B | -32.3B | – | – | – | – | 213.1B | -32.3B |
| % of Total (TTM) | 100.0% | — | – | — | – | — | 100% | — |
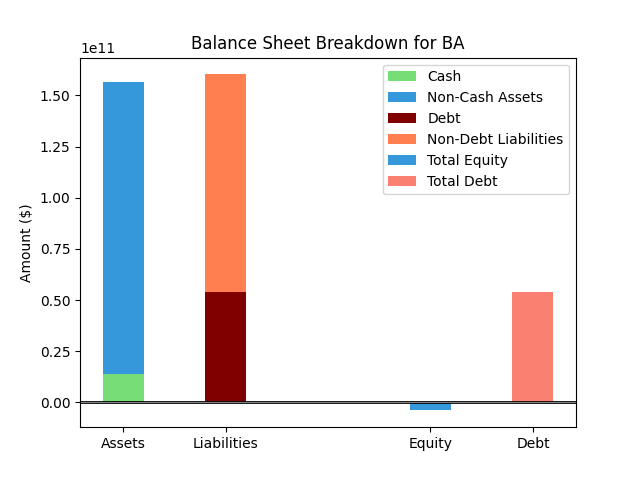
Balance Sheet
| Metric | Value | |
|---|---|---|
| 0 | Total Assets | $164,787M |
| 1 | Cash | $9,441M |
| 2 | Total Liabilities | $158,800M |
| 3 | Total Debt | $47,209M |
| 4 | Total Equity | $5,987M |
| 5 | Debt to Equity Ratio | 7.89 |
EPS & Dividend
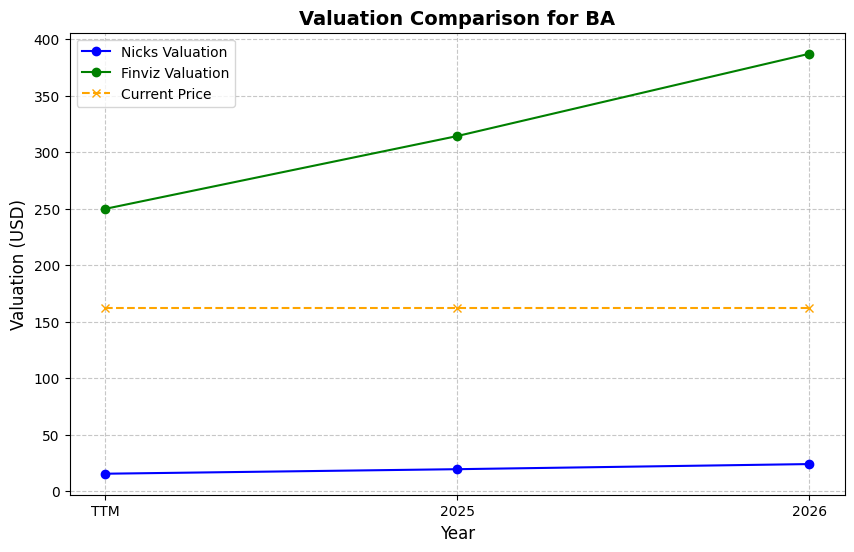
Valuation
| Share Price | Treasury Yield | Estimates | Fair Value (P/E) | Fair Value (P/S) | Current P/S | Current P/E |
|---|---|---|---|---|---|---|
| $231.15 | 4.5% | Nicks Growth: 3% Nick's Expected Margin: 2% FINVIZ Growth: 87% |
Nicks: 9 Finviz: 4202 |
Nick's: 0.173 | 2.0 | 91.0 |
| Basis | Year | Nicks Valuation | Nicks vs Share Price | Finviz Valuation | Finviz vs Share Price |
|---|---|---|---|---|---|
| $2.54 EPS | TTM | $21.94 | -90.5% | $10673.92 | 4517.7% |
| $123.84 Revenue | 2026 | $21.40 | -90.7% | $10408.17 | 4402.8% |
| $4.18 EPS | 2027 | $36.12 | -84.4% | $17571.75 | 7501.9% |
Implied Growth
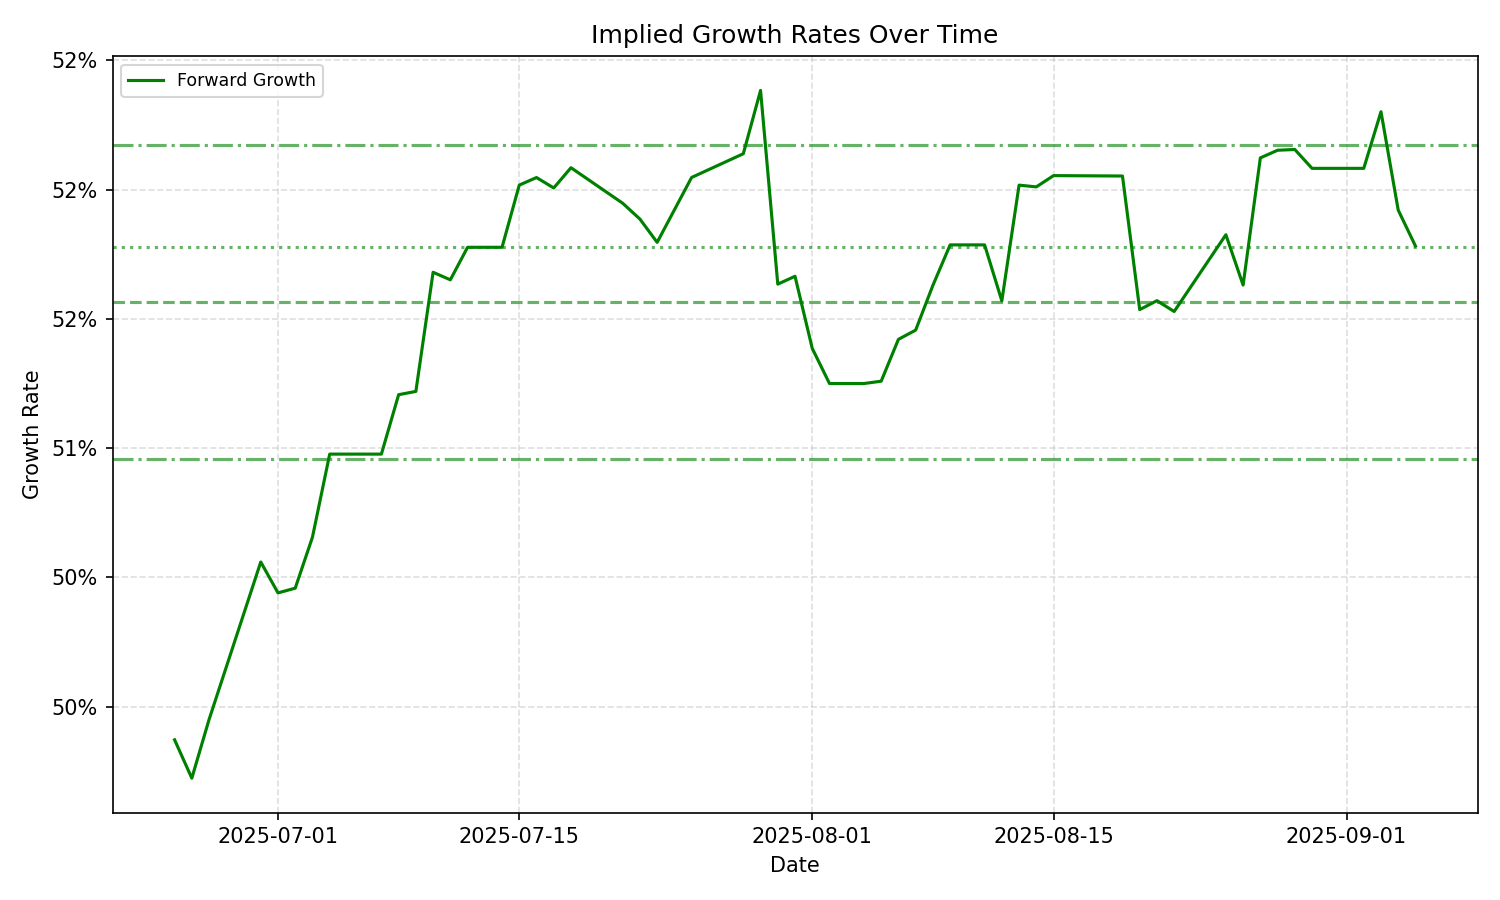
| Average | Median | Std Dev | Current | Percentile | ||||||
|---|---|---|---|---|---|---|---|---|---|---|
| TTM | Forward | TTM | Forward | TTM | Forward | TTM | Forward | TTM | Forward | |
| Timeframe | ||||||||||
| 1 Year | 28.72% | 38.68% | 28.84% | 49.24% | 0.69% | 13.95% | 29.04% | 22.98% | 66.7% | 33.0% |
| 3 Years | 28.72% | 38.68% | 28.84% | 49.24% | 0.69% | 13.95% | 29.04% | 22.98% | 66.7% | 33.0% |
| 5 Years | 28.72% | 38.68% | 28.84% | 49.24% | 0.69% | 13.95% | 29.04% | 22.98% | 66.7% | 33.0% |
| 10 Years | 28.72% | 38.68% | 28.84% | 49.24% | 0.69% | 13.95% | 29.04% | 22.98% | 66.7% | 33.0% |