Booz Allen Hamilton Holding Cor — BAH
| Close Price | Market Cap | P/E Ratio | Forward P/E Ratio | Implied Growth* | Implied Forward Growth* | Dividend | P/B Ratio |
|---|---|---|---|---|---|---|---|
| $79.18 | $9.48B | 11.5 | 11.5 | 5.8% | 5.9% | $2.36 3.0% | 8.6 |
Latest Headlines
- · Intel downgraded, Marvell upgraded: Wall Street's top analyst calls
- · Company News for May 26, 2026
- · Here Are Tuesday’s Top Wall Street Analyst Research Calls: Albemarle, Booz Allen Hamilton, Cigna, DT Midstream, GE Vernova, Intel, Okta, Travelers, Occidental Petroleum, and More
- · Booz Allen Hamilton Q4 Earnings Call Flags Civil Pressure, FY27 Reset
- · Booz Allen's Q4 Earnings Surpass Estimates, Revenues Fall Short
- · Stocks making big moves this week: Toll Brothers, Booz Allen Hamilton, Strategy, Regeneron, and Micron
Revenue & Net Income
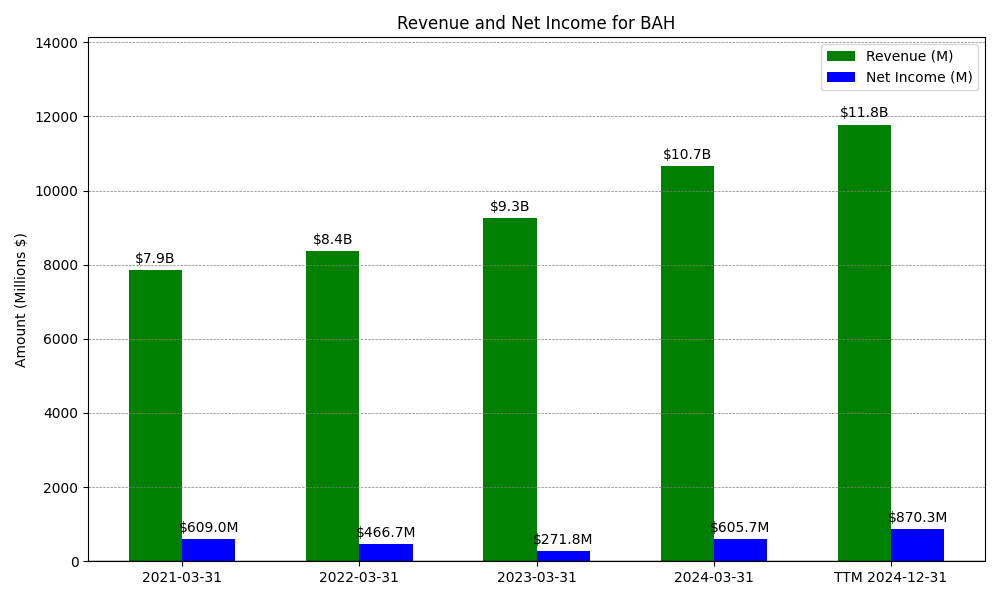
| Date | Revenue | Net_Income | EPS | Last_Updated | Revenue_Change | Net_Income_Change | EPS_Change | |
|---|---|---|---|---|---|---|---|---|
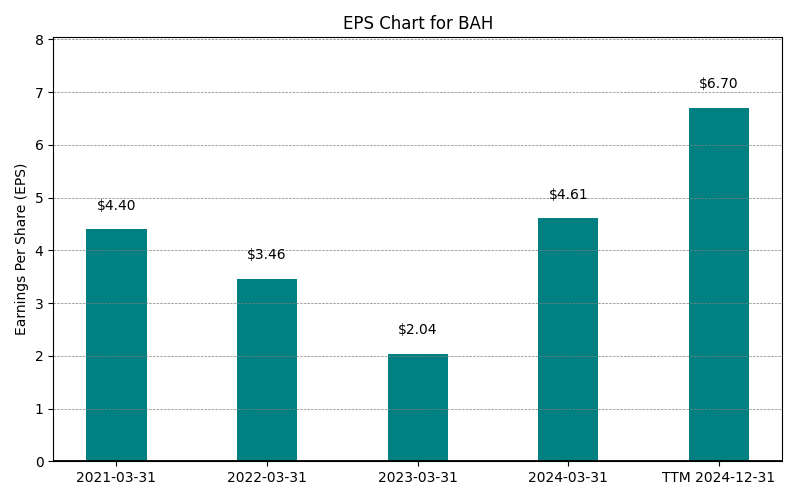
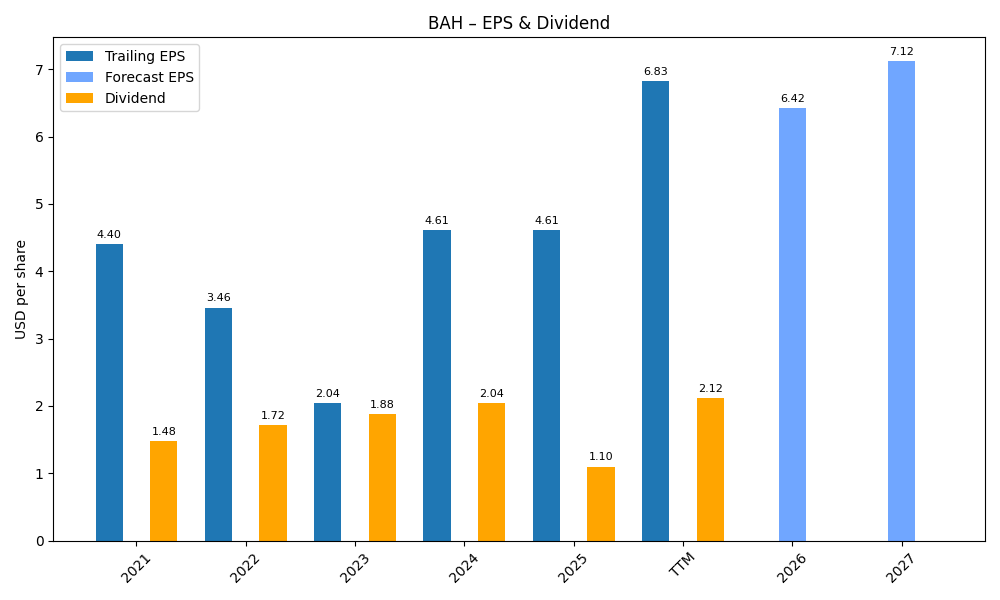
| 0 | 2021-03-31 | $7,859M | $609M | $4.40 | 2025-02-06 02:53:31 | N/A | N/A | N/A |
| 1 | 2022-03-31 | $8,364M | $467M | $3.46 | 2026-05-25 09:17:23 | 6.4% | -23.4% | -21.4% |
| 2 | 2023-03-31 | $9,259M | $271M | $2.04 | 2026-05-29 09:05:31 | 10.7% | -41.9% | -41.0% |
| 3 | 2024-03-31 | $10,662M | $606M | $4.61 | 2026-05-29 09:05:31 | 15.2% | 123.6% | 126.0% |
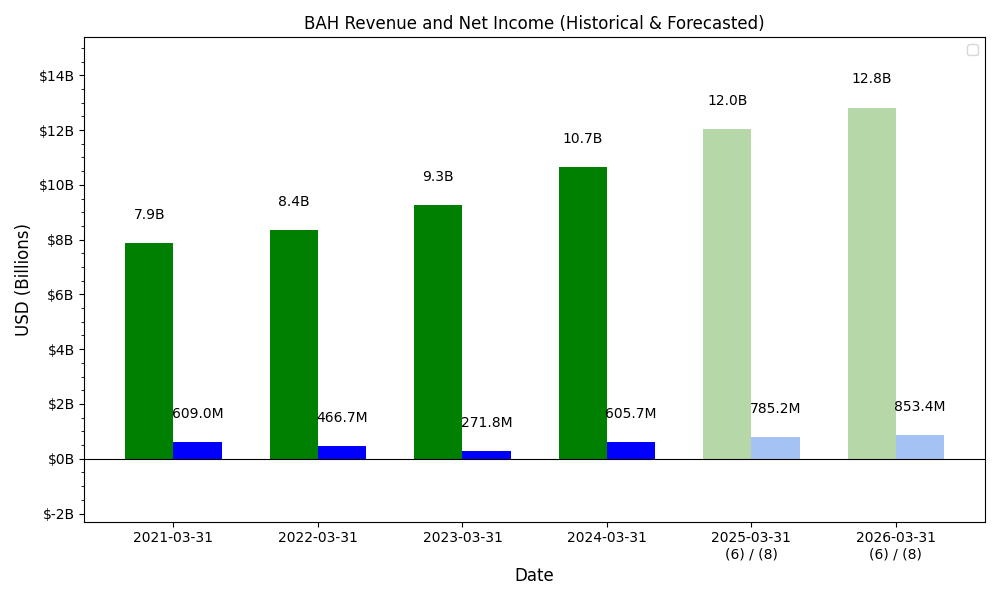
| 4 | 2025-03-31 | $11,980M | $935M | $7.28 | 2026-05-29 09:05:31 | 12.4% | 54.3% | 57.9% |
| 5 | 2026-03-31 | $11,217M | $851M | $6.92 | 2026-05-29 09:05:31 | -6.4% | -9.0% | -4.9% |
| 6 | TTM 2026-03-31 | $11,217M | $851M | $6.90 | 2026-05-26 09:05:31 | 0.0% | 0.0% | -0.3% |
EPS
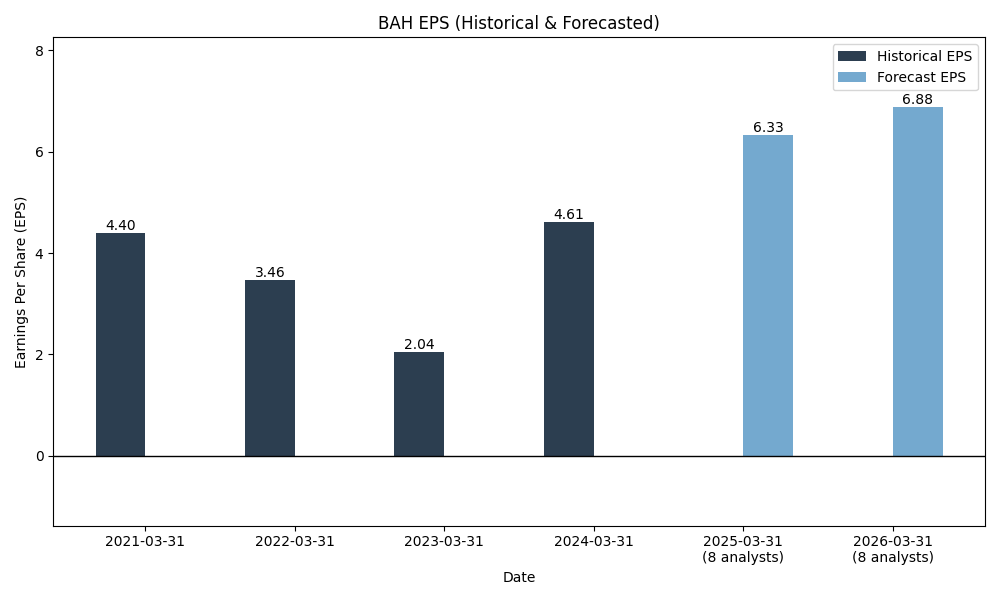
Forecasts
Y/Y % Change
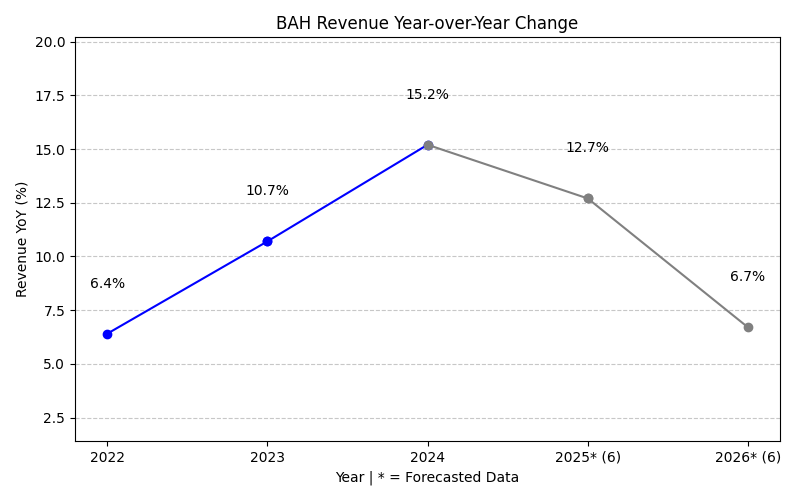
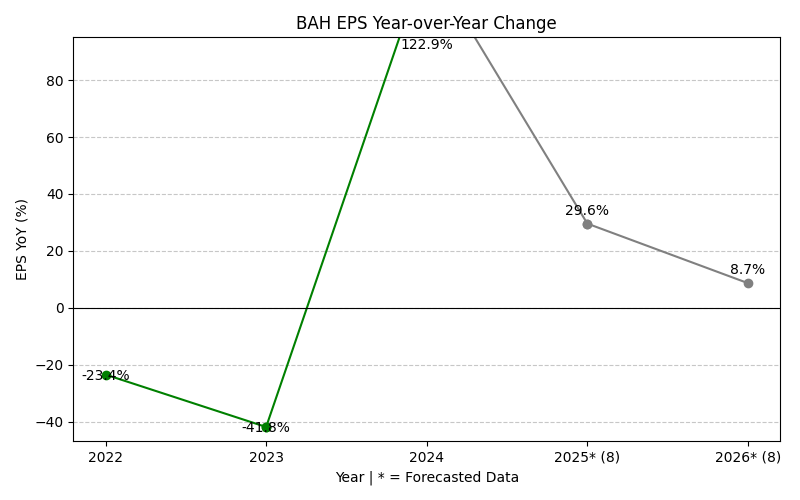
BAH Year-over-Year Growth
| 2021 | 2022 | 2023 | 2024 | 2025 | 2026 | 2027 | 2028 | Average | |
|---|---|---|---|---|---|---|---|---|---|
| Revenue Growth (%) | 6.4% | 10.7% | 15.2% | 12.4% | -6.4% | 1.7% | 4.8% | 6.4% | |
| Revenue Analysts (#) | 0 | 0 | 0 | 0 | 0 | 0 | 14 | 13 | |
| EPS Growth (%) | -23.4% | -41.9% | 123.6% | 54.3% | -9.0% | -11.9% | 9.6% | 14.5% | |
| EPS Analysts (#) | 0 | 0 | 0 | 0 | 0 | 0 | 14 | 13 |
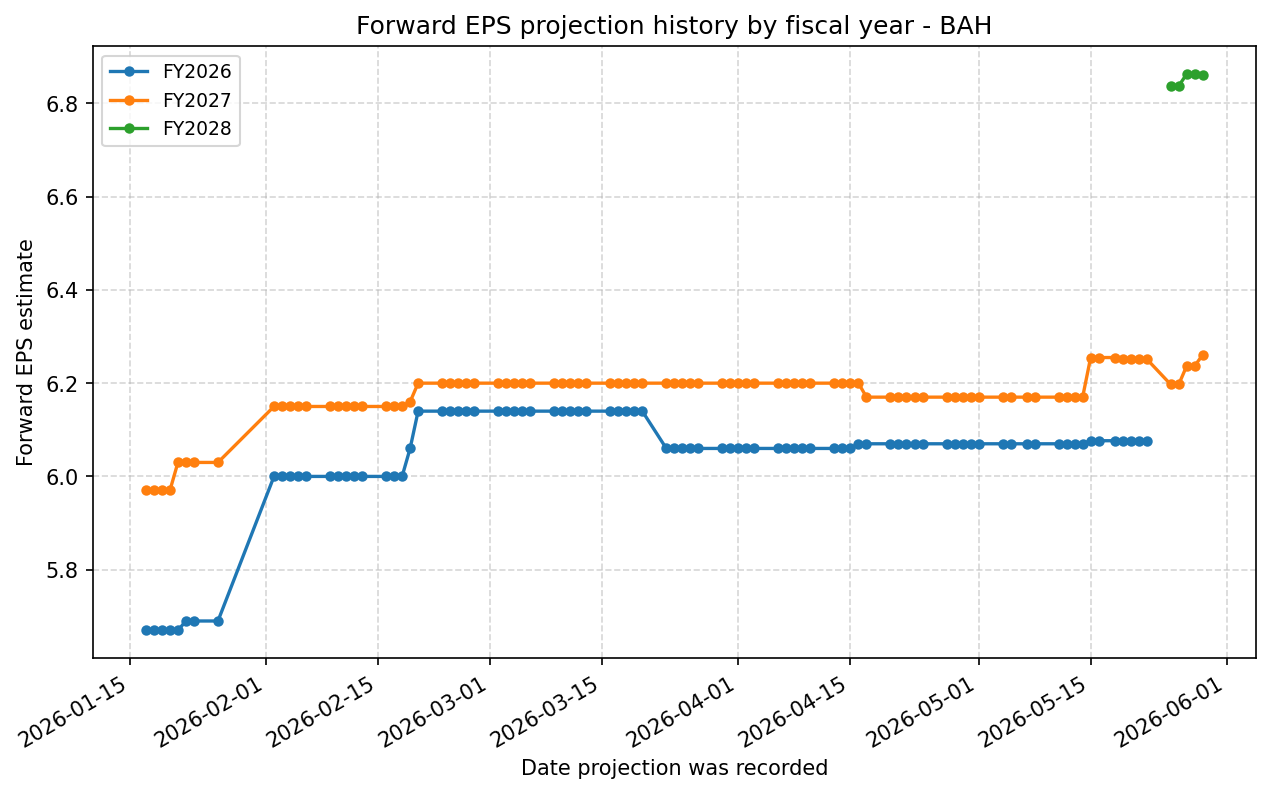
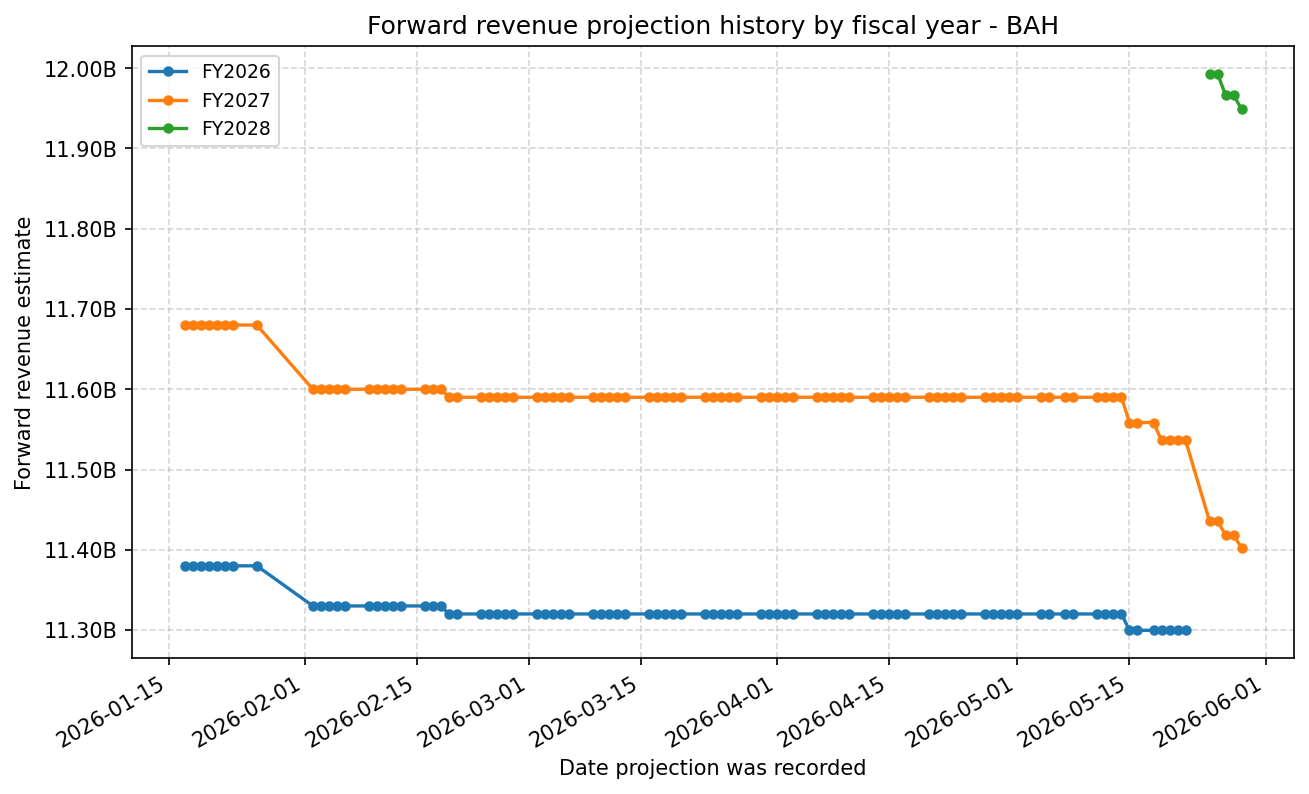
Forward Estimate History
How the next-FY EPS and revenue estimates have drifted over time. One line per fiscal year – past lines end when that FY became current.
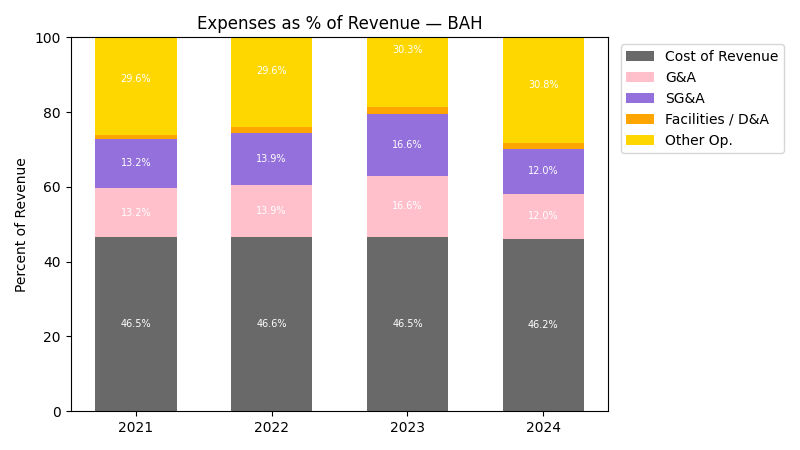
Expenses
| Year | Revenue ($) | Cost of Revenue ($) | G&A ($) | SG&A ($) | Facilities / D&A ($) |
|---|---|---|---|---|---|
| 2023 | $9.3B | $4.1B | $1.5B | $1.5B | $165.0M |
| 2024 | $10.7B | $4.8B | $1.3B | $1.3B | $164.0M |
| 2025 | $12.0B | $5.3B | $1.2B | $1.2B | $165.0M |
| 2026 | $11.2B | $5.1B | $1.3B | $1.3B | $163.0M |
| TTM | $11.2B | $5.1B | $1.3B | $1.3B | $163.0M |
| Year | Revenue Change (%) | Cost of Revenue Change (%) | G&A Change (%) | SG&A Change (%) | Facilities / D&A Change (%) |
|---|---|---|---|---|---|
| 2024 | 15.15 | 14.90 | -16.44 | -16.44 | -0.61 |
| 2025 | 12.36 | 10.45 | -2.73 | -2.73 | 0.61 |
| 2026 | -6.37 | -2.13 | 1.61 | 1.61 | -1.21 |
| TTM | 0.00 | 0.00 | 0.00 | 0.00 | 0.00 |
No unmapped expenses.
Balance Sheet
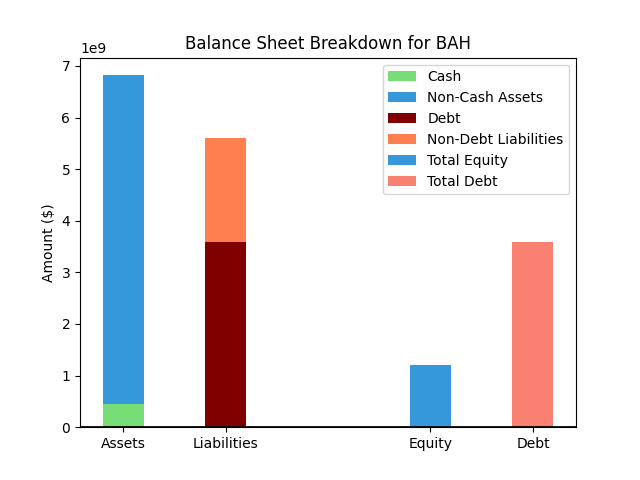
| Metric | Value | |
|---|---|---|
| 0 | Total Assets | $7,118M |
| 1 | Cash | $728M |
| 2 | Total Liabilities | $6,013M |
| 3 | Total Debt | $4,122M |
| 4 | Total Equity | $1,105M |
| 5 | Debt to Equity Ratio | 3.73 |
EPS & Dividend
Valuation
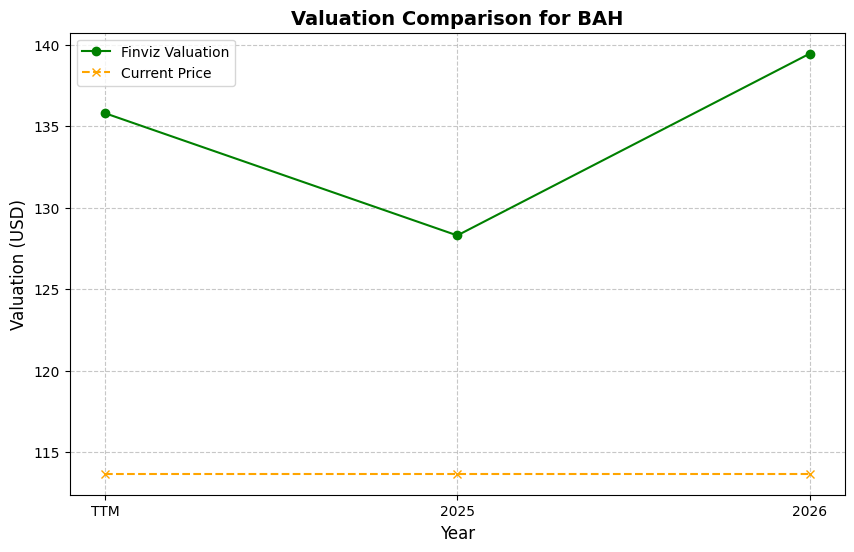
| Share Price | Treasury Yield | Estimates | Fair Value (P/E) | Fair Value (P/S) | Current P/S | Current P/E |
|---|---|---|---|---|---|---|
| $79.18 | 4.5% | FINVIZ Growth: 5% | Nicks: 6 Finviz: 11 |
Nick's: 0.000 | 0.8 | 11.5 |
| Basis | Year | Nicks Valuation | Nicks vs Share Price | Finviz Valuation | Finviz vs Share Price |
|---|---|---|---|---|---|
| $6.90 EPS | TTM | $43.75 | -44.7% | $73.60 | -7.1% |
| $6.26 EPS | 2027 | $39.70 | -49.9% | $66.78 | -15.7% |
| $6.86 EPS | 2028 | $43.50 | -45.1% | $73.17 | -7.6% |
Implied Growth
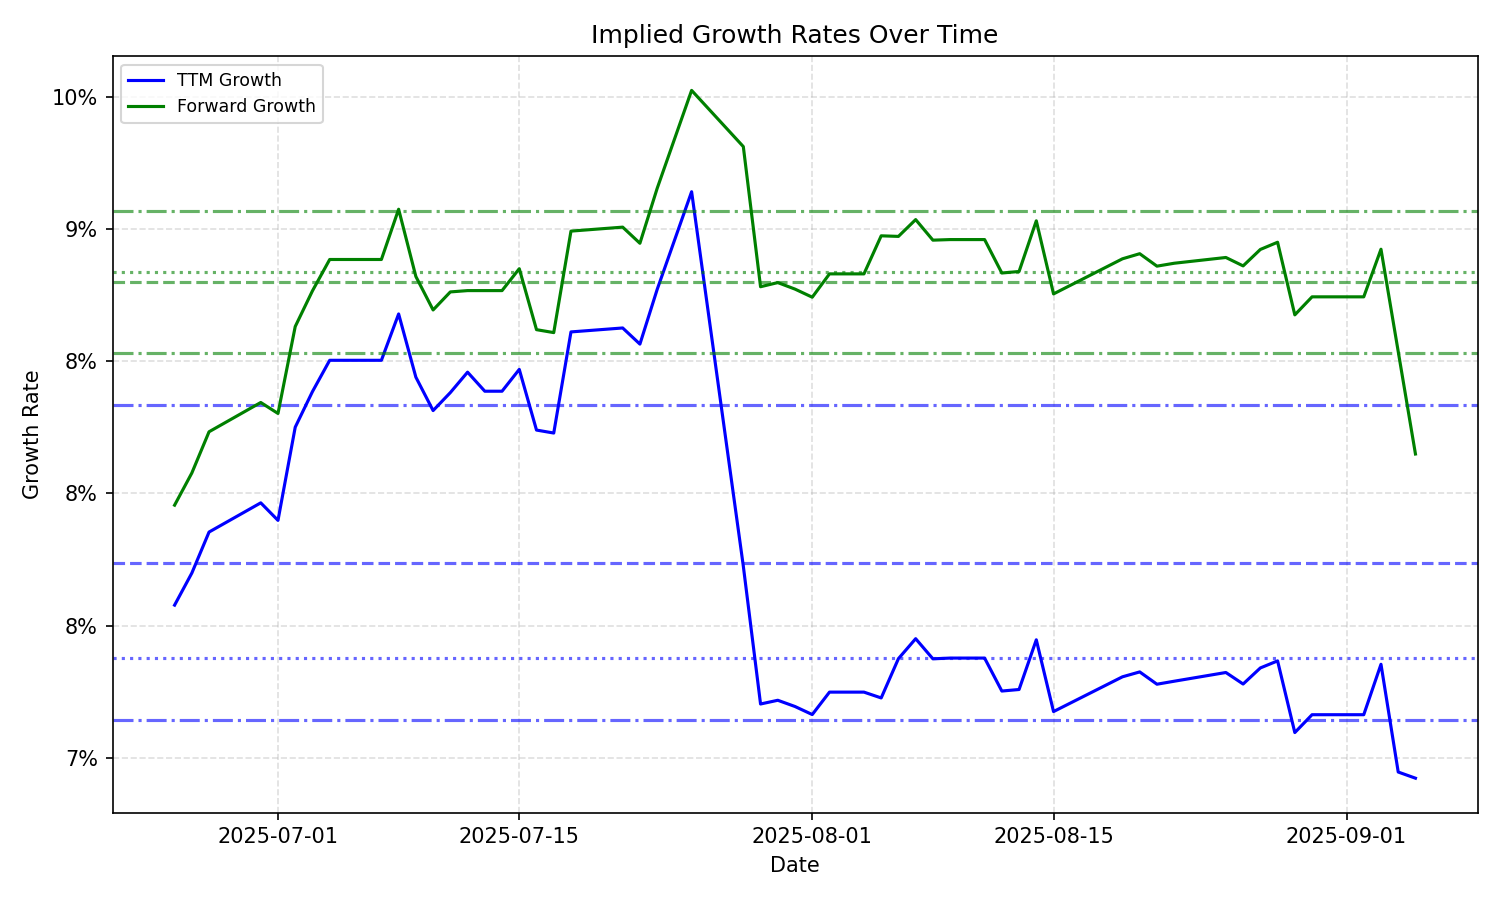
| Average | Median | Std Dev | Current | Percentile | ||||||
|---|---|---|---|---|---|---|---|---|---|---|
| TTM | Forward | TTM | Forward | TTM | Forward | TTM | Forward | TTM | Forward | |
| Timeframe | ||||||||||
| 1 Year | 6.69% | 7.44% | 6.46% | 7.54% | 0.92% | 1.14% | 6.08% | 6.14% | 29.0% | 14.9% |
| 3 Years | 6.69% | 7.44% | 6.46% | 7.54% | 0.92% | 1.14% | 6.08% | 6.14% | 29.0% | 14.9% |
| 5 Years | 6.69% | 7.44% | 6.46% | 7.54% | 0.92% | 1.14% | 6.08% | 6.14% | 29.0% | 14.9% |
| 10 Years | 6.69% | 7.44% | 6.46% | 7.54% | 0.92% | 1.14% | 6.08% | 6.14% | 29.0% | 14.9% |