Bank of America Corporation — BAC
| Close Price | Market Cap | P/E Ratio | Forward P/E Ratio | Implied Growth* | Implied Forward Growth* | Dividend | P/B Ratio |
|---|---|---|---|---|---|---|---|
| $51.60 | $366.18B | 12.8 | 10.2 | 7.0% | 4.7% | $1.12 2.2% | 1.3 |
Latest Headlines
- · Bank of America Could Be a Bargain After Strong Q1 Earnings
- · Snowflake stock analyst reveals surprising stock forecast
- · Bank of America has stark message for silver investors in 2026
- · Wells Fargo Signals Strong Q2 Fee Income Growth at Bernstein Conference
- · BofA says Select Water is becoming an energy infrastructure play
- · The Bond Market’s Biggest Problem Isn’t Oil
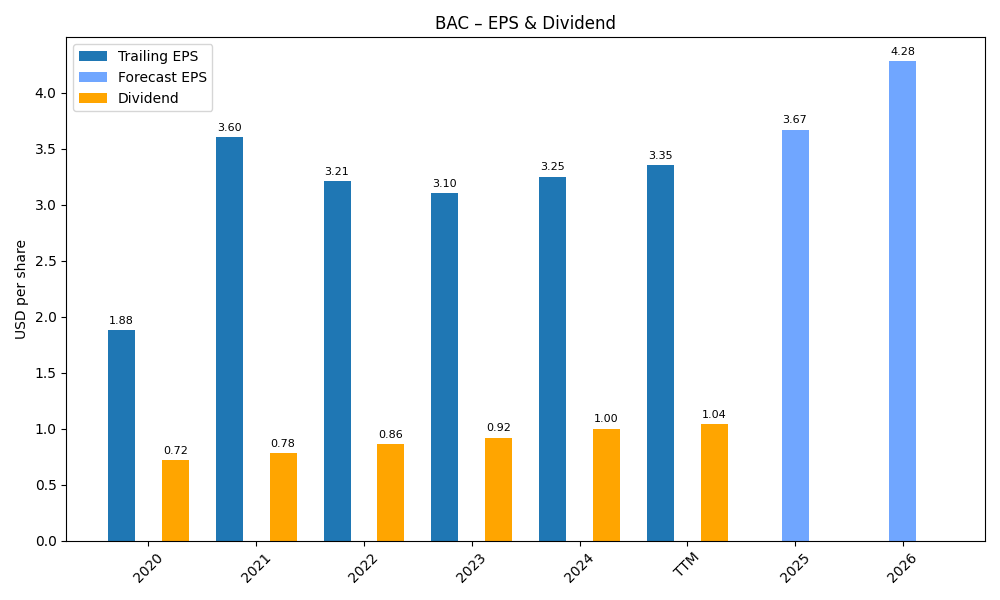
Revenue & Net Income
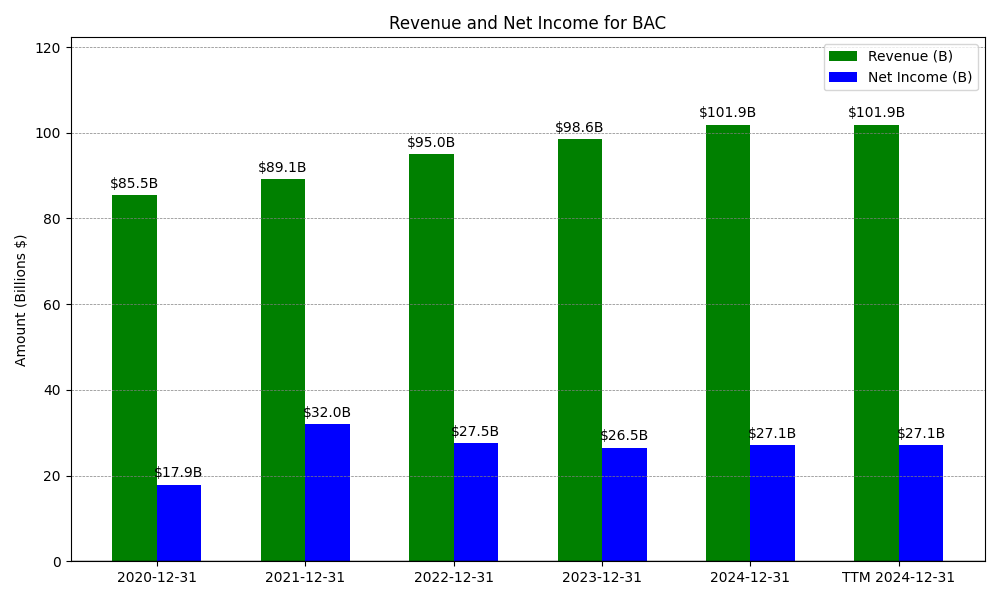
| Date | Revenue | Net_Income | EPS | Last_Updated | Revenue_Change | Net_Income_Change | EPS_Change | |
|---|---|---|---|---|---|---|---|---|
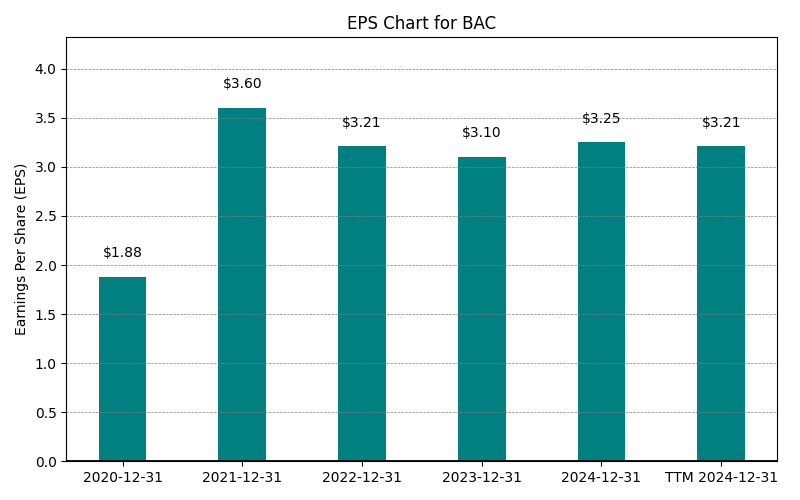
| 0 | 2020-12-31 | $85,528M | $17,894M | $1.88 | 2024-02-09 04:06:51 | N/A | N/A | N/A |
| 1 | 2021-12-31 | $89,113M | $31,978M | $3.21 | 2026-03-05 08:30:56 | 4.2% | 78.7% | 70.7% |
| 2 | 2022-12-31 | $94,950M | $27,528M | $3.21 | 2026-05-29 09:05:12 | 6.6% | -13.9% | 0.0% |
| 3 | 2023-12-31 | $102,769M | $26,305M | $3.10 | 2026-05-29 09:05:12 | 8.2% | -4.4% | -3.4% |
| 4 | 2024-12-31 | $105,856M | $26,973M | $3.25 | 2026-05-29 09:05:12 | 3.0% | 2.5% | 4.8% |
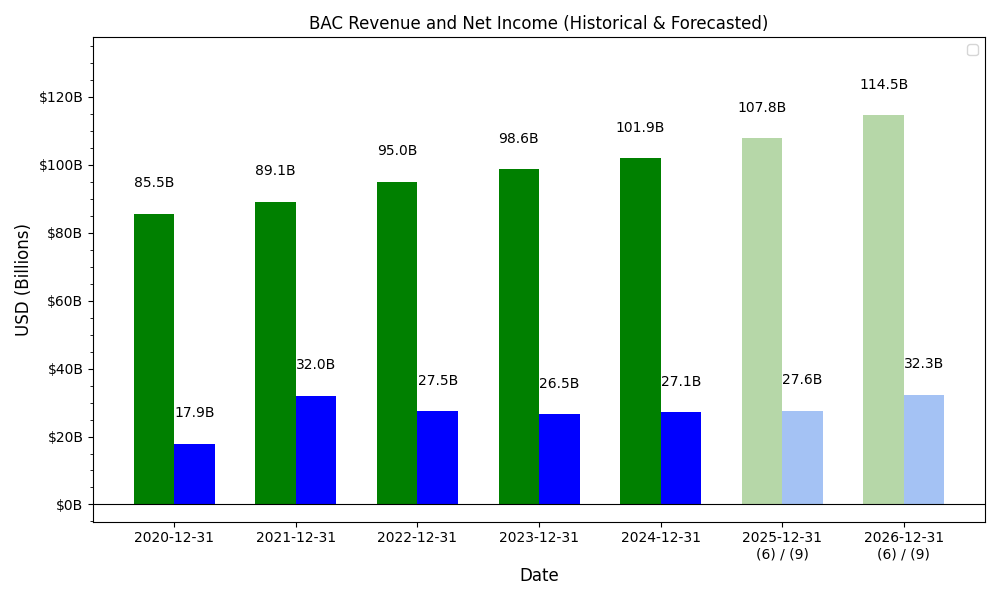
| 5 | 2025-12-31 | $113,097M | $30,509M | $3.86 | 2026-05-29 09:05:12 | 6.8% | 13.1% | 18.8% |
| 6 | TTM 2026-03-31 | $116,003M | $31,697M | $4.03 | 2026-04-17 08:32:19 | 2.6% | 3.9% | 4.4% |
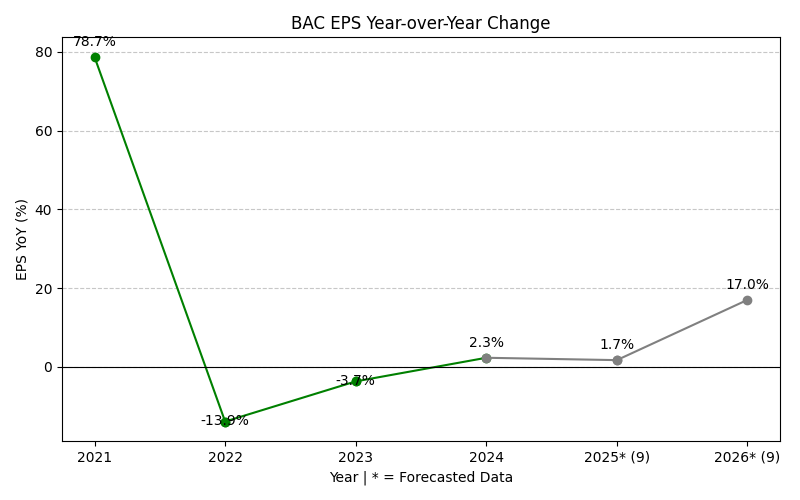
EPS
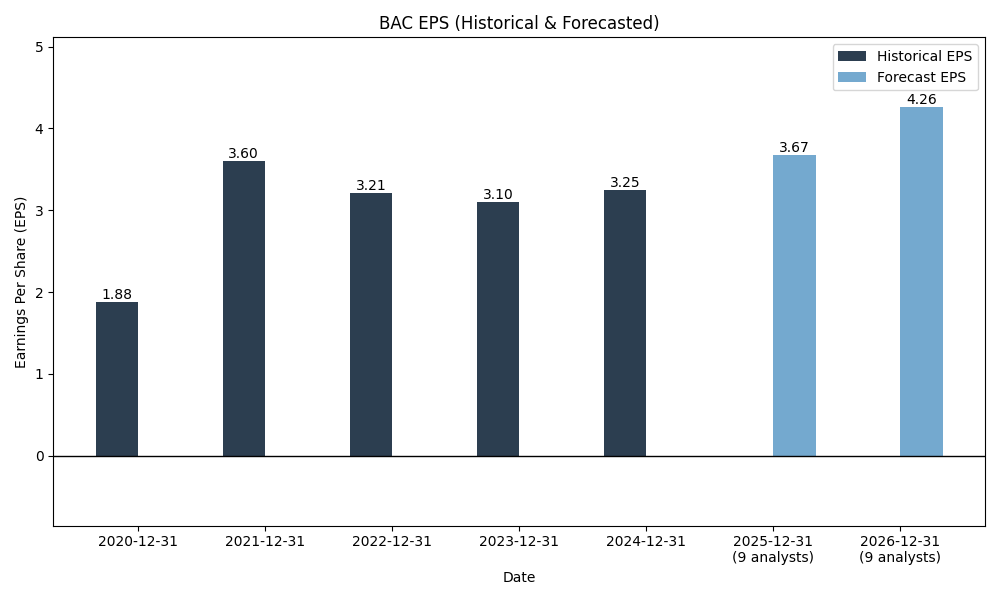
Forecasts
Y/Y % Change
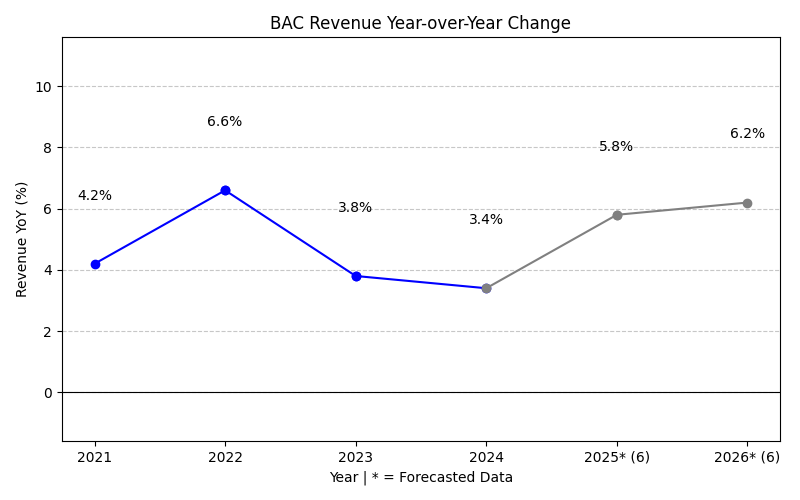
BAC Year-over-Year Growth
| 2020 | 2021 | 2022 | 2023 | 2024 | 2025 | 2026 | 2027 | Average | |
|---|---|---|---|---|---|---|---|---|---|
| Revenue Growth (%) | 4.2% | 6.6% | 8.2% | 3.0% | 6.8% | 7.1% | 4.8% | 5.8% | |
| Revenue Analysts (#) | 0 | 0 | 0 | 0 | 0 | 0 | 11 | 12 | |
| EPS Growth (%) | 78.7% | -13.9% | -4.4% | 2.5% | 13.1% | 4.0% | 12.8% | 13.3% | |
| EPS Analysts (#) | 0 | 0 | 0 | 0 | 0 | 0 | 18 | 17 |
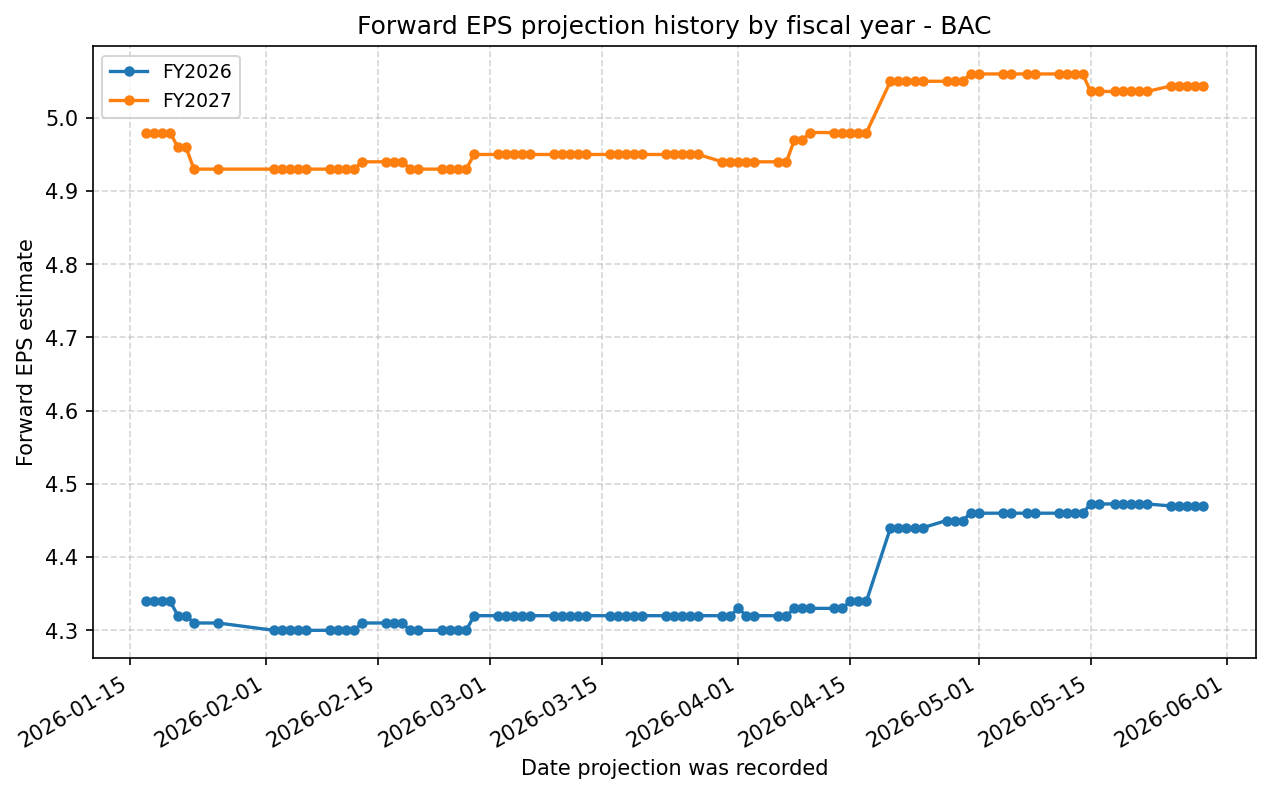
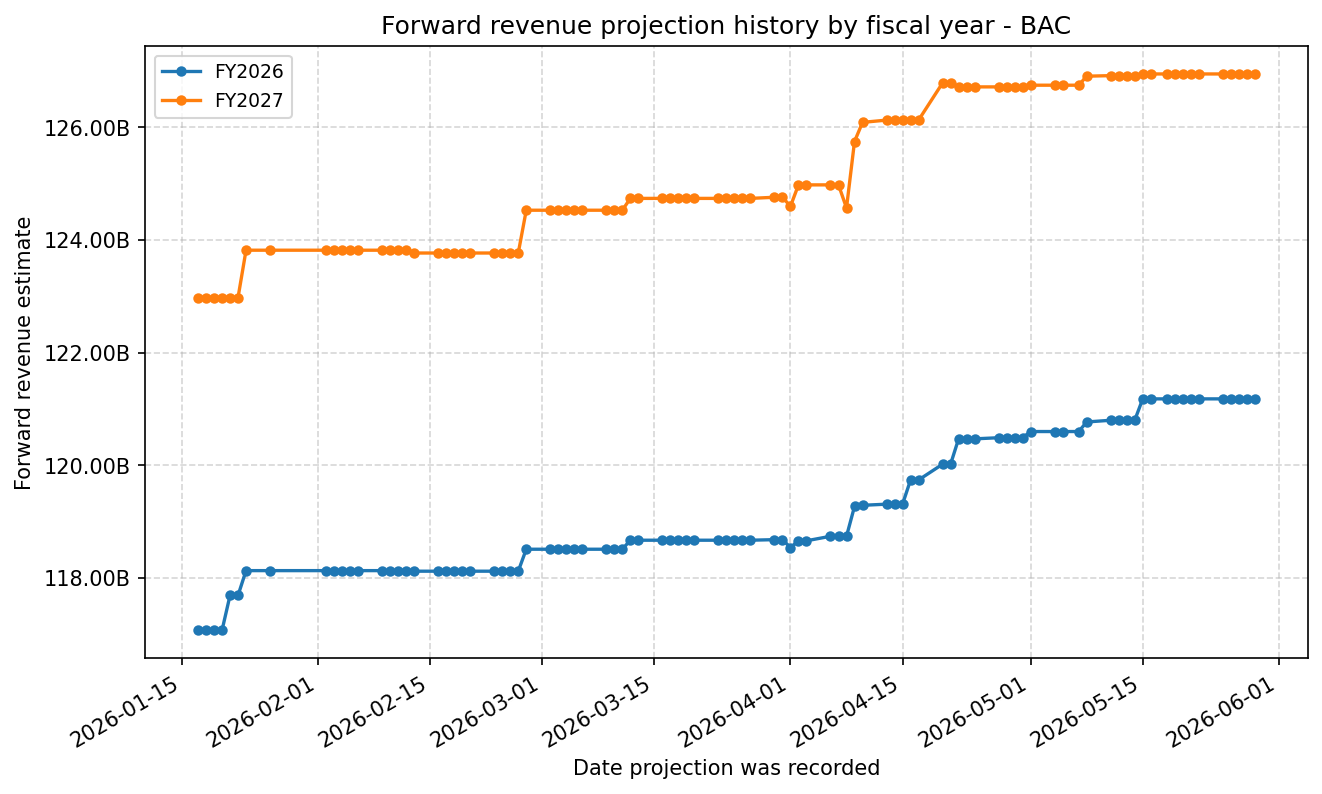
Forward Estimate History
How the next-FY EPS and revenue estimates have drifted over time. One line per fiscal year – past lines end when that FY became current.
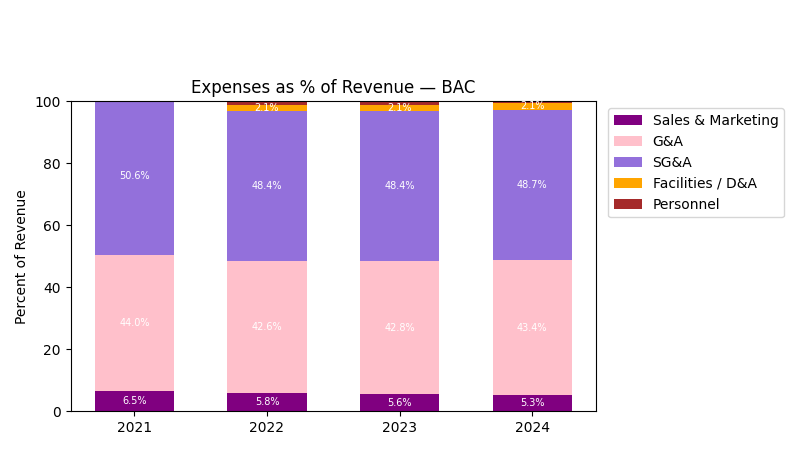
Expenses
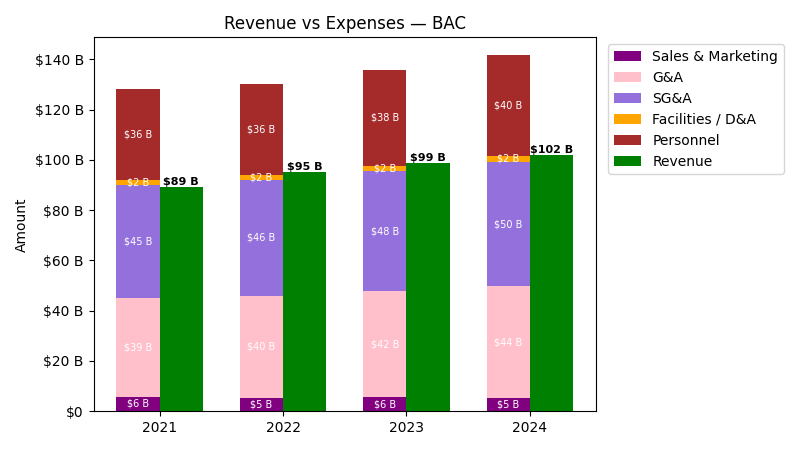
| Year | Revenue ($) | Sales & Marketing ($) | G&A ($) | SG&A ($) | Facilities / D&A ($) | Personnel ($) |
|---|---|---|---|---|---|---|
| 2022 | $95.0B | $5.5B | $40.5B | $45.9B | $2.0B | $36.4B |
| 2023 | $102.8B | $5.5B | $44.3B | $49.8B | $2.1B | $38.3B |
| 2024 | $105.9B | $5.5B | $44.2B | $49.6B | $2.2B | $40.2B |
| 2025 | $113.1B | $6.1B | $46.1B | $52.2B | $2.3B | $42.3B |
| TTM | $116.0B | $6.4B | $46.5B | $52.9B | $2.4B | $42.8B |
| Year | Revenue Change (%) | Sales & Marketing Change (%) | G&A Change (%) | SG&A Change (%) | Facilities / D&A Change (%) | Personnel Change (%) |
|---|---|---|---|---|---|---|
| 2023 | 8.23 | 1.04 | 9.42 | 8.42 | 3.99 | 5.17 |
| 2024 | 3.00 | -1.54 | -0.24 | -0.39 | 6.42 | 4.83 |
| 2025 | 6.84 | 12.44 | 4.40 | 5.29 | 5.71 | 5.39 |
| TTM | 2.57 | 3.90 | 0.92 | 1.27 | 1.73 | 1.05 |
No unmapped expenses.
Balance Sheet
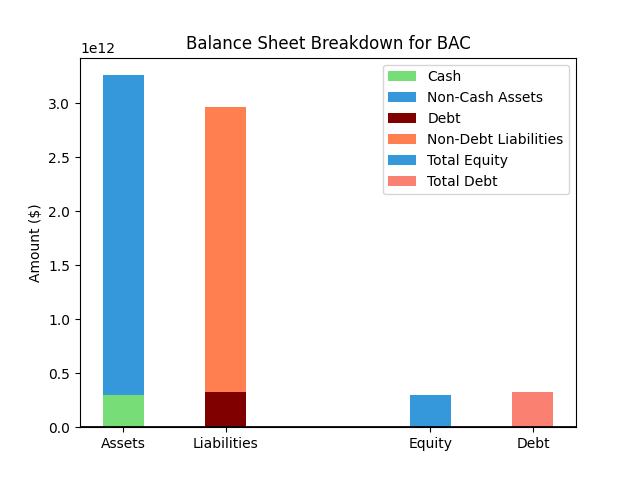
| Metric | Value | |
|---|---|---|
| 0 | Total Assets | $3,496,186M |
| 1 | Cash | $249,865M |
| 2 | Total Liabilities | $3,195,518M |
| 3 | Total Debt | $383,594M |
| 4 | Total Equity | $300,668M |
| 5 | Debt to Equity Ratio | 1.28 |
EPS & Dividend
Valuation
| Share Price | Treasury Yield | Estimates | Fair Value (P/E) | Fair Value (P/S) | Current P/S | Current P/E |
|---|---|---|---|---|---|---|
| $51.60 | 4.5% | Nicks Growth: 10% Nick's Expected Margin: 25% FINVIZ Growth: 15% |
Nicks: 17 Finviz: 27 |
Nick's: 4.289 | 3.2 | 12.8 |
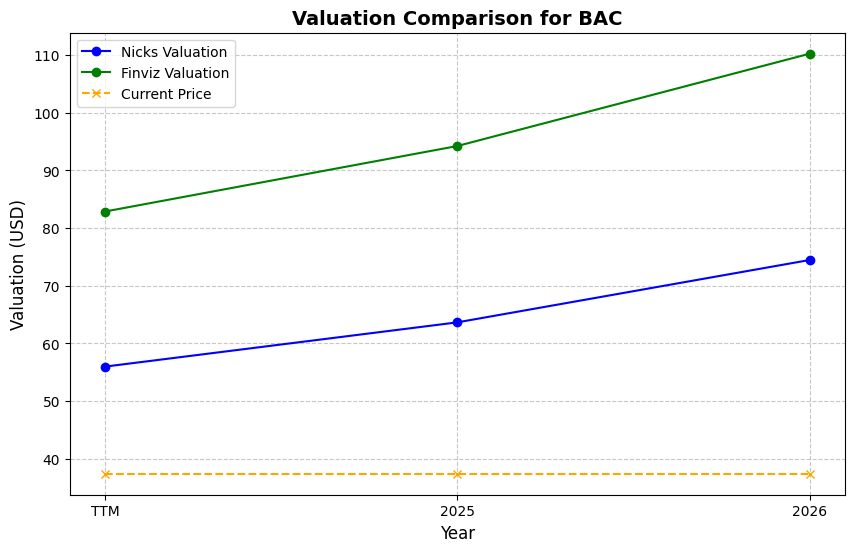
| Basis | Year | Nicks Valuation | Nicks vs Share Price | Finviz Valuation | Finviz vs Share Price |
|---|---|---|---|---|---|
| $4.03 EPS | TTM | $69.15 | 34.0% | $109.25 | 111.7% |
| $4.47 EPS | 2026 | $76.69 | 48.6% | $121.18 | 134.8% |
| $5.04 EPS | 2027 | $86.53 | 67.7% | $136.72 | 165.0% |
Implied Growth
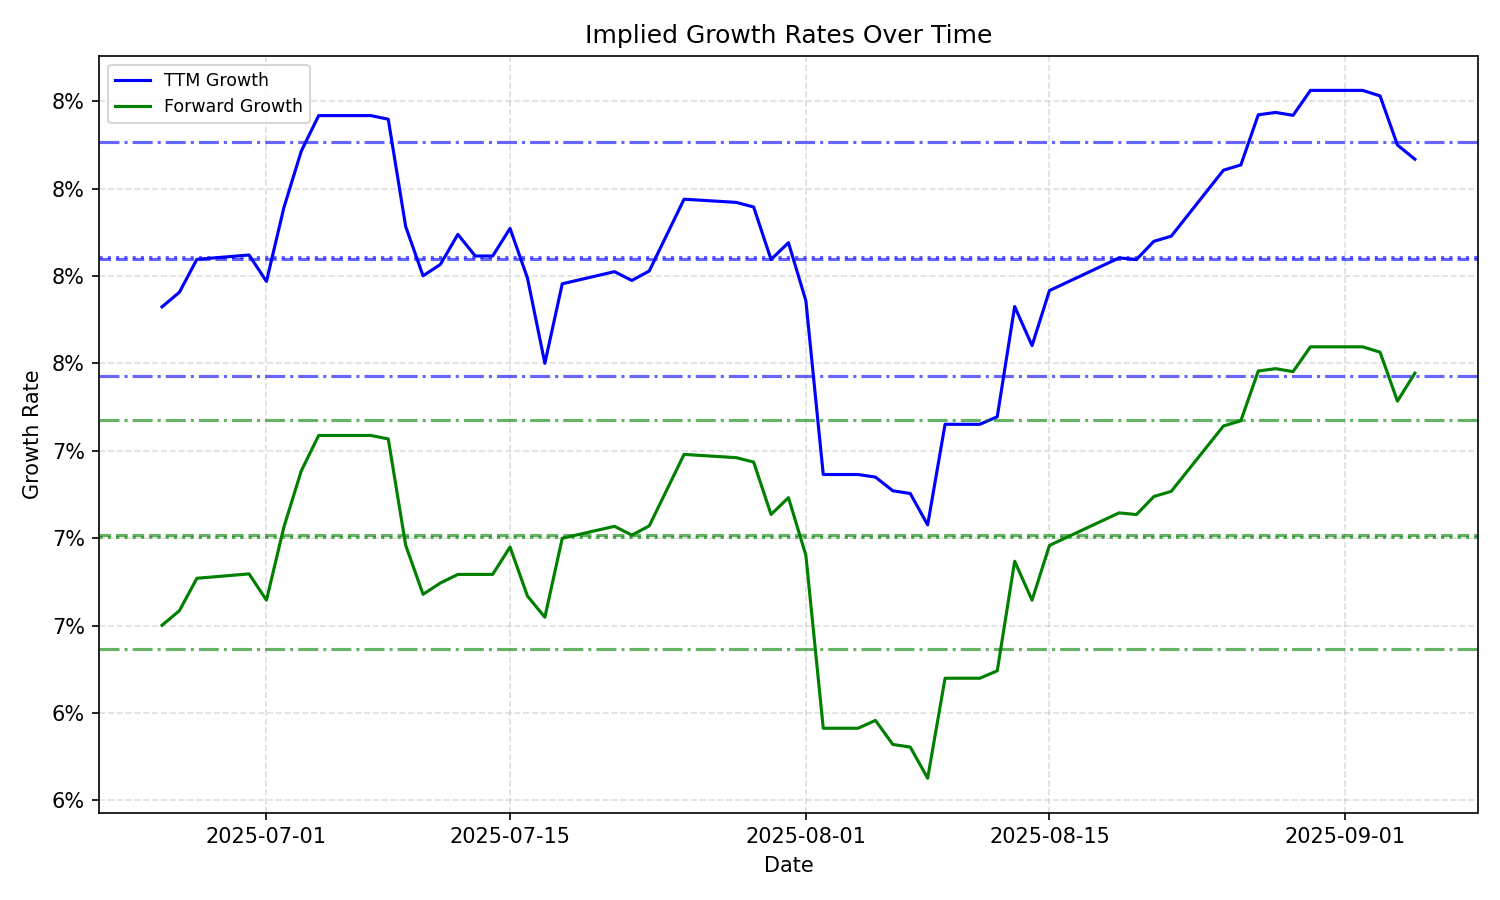
| Average | Median | Std Dev | Current | Percentile | ||||||
|---|---|---|---|---|---|---|---|---|---|---|
| TTM | Forward | TTM | Forward | TTM | Forward | TTM | Forward | TTM | Forward | |
| Timeframe | ||||||||||
| 1 Year | 7.62% | 6.23% | 7.71% | 6.81% | 0.57% | 1.39% | 6.79% | 4.51% | 9.6% | 15.4% |
| 3 Years | 7.62% | 6.23% | 7.71% | 6.81% | 0.57% | 1.39% | 6.79% | 4.51% | 9.6% | 15.4% |
| 5 Years | 7.62% | 6.23% | 7.71% | 6.81% | 0.57% | 1.39% | 6.79% | 4.51% | 9.6% | 15.4% |
| 10 Years | 7.62% | 6.23% | 7.71% | 6.81% | 0.57% | 1.39% | 6.79% | 4.51% | 9.6% | 15.4% |