Alibaba Group Holding Limited — BABA
| Close Price | Market Cap | P/E Ratio | Forward P/E Ratio | Implied Growth* | Implied Forward Growth* | Dividend | P/B Ratio |
|---|---|---|---|---|---|---|---|
| $124.22 | $298.02B | 19.2 | 13.5 | 11.2% | 7.5% | $1.05 0.8% | 1.8 |
Latest Headlines
- · Alibaba’s Blockchain Lending And Smart City Push Versus Current Valuation
- · Here is What to Know Beyond Why Alibaba Group Holding Limited (BABA) is a Trending Stock
- · BABA vs. META: Which AI Data Center Giant Is the Better Bet?
- · SpaceX Is Headed for a $1.75 Trillion IPO. History Says the Stock Could Be Down 32% a Year From Now
- · Exclusive: Ant Group-backed R25 launches emerging-market consumer credit vault
- · Powering Macau's Smart Future with AI - MACAU Pass and Ant Bank (Macao) Partner with Alibaba Ecosystem to Showcase Smart City Vision at BEYOND Expo
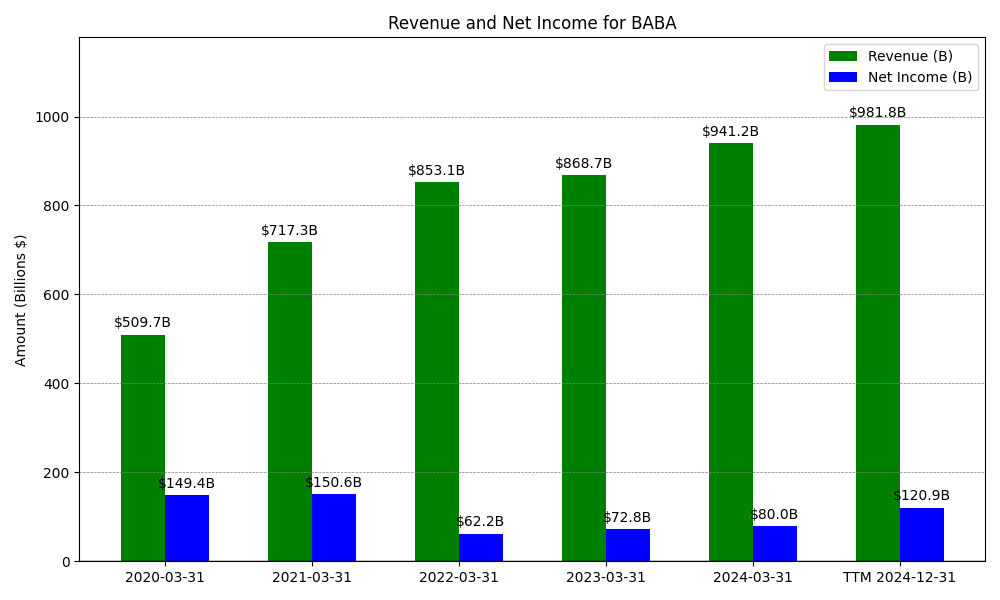
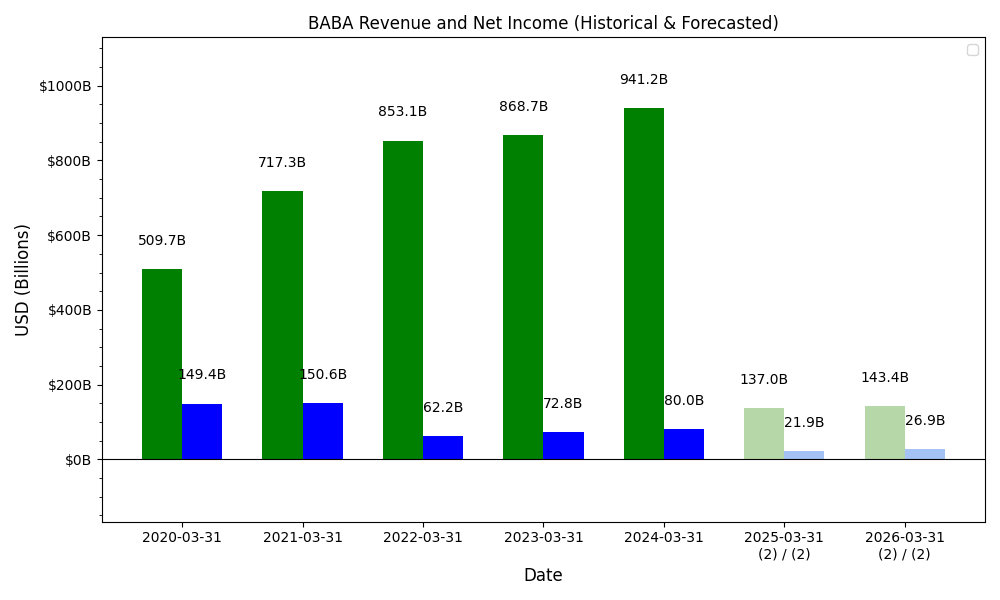
Revenue & Net Income
| Date | Revenue | Net_Income | EPS | Last_Updated | Revenue_Change | Net_Income_Change | EPS_Change | |
|---|---|---|---|---|---|---|---|---|
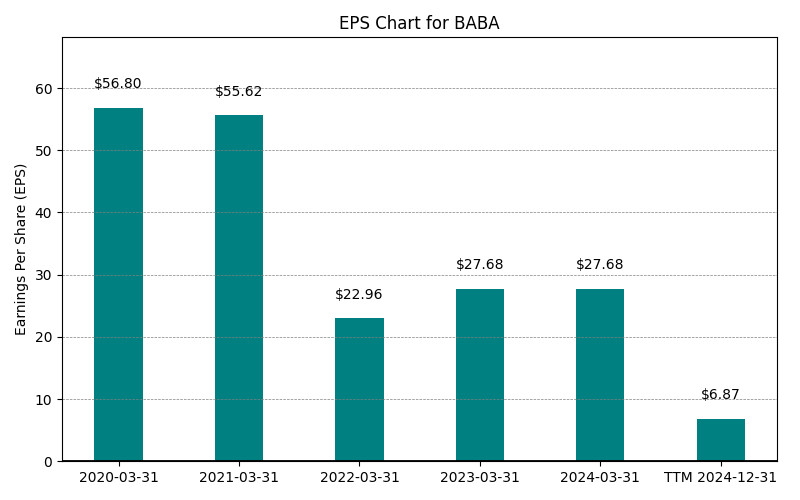
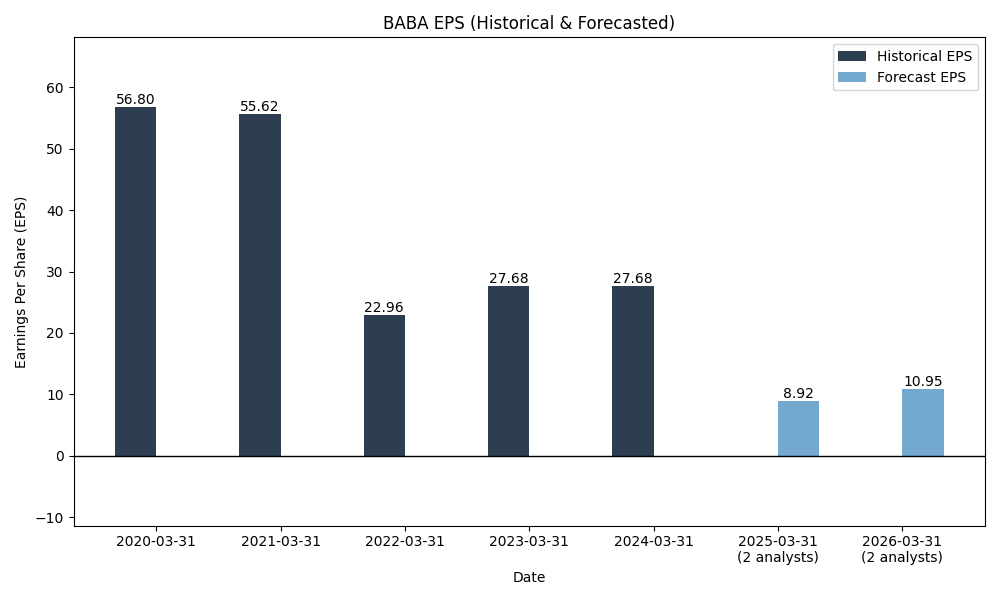
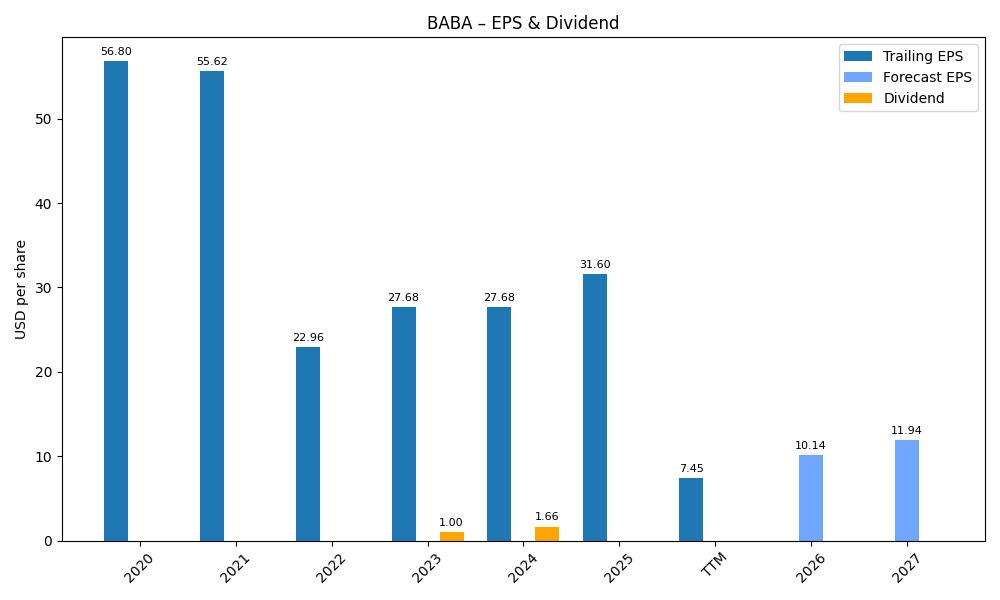
| 0 | 2020-03-31 | $509,711M | $149,433M | $56.80 | 2024-02-04 04:18:27 | N/A | N/A | N/A |
| 1 | 2021-03-31 | $717,289M | $150,578M | $55.62 | 2024-02-04 04:18:27 | 40.7% | 0.8% | -2.1% |
| 2 | 2022-03-31 | $853,062M | $62,249M | $22.96 | 2026-05-21 09:04:09 | 18.9% | -58.7% | -58.7% |
| 3 | 2023-03-31 | $868,687M | $72,783M | $27.68 | 2026-05-29 09:05:09 | 1.8% | 16.9% | 20.6% |
| 4 | 2024-03-31 | $941,168M | $80,009M | $31.60 | 2026-05-29 09:05:09 | 8.3% | 9.9% | 14.2% |
| 5 | 2025-03-31 | $996,347M | $130,109M | $55.12 | 2026-05-29 09:05:09 | 5.9% | 62.6% | 74.4% |
| 6 | 2026-03-31 | $1,023,670M | $103,592M | $45.60 | 2026-05-29 09:05:09 | 2.7% | -20.4% | -17.3% |
| 7 | TTM 2026-03-31 | $1,023,670M | $103,592M | $6.48 | 2026-05-19 09:04:18 | 0.0% | 0.0% | -85.8% |
EPS
Forecasts
Y/Y % Change
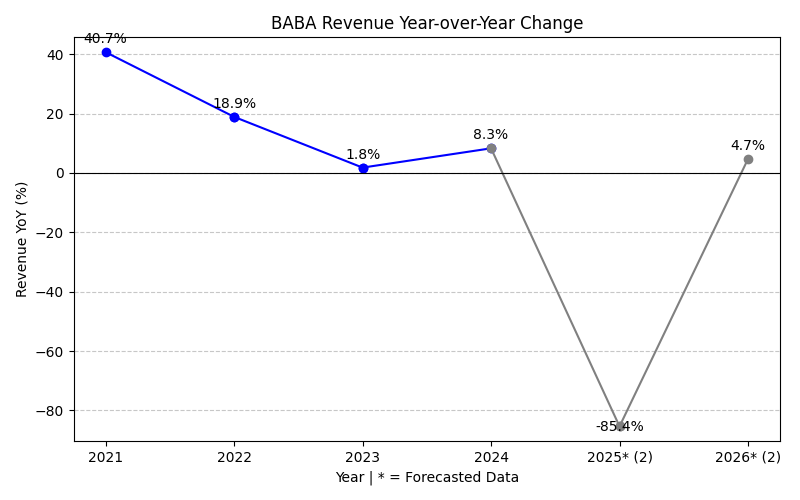
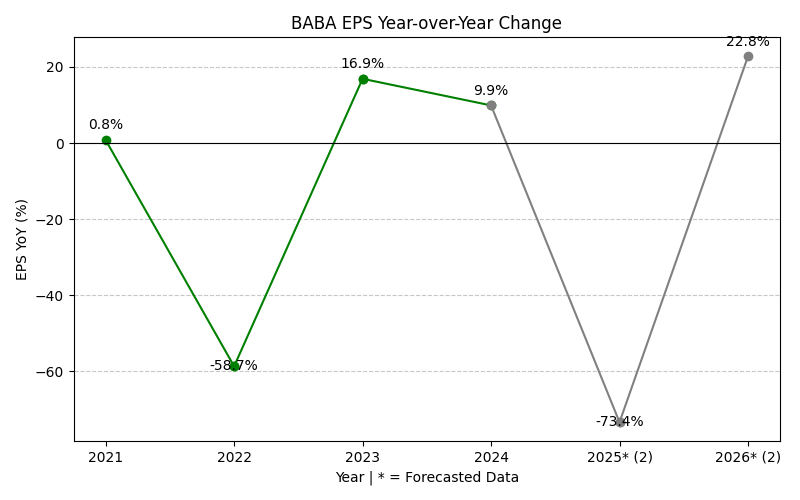
BABA Year-over-Year Growth
| 2020 | 2021 | 2022 | 2023 | 2024 | 2025 | 2026 | 2027 | 2028 | Average | |
|---|---|---|---|---|---|---|---|---|---|---|
| Revenue Growth (%) | 40.7% | 18.9% | 1.8% | 8.3% | 5.9% | 2.7% | 10.6% | 11.2% | 12.5% | |
| Revenue Analysts (#) | 0 | 0 | 0 | 0 | 0 | 0 | 0 | 46 | 39 | |
| EPS Growth (%) | 0.8% | -58.7% | 16.9% | 9.9% | 62.6% | -20.4% | 5.3% | 37.4% | 6.7% | |
| EPS Analysts (#) | 0 | 0 | 0 | 0 | 0 | 0 | 0 | 32 | 29 |
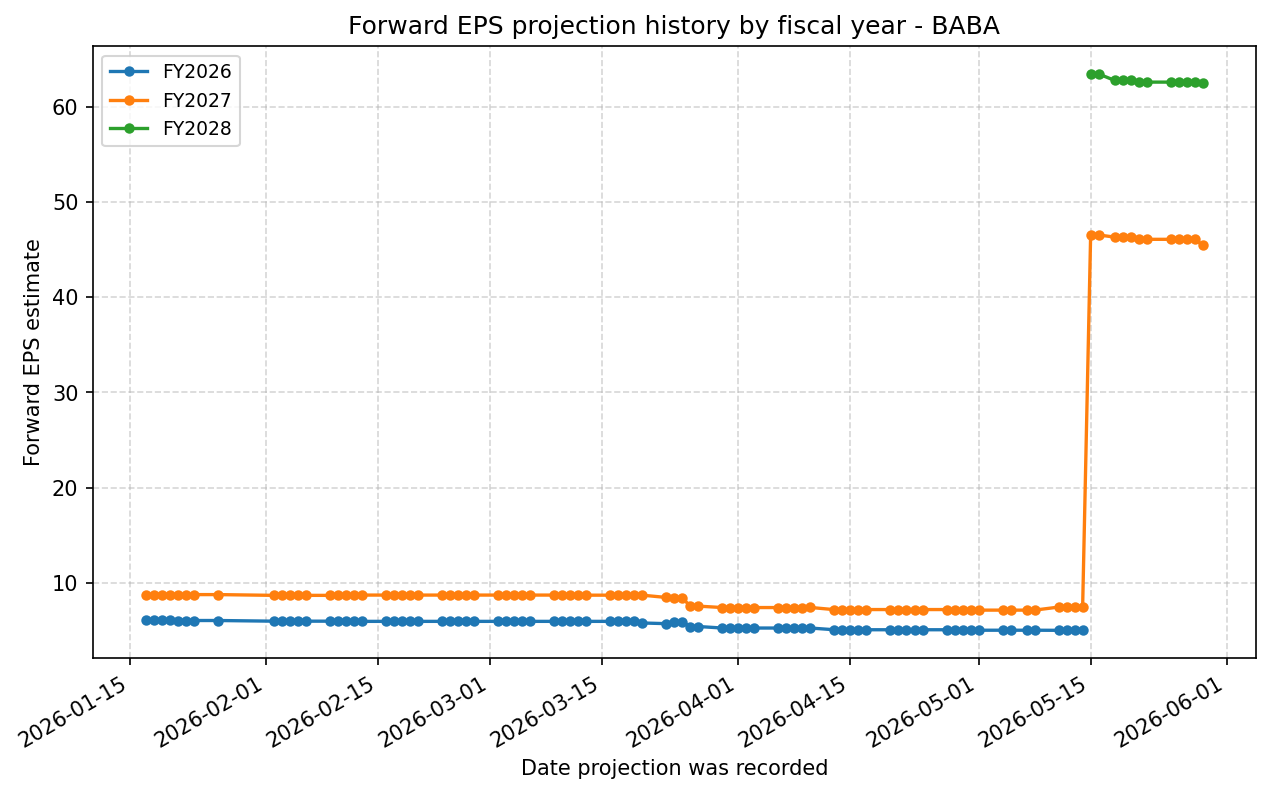
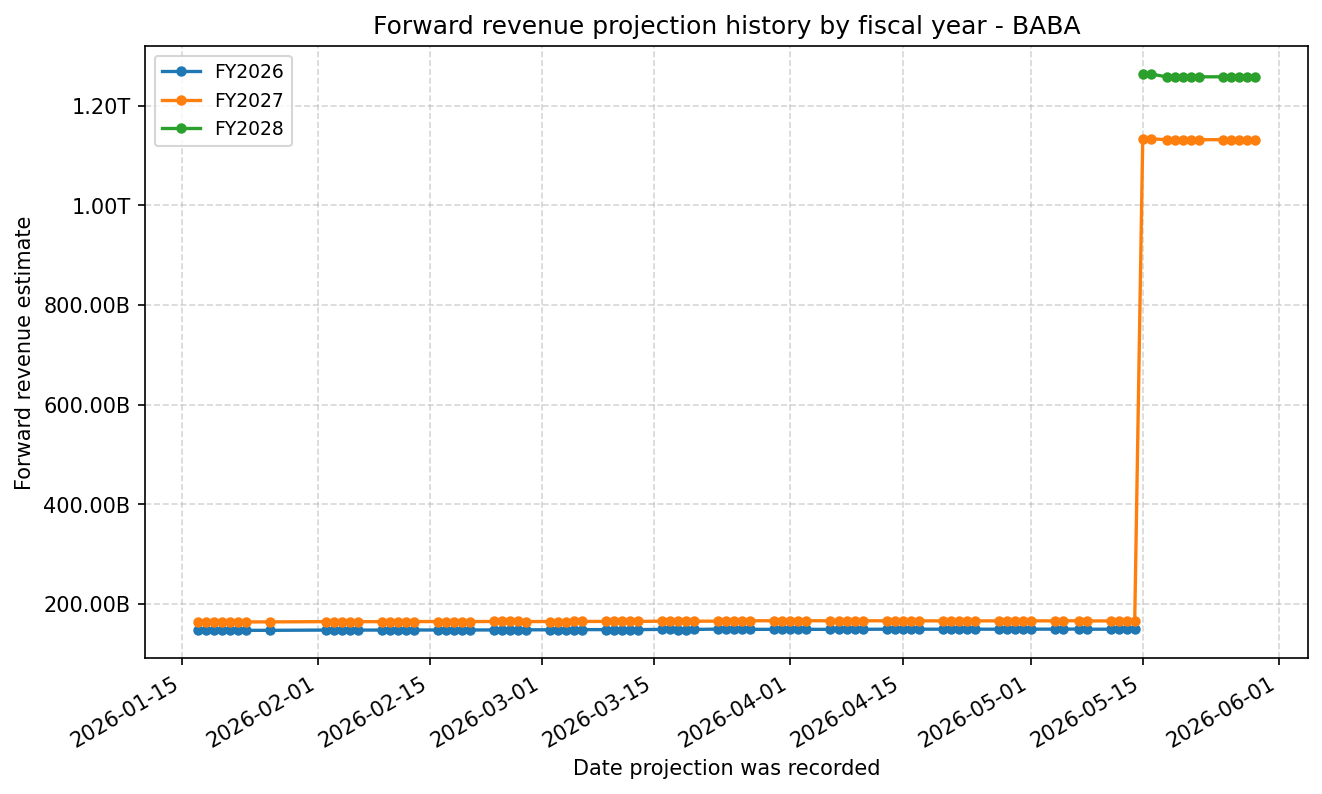
Forward Estimate History
How the next-FY EPS and revenue estimates have drifted over time. One line per fiscal year – past lines end when that FY became current.
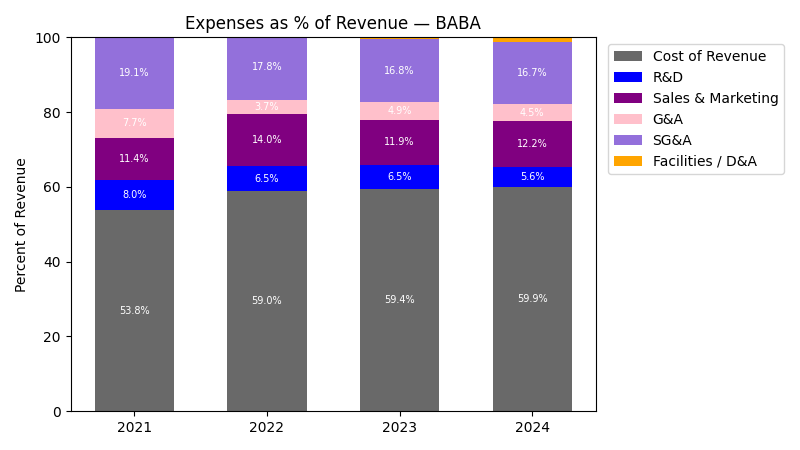
Expenses
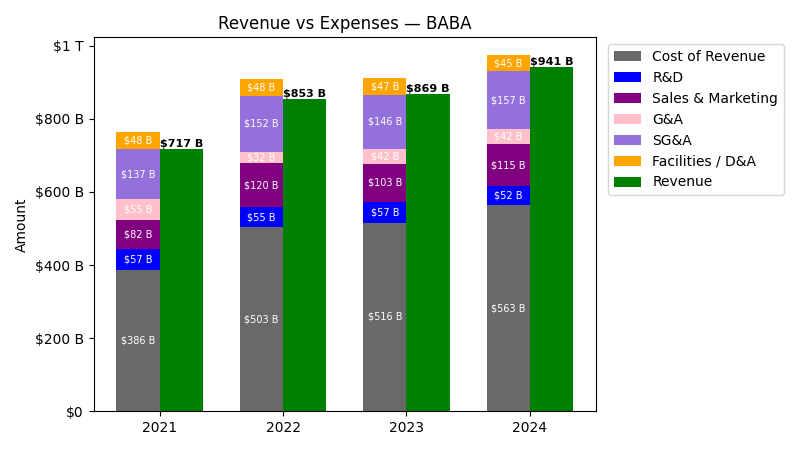
| Year | Revenue ($) | Cost of Revenue ($) | R&D ($) | Sales & Marketing ($) | G&A ($) | SG&A ($) | Facilities / D&A ($) |
|---|---|---|---|---|---|---|---|
| 2022 | $853.1B | $455.0B | $55.5B | $119.8B | $31.9B | $151.7B | $48.1B |
| 2023 | $868.7B | $469.3B | $56.7B | $103.5B | $42.2B | $145.7B | $46.9B |
| 2024 | $941.2B | $518.9B | $52.3B | $115.1B | $42.0B | $157.1B | $44.5B |
| 2025 | $996.3B | $519.7B | $57.2B | $144.0B | $44.2B | $188.3B | $42.5B |
| 2026 | $1.0T | $527.0B | $66.5B | $245.0B | $33.1B | $278.1B | $47.1B |
| TTM | $1.0T | $611.1B | $66.5B | $245.0B | $33.1B | $278.1B | $5.1B |
| Year | Revenue Change (%) | Cost of Revenue Change (%) | R&D Change (%) | Sales & Marketing Change (%) | G&A Change (%) | SG&A Change (%) | Facilities / D&A Change (%) |
|---|---|---|---|---|---|---|---|
| 2023 | 1.83 | 3.16 | 2.31 | -13.61 | 32.14 | -3.98 | -2.34 |
| 2024 | 8.34 | 10.57 | -7.91 | 11.25 | -0.47 | 7.86 | -5.19 |
| 2025 | 5.86 | 0.15 | 9.37 | 25.08 | 5.37 | 19.81 | -4.60 |
| 2026 | 2.74 | 1.40 | 16.42 | 70.13 | -25.22 | 47.72 | 10.97 |
| TTM | 0.00 | 15.95 | 0.00 | 0.00 | 0.00 | 0.00 | -89.22 |
No unmapped expenses.
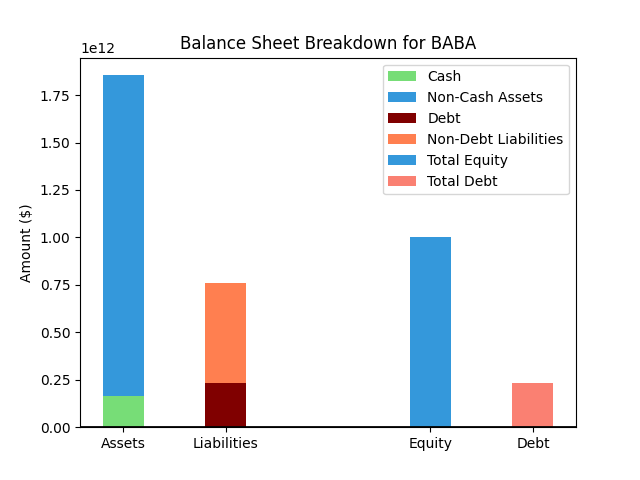
Balance Sheet
| Metric | Value | |
|---|---|---|
| 0 | Total Assets | $1,909,570M |
| 1 | Cash | $131,530M |
| 2 | Total Liabilities | $783,300M |
| 3 | Total Debt | $281,722M |
| 4 | Total Equity | $1,060,886M |
| 5 | Debt to Equity Ratio | 0.27 |
EPS & Dividend
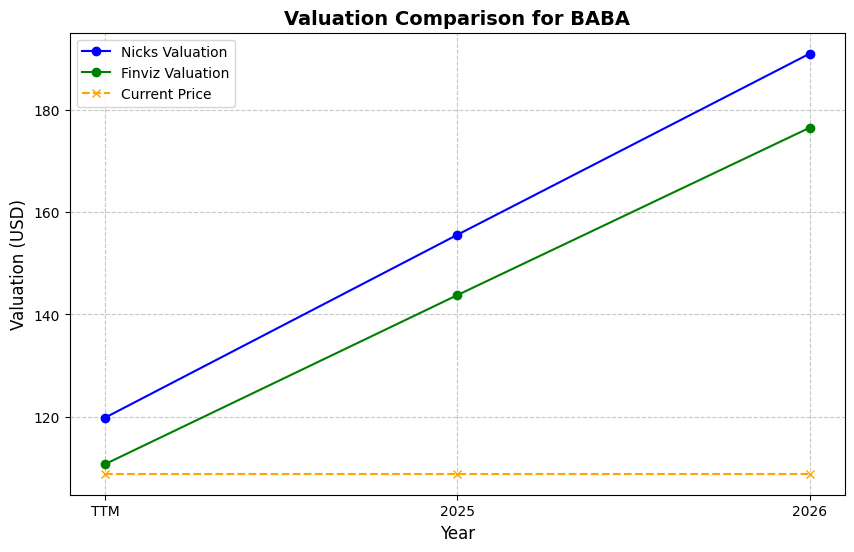
Valuation
| Share Price | Treasury Yield | Estimates | Fair Value (P/E) | Fair Value (P/S) | Current P/S | Current P/E |
|---|---|---|---|---|---|---|
| $124.22 | 4.5% | Nicks Growth: 10% Nick's Expected Margin: 8% FINVIZ Growth: 43% |
Nicks: 17 Finviz: 255 |
Nick's: 1.373 | 0.3 | 19.2 |
| Basis | Year | Nicks Valuation | Nicks vs Share Price | Finviz Valuation | Finviz vs Share Price |
|---|---|---|---|---|---|
| $6.48 EPS | TTM | $111.18 | -10.5% | $1651.27 | 1229.3% |
| $45.45 EPS | 2027 | $779.87 | 527.8% | $11582.59 | 9224.3% |
| $62.44 EPS | 2028 | $1071.30 | 762.4% | $15910.85 | 12708.6% |
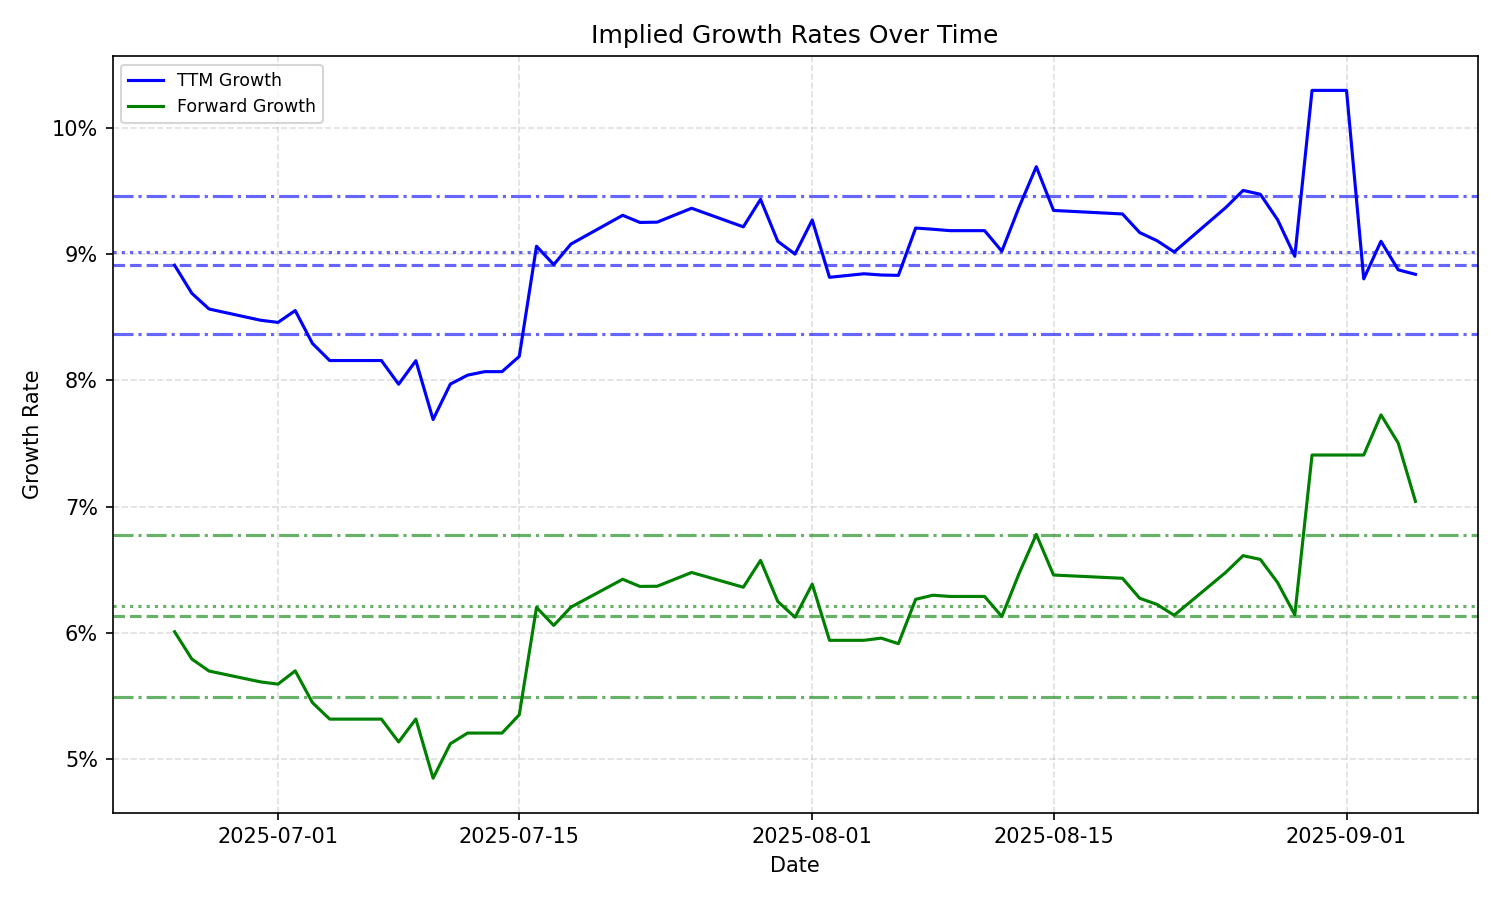
Implied Growth
| Average | Median | Std Dev | Current | Percentile | ||||||
|---|---|---|---|---|---|---|---|---|---|---|
| TTM | Forward | TTM | Forward | TTM | Forward | TTM | Forward | TTM | Forward | |
| Timeframe | ||||||||||
| 1 Year | 10.94% | 8.62% | 11.12% | 8.97% | 1.55% | 1.62% | 11.34% | 7.65% | 56.0% | 25.3% |
| 3 Years | 10.94% | 8.62% | 11.12% | 8.97% | 1.55% | 1.62% | 11.34% | 7.65% | 56.0% | 25.3% |
| 5 Years | 10.94% | 8.62% | 11.12% | 8.97% | 1.55% | 1.62% | 11.34% | 7.65% | 56.0% | 25.3% |
| 10 Years | 10.94% | 8.62% | 11.12% | 8.97% | 1.55% | 1.62% | 11.34% | 7.65% | 56.0% | 25.3% |