American Express Company — AXP
| Close Price | Market Cap | P/E Ratio | Forward P/E Ratio | Implied Growth* | Implied Forward Growth* | Dividend | P/B Ratio |
|---|---|---|---|---|---|---|---|
| $316.47 | $215.94B | 19.8 | 15.7 | 11.5% | 9.1% | $3.80 1.2% | 6.3 |
Latest Headlines
- · Payments Stocks in the Stablecoin Era: 3 to Buy and 1 to Avoid
- · How many employees does American Express have in 2026? Its workforce, locations, and layoffs explained
- · Yes, Airfares Are Rising—But Airline Executives Say That Isn't Stopping You From Flying
- · Do Options Traders Know Something About American Express Stock We Don't?
- · 5 Warren Buffett Stocks to Hold Forever
- · Amex Announces Filing of Feasibility Phase 1 Technical Report for the Perron Gold Mine
Revenue & Net Income
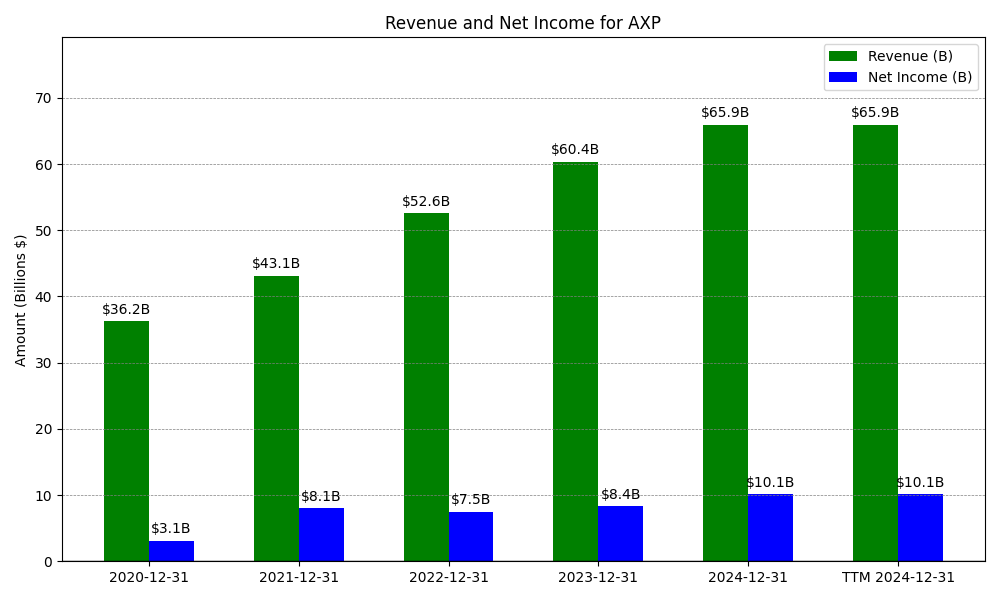
| Date | Revenue | Net_Income | EPS | Last_Updated | Revenue_Change | Net_Income_Change | EPS_Change | |
|---|---|---|---|---|---|---|---|---|
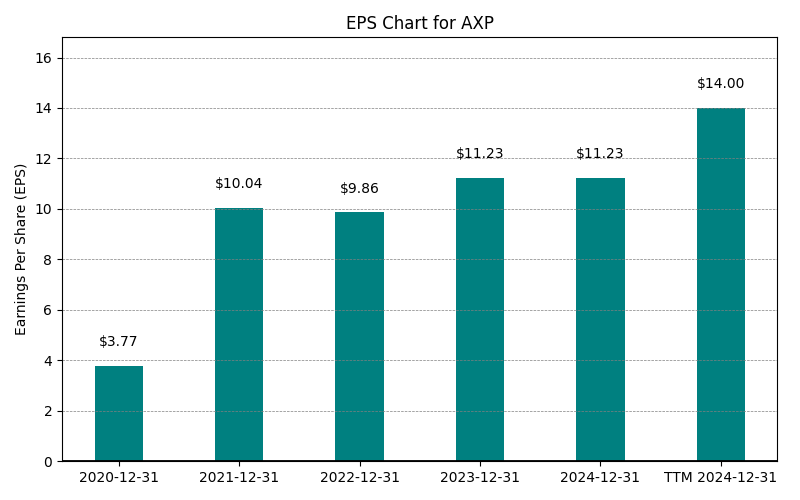
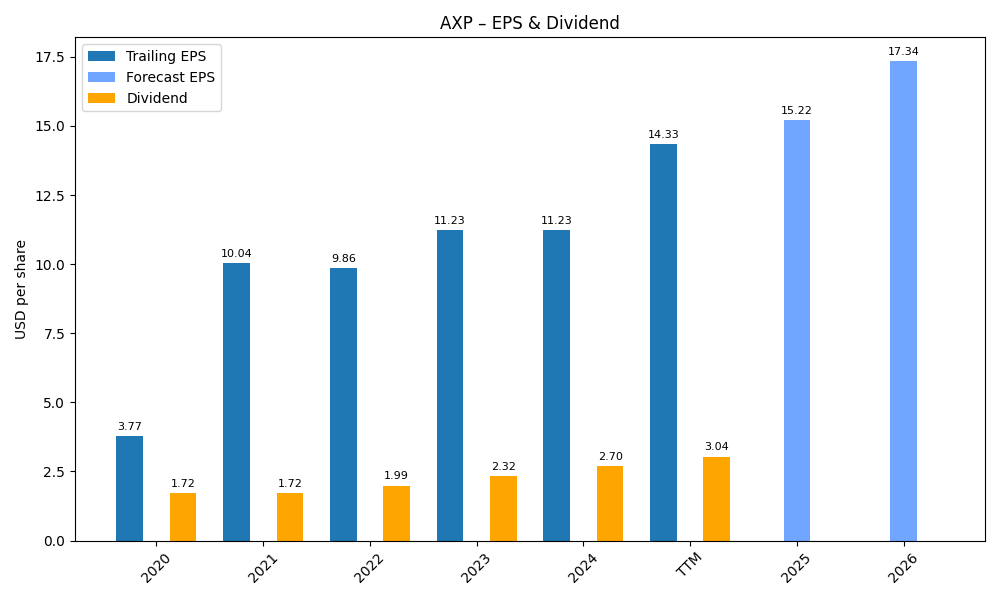
| 0 | 2020-12-31 | $36,239M | $3,135M | $3.77 | 2024-02-09 04:06:50 | N/A | N/A | N/A |
| 1 | 2021-12-31 | $43,147M | $8,060M | $9.86 | 2026-02-09 08:39:38 | 19.1% | 157.1% | 161.5% |
| 2 | 2022-12-31 | $52,862M | $7,514M | $9.86 | 2026-05-29 09:04:54 | 22.5% | -6.8% | 0.0% |
| 3 | 2023-12-31 | $60,515M | $8,374M | $11.23 | 2026-05-29 09:04:54 | 14.5% | 11.4% | 13.9% |
| 4 | 2024-12-31 | $65,949M | $10,129M | $14.04 | 2026-05-29 09:04:54 | 9.0% | 21.0% | 25.0% |
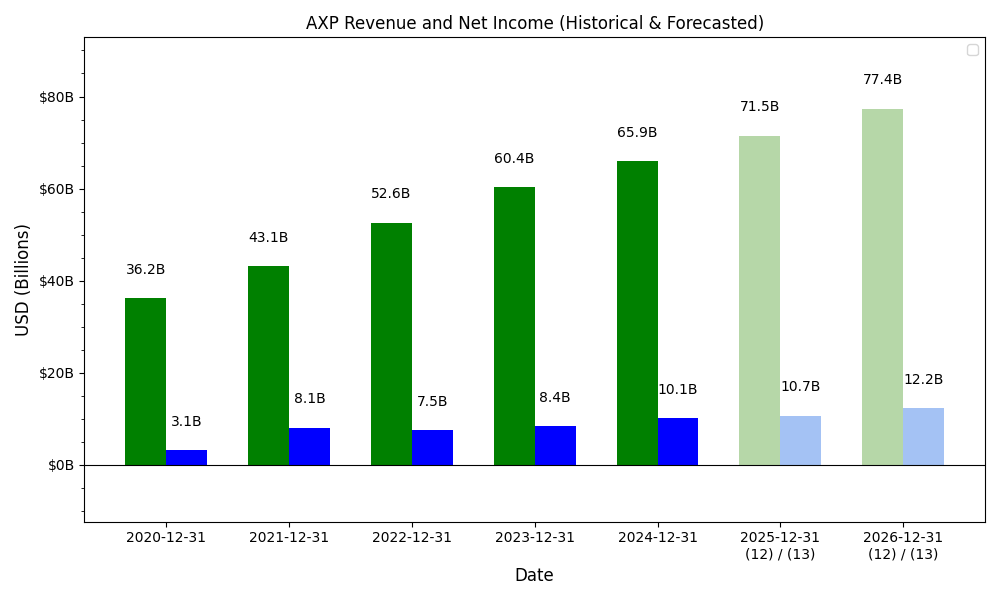
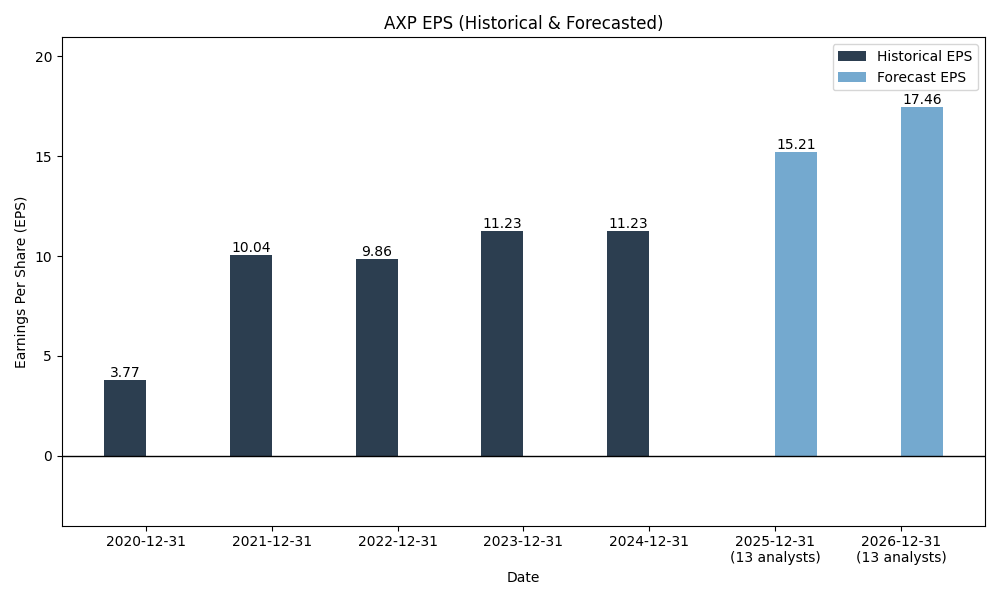
| 5 | 2025-12-31 | $72,230M | $10,833M | $15.41 | 2026-05-29 09:04:54 | 9.5% | 7.0% | 9.8% |
| 6 | TTM 2026-03-31 | $74,171M | $11,220M | $16.01 | 2026-04-27 08:48:45 | 2.7% | 3.6% | 3.9% |
EPS
Forecasts
Y/Y % Change
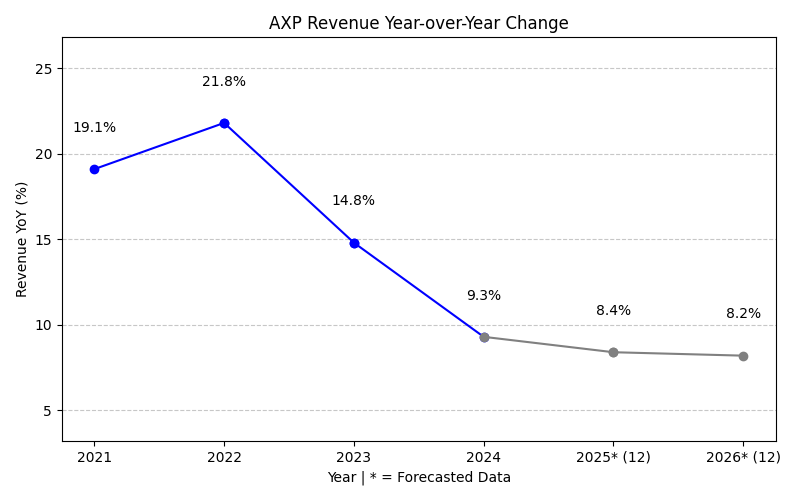
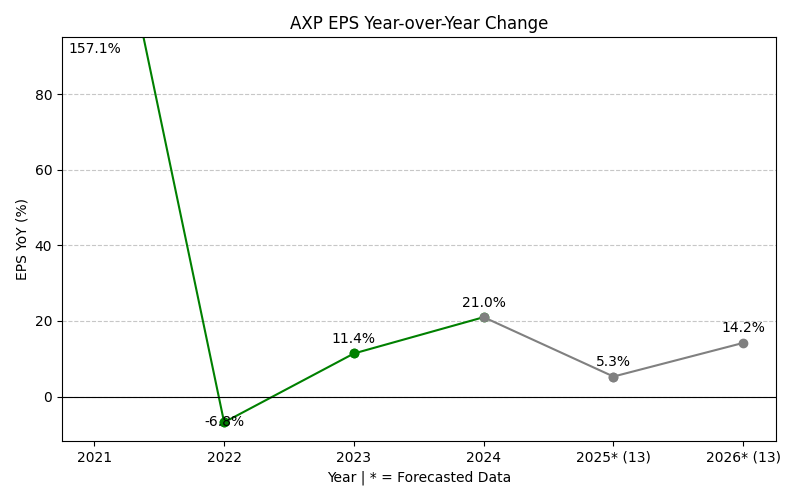
AXP Year-over-Year Growth
| 2020 | 2021 | 2022 | 2023 | 2024 | 2025 | 2026 | 2027 | Average | |
|---|---|---|---|---|---|---|---|---|---|
| Revenue Growth (%) | 19.1% | 22.5% | 14.5% | 9.0% | 9.5% | 9.9% | 8.8% | 13.3% | |
| Revenue Analysts (#) | 0 | 0 | 0 | 0 | 0 | 0 | 23 | 23 | |
| EPS Growth (%) | 157.1% | -6.8% | 11.4% | 21.0% | 7.0% | 11.2% | 14.0% | 30.7% | |
| EPS Analysts (#) | 0 | 0 | 0 | 0 | 0 | 0 | 27 | 27 |
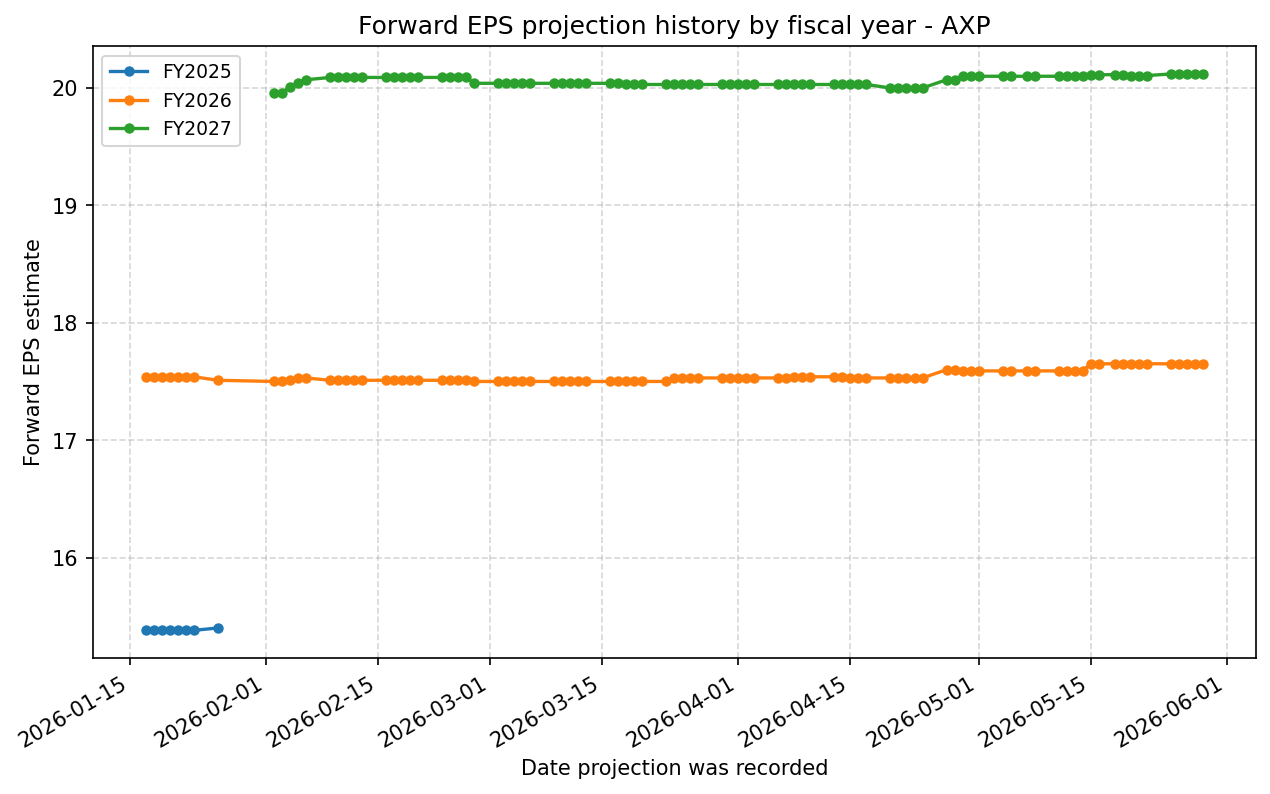
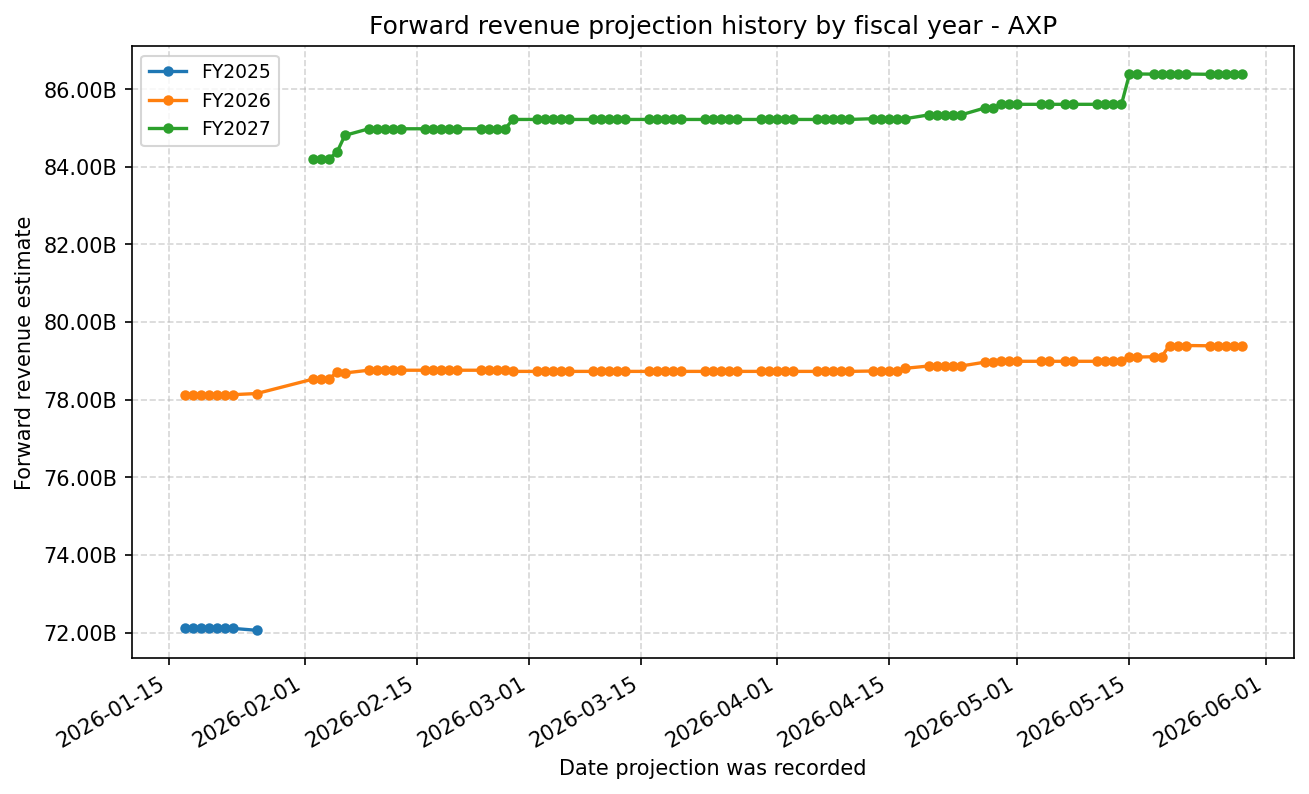
Forward Estimate History
How the next-FY EPS and revenue estimates have drifted over time. One line per fiscal year – past lines end when that FY became current.
Expenses
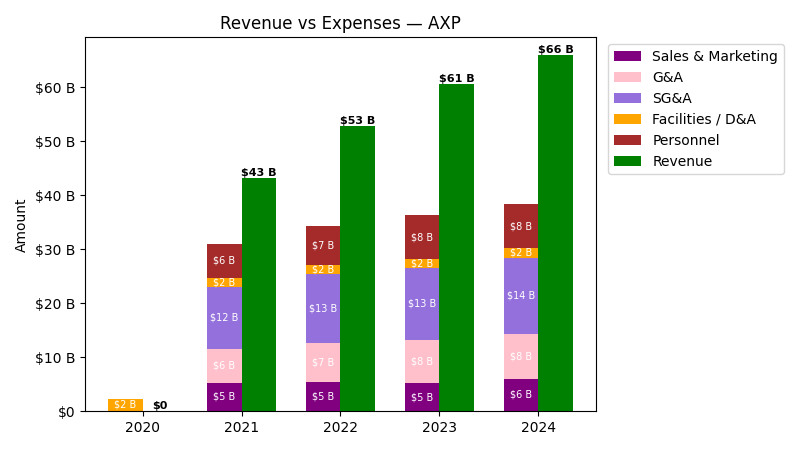
| Year | Revenue ($) | Sales & Marketing ($) | G&A ($) | SG&A ($) | Facilities / D&A ($) | Personnel ($) |
|---|---|---|---|---|---|---|
| 2022 | $52.9B | $5.5B | $7.3B | $12.7B | $1.6B | $7.3B |
| 2023 | $60.5B | $5.2B | $8.1B | $13.3B | $1.7B | $8.1B |
| 2024 | $65.9B | $6.0B | $8.2B | $14.2B | $1.7B | $8.2B |
| 2025 | $72.2B | $6.3B | $9.0B | $15.3B | $1.8B | $9.0B |
| TTM | $74.2B | $6.2B | $9.4B | $15.6B | $1.8B | $9.4B |
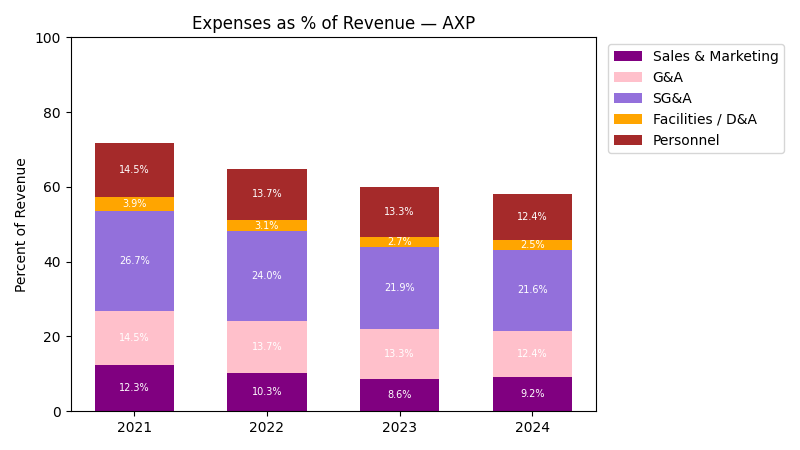
| Year | Revenue Change (%) | Sales & Marketing Change (%) | G&A Change (%) | SG&A Change (%) | Facilities / D&A Change (%) | Personnel Change (%) |
|---|---|---|---|---|---|---|
| 2023 | 14.48 | -4.49 | 11.24 | 4.48 | 1.54 | 11.24 |
| 2024 | 8.98 | 15.86 | 1.62 | 7.21 | 1.51 | 1.62 |
| 2025 | 9.52 | 3.51 | 9.98 | 7.23 | 6.03 | 9.98 |
| TTM | 2.69 | -0.10 | 4.02 | 2.33 | 1.97 | 4.02 |
No unmapped expenses.
Segment Performance
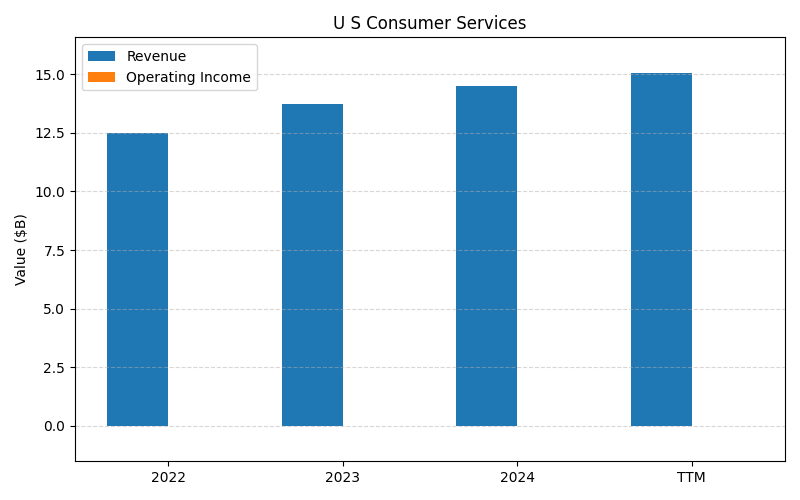
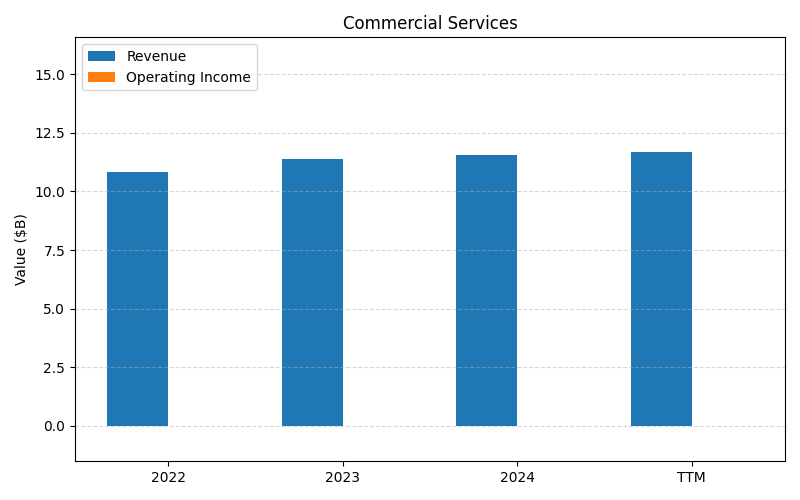
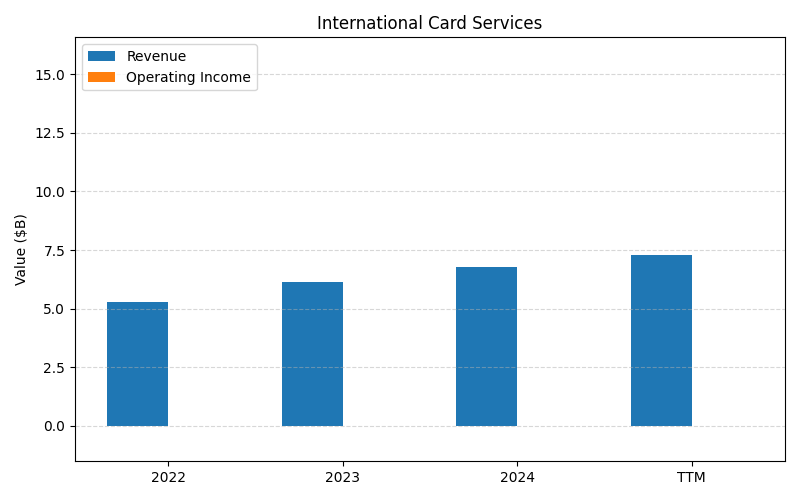
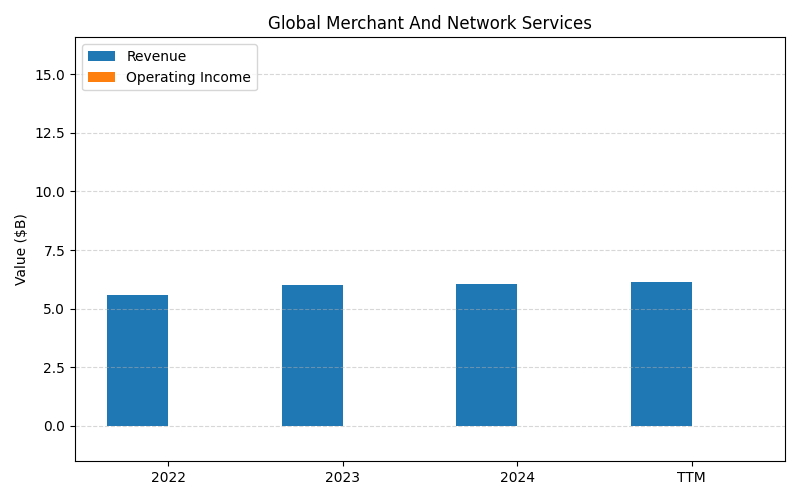
SEGMENTS v2025-09-09 · 2026-05-29 09:05 UTC — Units: $B. Rows list fiscal years (last 3 + TTM) with revenue for each segment; the final row shows the TTM revenue mix (operating income columns display “—” where mix is not applicable).
| Year | U S Consumer Services Rev | Commercial Services Rev | International Card Services Rev | Global Merchant And Network Services Rev | Total Rev |
|---|---|---|---|---|---|
| 2023 | 13.7B | 11.4B | 6.16B | 6.01B | 37.3B |
| 2024 | 14.5B | 11.6B | 6.77B | 6.05B | 38.9B |
| 2025 | 15.6B | 11.9B | 7.54B | 6.31B | 41.3B |
| TTM | 37.7B | 29.2B | 18B | 15.5B | 100.4B |
| % of Total (TTM) | 37.6% | 29.1% | 17.9% | 15.4% | 100% |
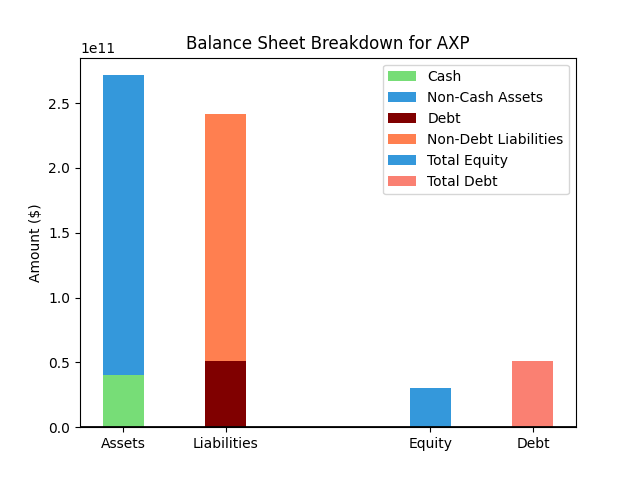
Balance Sheet
| Metric | Value | |
|---|---|---|
| 0 | Total Assets | $308,894M |
| 1 | Cash | $53,647M |
| 2 | Total Liabilities | $274,899M |
| 3 | Total Debt | $60,442M |
| 4 | Total Equity | $33,995M |
| 5 | Debt to Equity Ratio | 1.78 |
EPS & Dividend
Valuation
| Share Price | Treasury Yield | Estimates | Fair Value (P/E) | Fair Value (P/S) | Current P/S | Current P/E |
|---|---|---|---|---|---|---|
| $316.47 | 4.5% | Nicks Growth: 9% Nick's Expected Margin: 14% FINVIZ Growth: 14% |
Nicks: 16 Finviz: 26 |
Nick's: 2.184 | 2.9 | 19.8 |
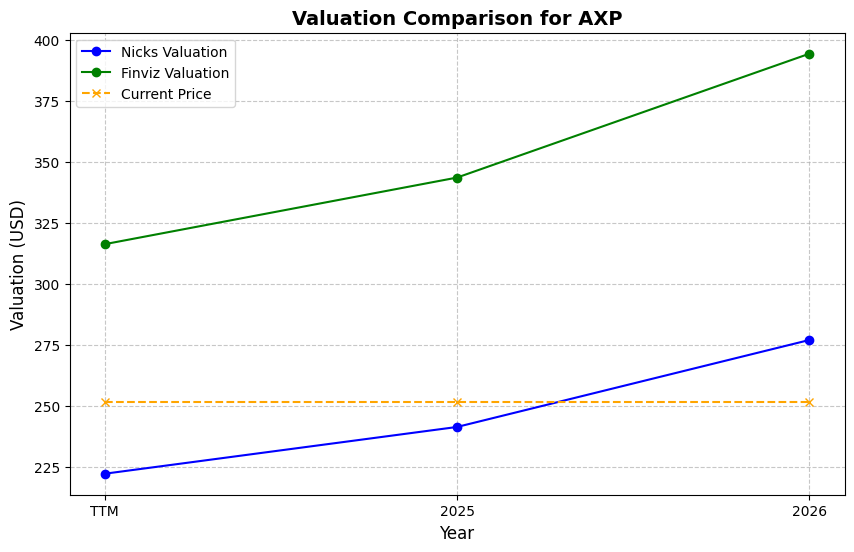
| Basis | Year | Nicks Valuation | Nicks vs Share Price | Finviz Valuation | Finviz vs Share Price |
|---|---|---|---|---|---|
| $16.01 EPS | TTM | $249.75 | -21.1% | $413.64 | 30.7% |
| $17.65 EPS | 2026 | $275.34 | -13.0% | $456.01 | 44.1% |
| $20.12 EPS | 2027 | $313.86 | -0.8% | $519.82 | 64.3% |
Implied Growth
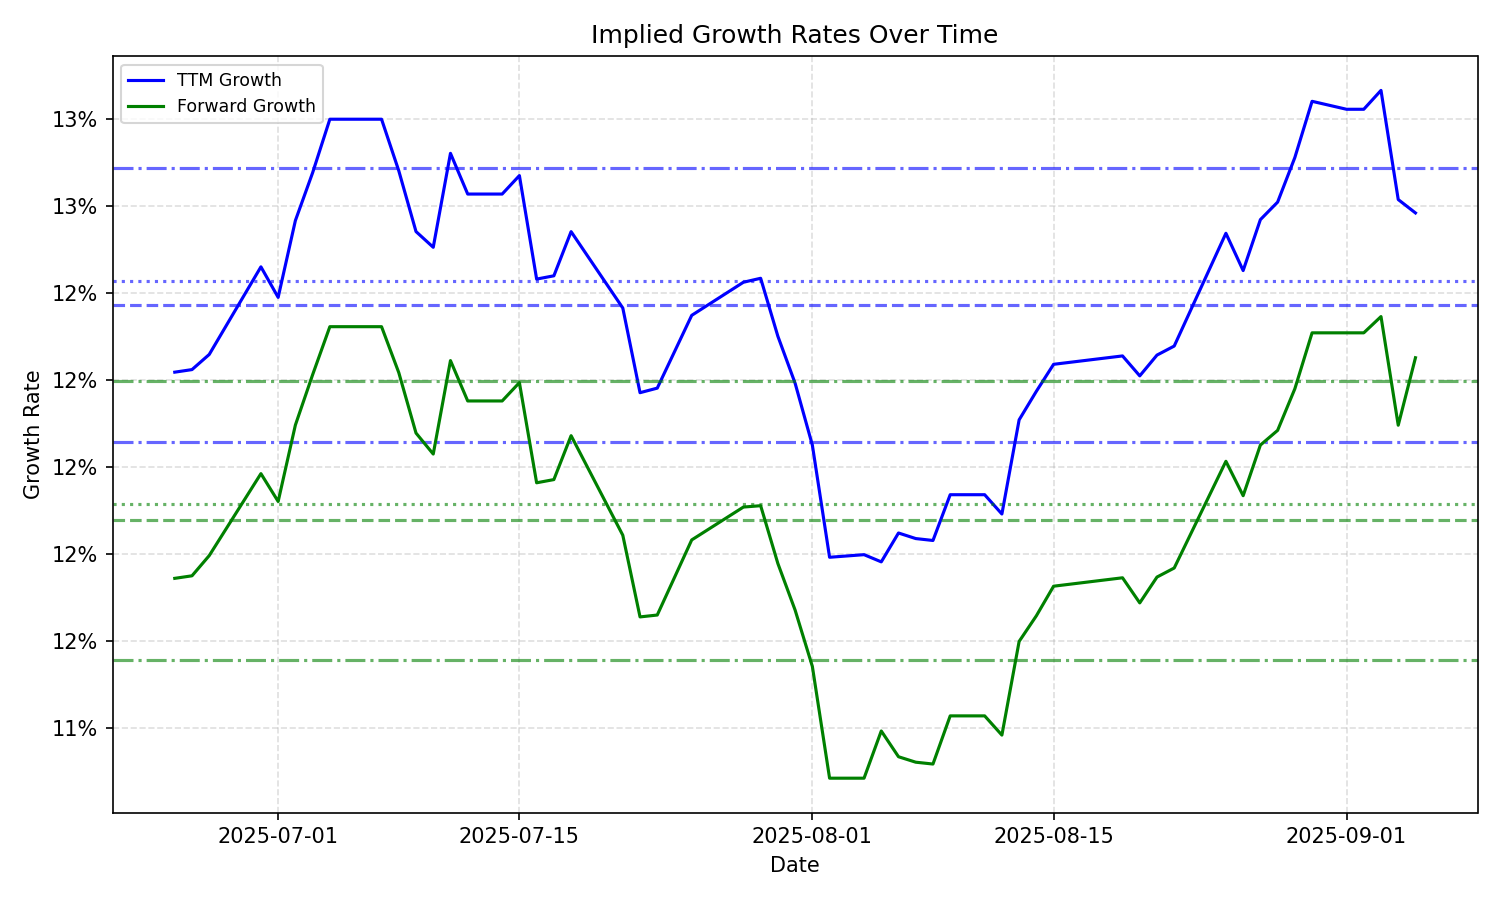
| Average | Median | Std Dev | Current | Percentile | ||||||
|---|---|---|---|---|---|---|---|---|---|---|
| TTM | Forward | TTM | Forward | TTM | Forward | TTM | Forward | TTM | Forward | |
| Timeframe | ||||||||||
| 1 Year | 12.53% | 11.15% | 12.67% | 11.90% | 0.84% | 1.67% | 11.46% | 9.04% | 17.8% | 20.3% |
| 3 Years | 12.53% | 11.15% | 12.67% | 11.90% | 0.84% | 1.67% | 11.46% | 9.04% | 17.8% | 20.3% |
| 5 Years | 12.53% | 11.15% | 12.67% | 11.90% | 0.84% | 1.67% | 11.46% | 9.04% | 17.8% | 20.3% |
| 10 Years | 12.53% | 11.15% | 12.67% | 11.90% | 0.84% | 1.67% | 11.46% | 9.04% | 17.8% | 20.3% |