Broadcom Inc. — AVGO
| Close Price | Market Cap | P/E Ratio | Forward P/E Ratio | Implied Growth* | Implied Forward Growth* | Dividend | P/B Ratio |
|---|---|---|---|---|---|---|---|
| $446.77 | $2.12T | 87.3 | 24.2 | 28.6% | 13.7% | $2.60 0.6% | 26.5 |
Latest Headlines
- · Dow Jones Futures: Market Hits Highs On Iran Hopes; Nvidia, Tesla Lead 5 Trillion-Dollar Stocks Near Buy Points
- · 'Volatility equals opportunity' in options trades as tech soars
- · Broadcom (AVGO) is Among Claude AI’s Top Stock Picks for 2026
- · Best AI Stocks to Buy in June and Hold Forever: AVGO
- · Is Sandisk a Millionaire-Maker Stock?
- · Anthropic's $36 Billion AI Chip Deal Draws Apollo, Blackstone
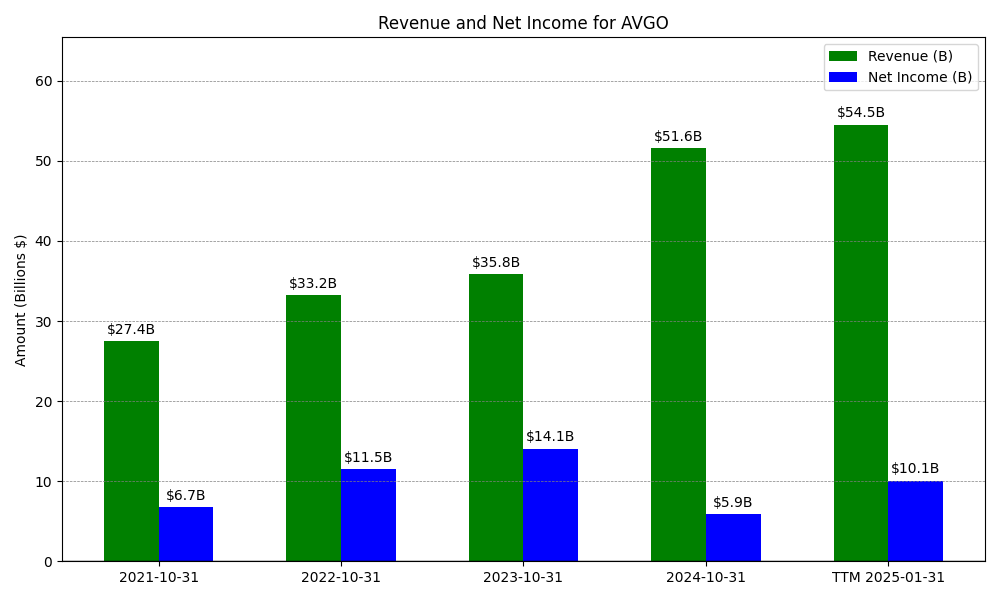
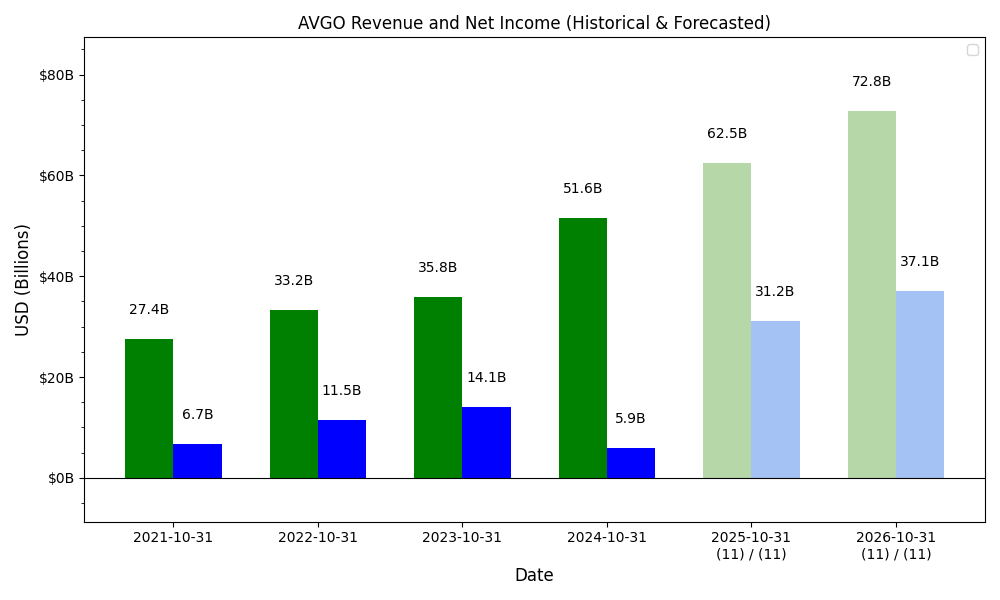
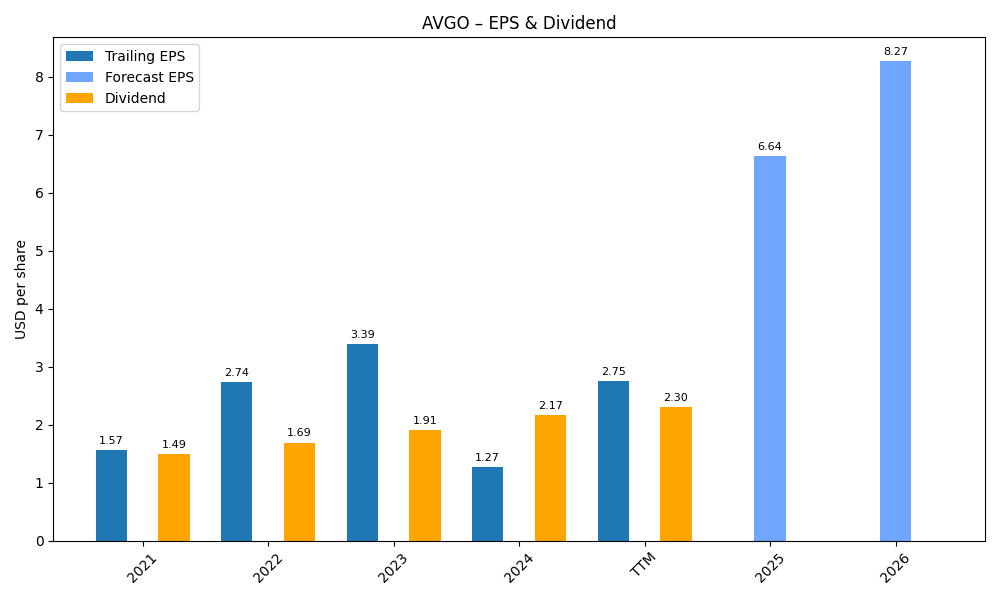
Revenue & Net Income
| Date | Revenue | Net_Income | EPS | Last_Updated | Revenue_Change | Net_Income_Change | EPS_Change | |
|---|---|---|---|---|---|---|---|---|
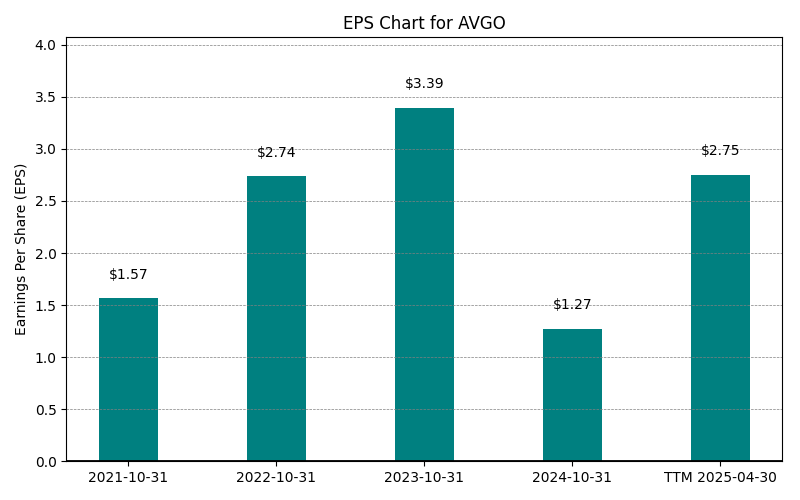
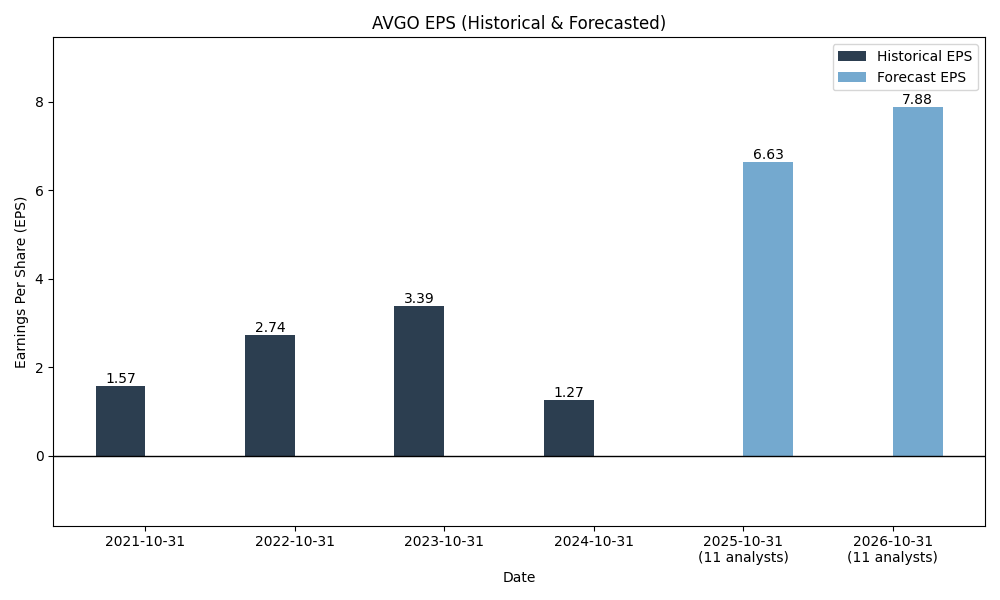
| 0 | 2021-10-31 | $27,450M | $6,736M | $1.57 | 2025-05-19 00:10:07 | N/A | N/A | N/A |
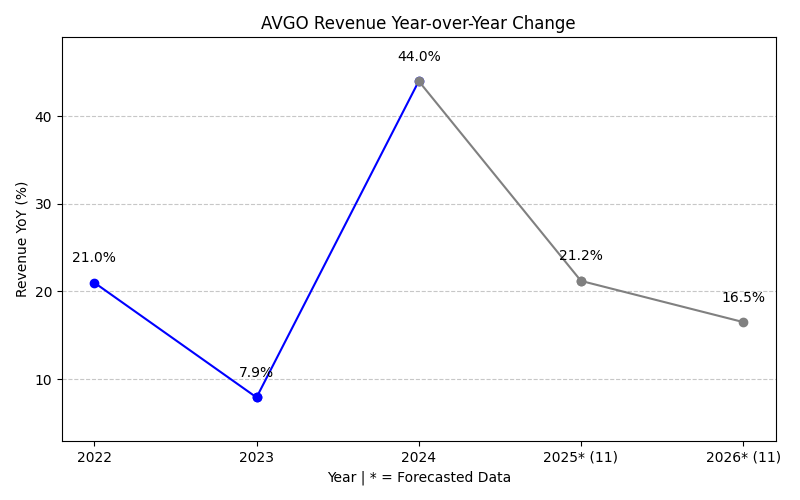
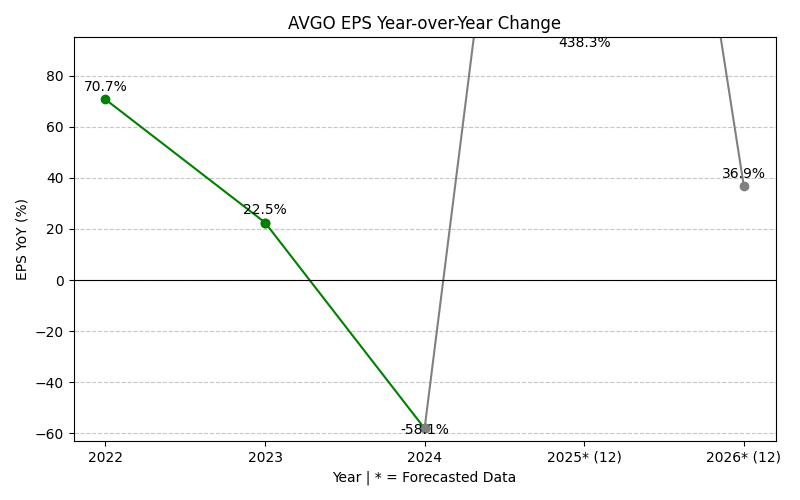
| 1 | 2022-10-31 | $33,203M | $11,495M | $2.74 | 2026-05-29 09:04:48 | 21.0% | 70.7% | 75.2% |
| 2 | 2023-10-31 | $35,819M | $14,082M | $3.39 | 2026-05-29 09:04:48 | 7.9% | 22.5% | 23.7% |
| 3 | 2024-10-31 | $51,574M | $5,895M | $1.27 | 2026-05-29 09:04:48 | 44.0% | -58.1% | -62.6% |
| 4 | 2025-10-31 | $63,887M | $23,126M | $4.91 | 2026-05-29 09:04:48 | 23.9% | 292.3% | 286.6% |
| 5 | TTM 2026-01-31 | $68,282M | $24,972M | $5.12 | 2026-03-10 08:31:31 | 6.9% | 8.0% | 4.3% |
EPS
Forecasts
Y/Y % Change
AVGO Year-over-Year Growth
| 2021 | 2022 | 2023 | 2024 | 2025 | 2026 | 2027 | Average | |
|---|---|---|---|---|---|---|---|---|
| Revenue Growth (%) | 21.0% | 7.9% | 44.0% | 23.9% | 61.3% | 55.2% | 35.6% | |
| Revenue Analysts (#) | 0 | 0 | 0 | 0 | 0 | 44 | 47 | |
| EPS Growth (%) | 70.7% | 22.5% | -58.1% | 292.3% | 132.4% | 62.0% | 87.0% | |
| EPS Analysts (#) | 0 | 0 | 0 | 0 | 0 | 43 | 42 |
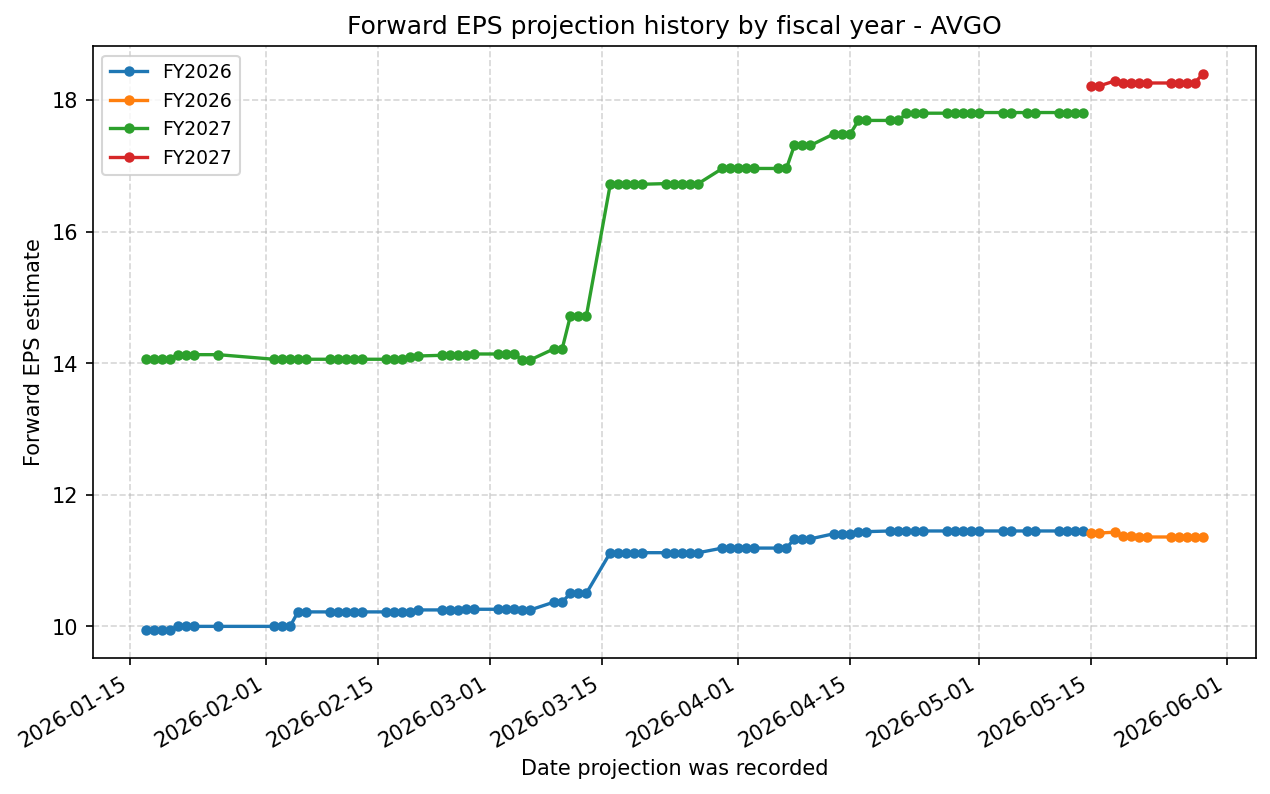
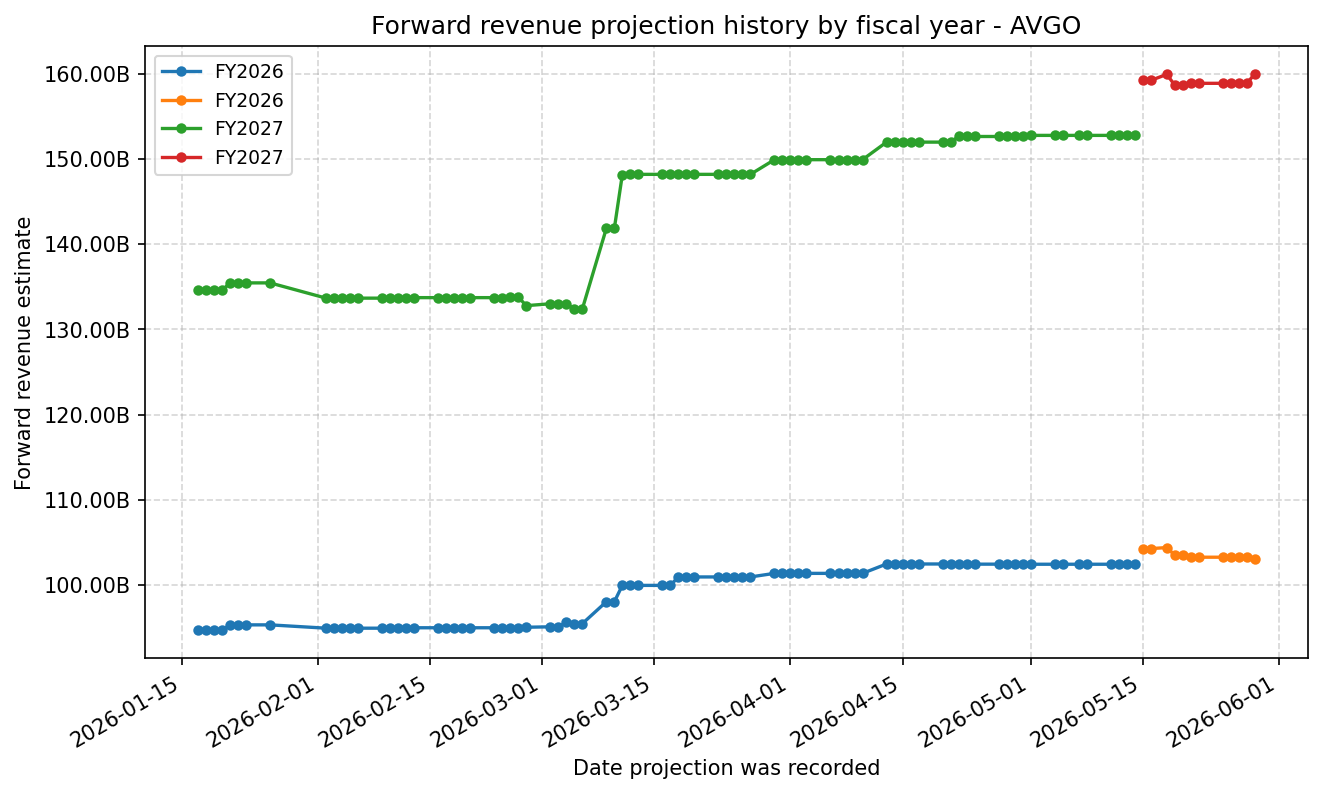
Forward Estimate History
How the next-FY EPS and revenue estimates have drifted over time. One line per fiscal year – past lines end when that FY became current.
Expenses
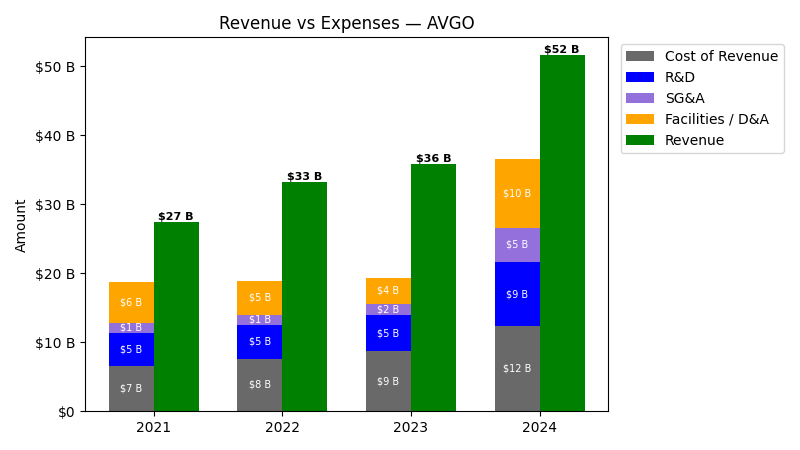
| Year | Revenue ($) | Cost of Revenue ($) | R&D ($) | SG&A ($) | Facilities / D&A ($) |
|---|---|---|---|---|---|
| 2022 | $33.2B | $2.7B | $4.9B | $1.4B | $5.0B |
| 2023 | $35.8B | $4.9B | $5.3B | $1.6B | $3.8B |
| 2024 | $51.6B | $2.3B | $9.3B | $5.0B | $10.0B |
| 2025 | $63.9B | $5.1B | $11.0B | $4.2B | $8.8B |
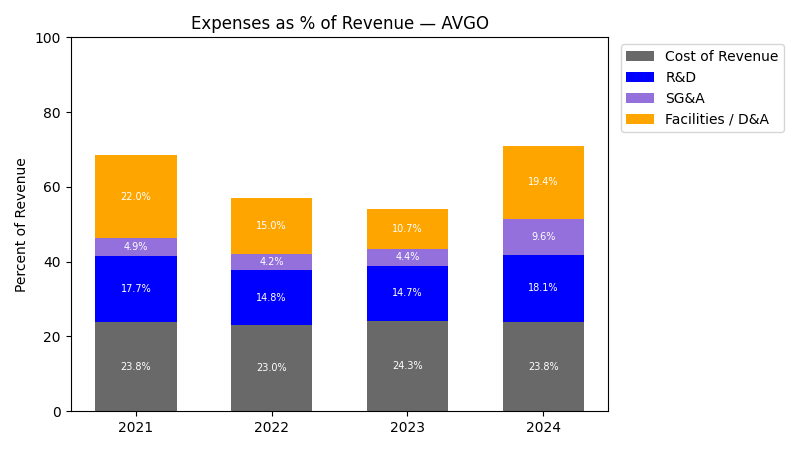
| Year | Revenue Change (%) | Cost of Revenue Change (%) | R&D Change (%) | SG&A Change (%) | Facilities / D&A Change (%) |
|---|---|---|---|---|---|
| 2023 | 7.88 | 82.99 | 6.79 | 15.20 | -23.05 |
| 2024 | 43.99 | -52.83 | 77.23 | 211.49 | 161.02 |
| 2025 | 23.87 | 121.67 | 17.91 | -15.08 | -12.34 |
No unmapped expenses.
Segment Performance
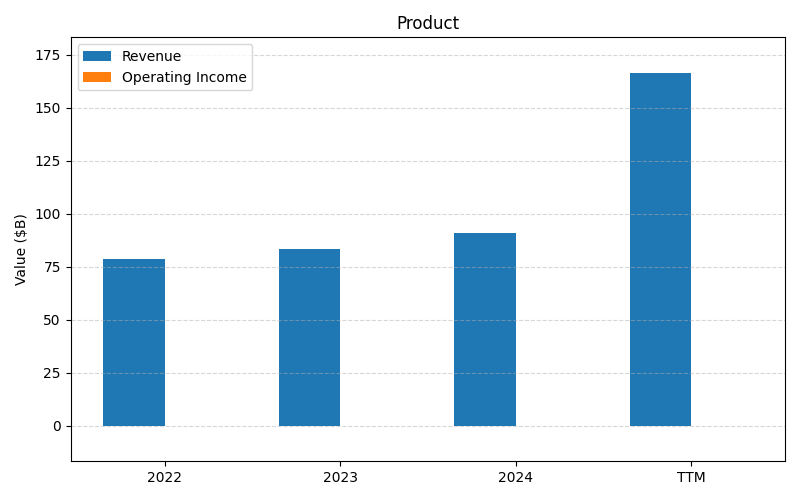
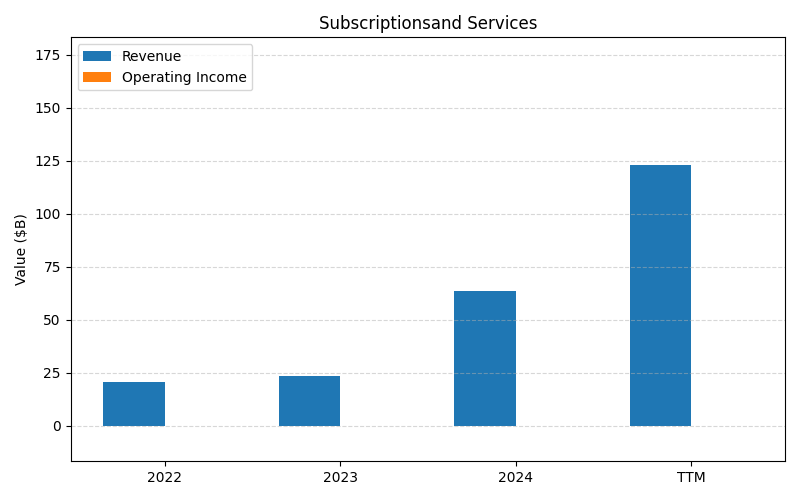
SEGMENTS v2025-09-09 · 2026-05-29 09:04 UTC — Units: $B. Rows list fiscal years (last 3 + TTM) with revenue for each segment; the final row shows the TTM revenue mix (operating income columns display “—” where mix is not applicable).
| Year | Prod Rev | Subscriptionsand Services Rev | Total Rev |
|---|---|---|---|
| 2023 | 86.8B | 20.6B | 107.5B |
| 2024 | 104.9B | 49.8B | 154.7B |
| 2025 | 134.5B | 57.1B | 191.7B |
| TTM | 312.2B | 136.8B | 449.1B |
| % of Total (TTM) | 69.5% | 30.5% | 100% |
Segment Performance (Axis 2)
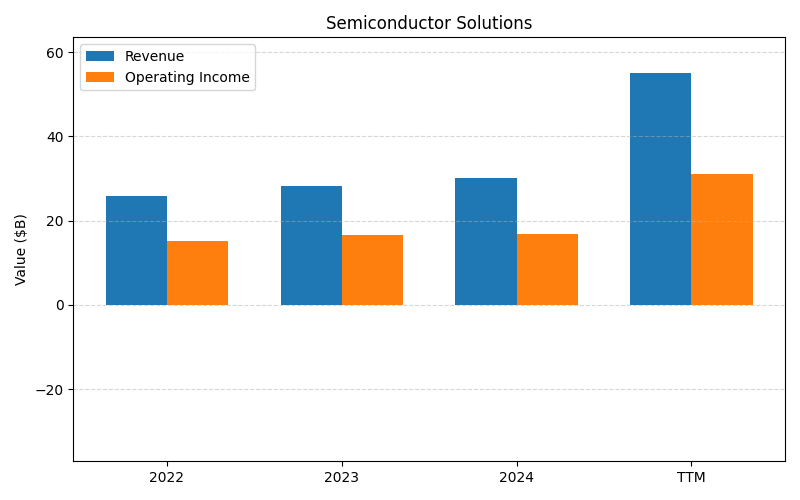
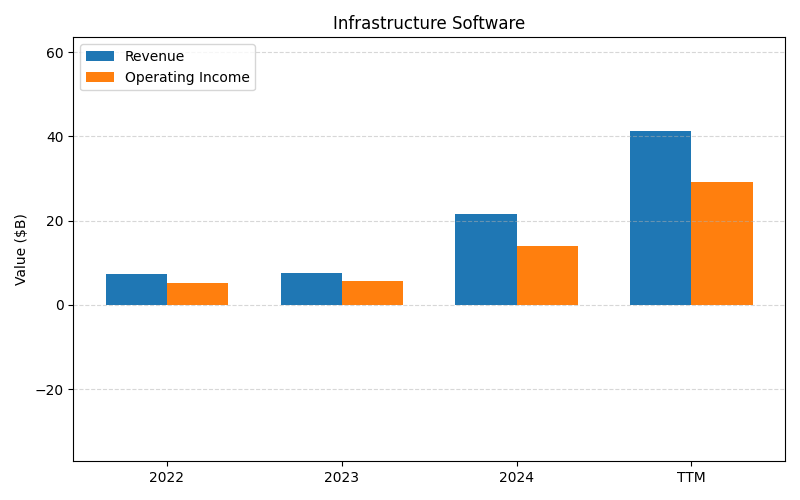
SEGMENTS v2025-09-09 · 2026-05-29 09:04 UTC — Units: $B. Rows list fiscal years (last 3 + TTM) with revenue and operating income for each segment; the final row shows the TTM revenue mix (operating income columns display “—” where mix is not applicable).
| Year | Semiconductor Solutions Rev | Semiconductor Solutions OI | Infrastructure Software Rev | Infrastructure Software OI | Total Rev | Total OI |
|---|---|---|---|---|---|---|
| 2023 | 28.2B | 16.5B | 7.64B | 5.64B | 35.8B | 22.1B |
| 2024 | 30.1B | 16.8B | 21.5B | 14B | 51.6B | 30.7B |
| 2025 | 36.9B | 21.2B | 27B | 20.8B | 63.9B | 42B |
| TTM | 87.7B | 50.2B | 62B | 45.2B | 149.7B | 95.4B |
| % of Total (TTM) | 58.6% | — | 41.4% | — | 100% | — |
Balance Sheet
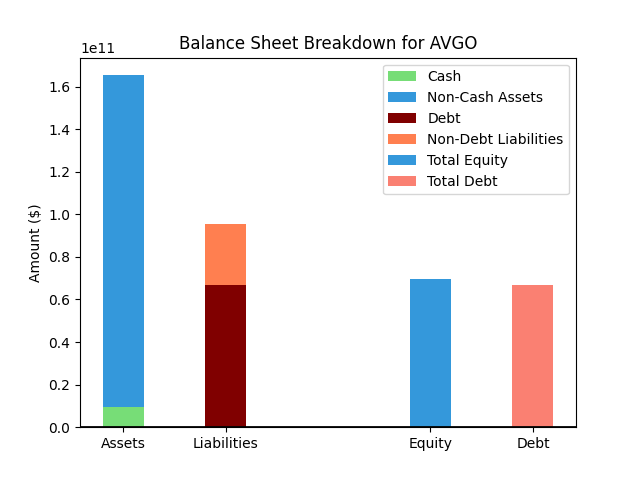
| Metric | Value | |
|---|---|---|
| 0 | Total Assets | $169,903M |
| 1 | Cash | $14,174M |
| 2 | Total Liabilities | $90,031M |
| 3 | Total Debt | $66,057M |
| 4 | Total Equity | $79,872M |
| 5 | Debt to Equity Ratio | 0.83 |
EPS & Dividend
Valuation
| Share Price | Treasury Yield | Estimates | Fair Value (P/E) | Fair Value (P/S) | Current P/S | Current P/E |
|---|---|---|---|---|---|---|
| $446.77 | 4.5% | FINVIZ Growth: 50% | Nicks: 6 Finviz: 415 |
Nick's: 0.000 | 31.0 | 87.3 |
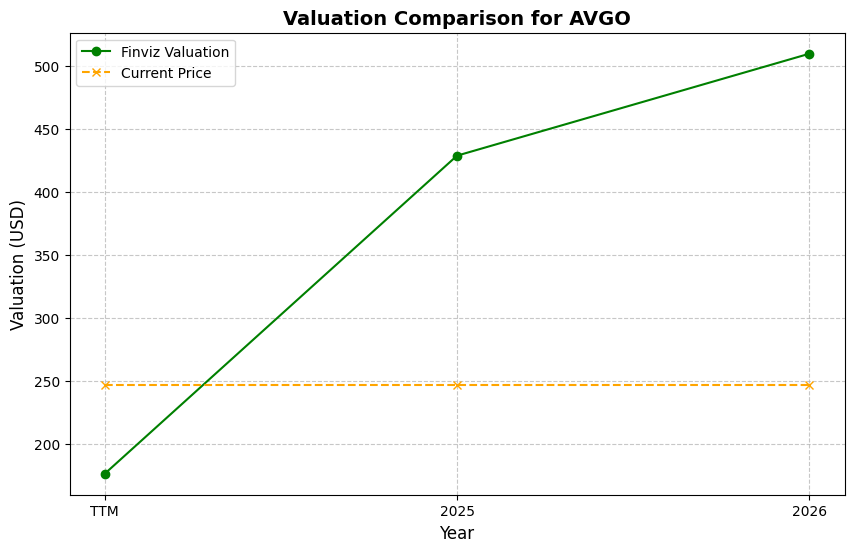
| Basis | Year | Nicks Valuation | Nicks vs Share Price | Finviz Valuation | Finviz vs Share Price |
|---|---|---|---|---|---|
| $5.12 EPS | TTM | $32.47 | -92.7% | $2123.50 | 375.3% |
| $11.35 EPS | 2026 | $71.99 | -83.9% | $4708.62 | 953.9% |
| $18.40 EPS | 2027 | $116.66 | -73.9% | $7629.83 | 1607.8% |
Implied Growth
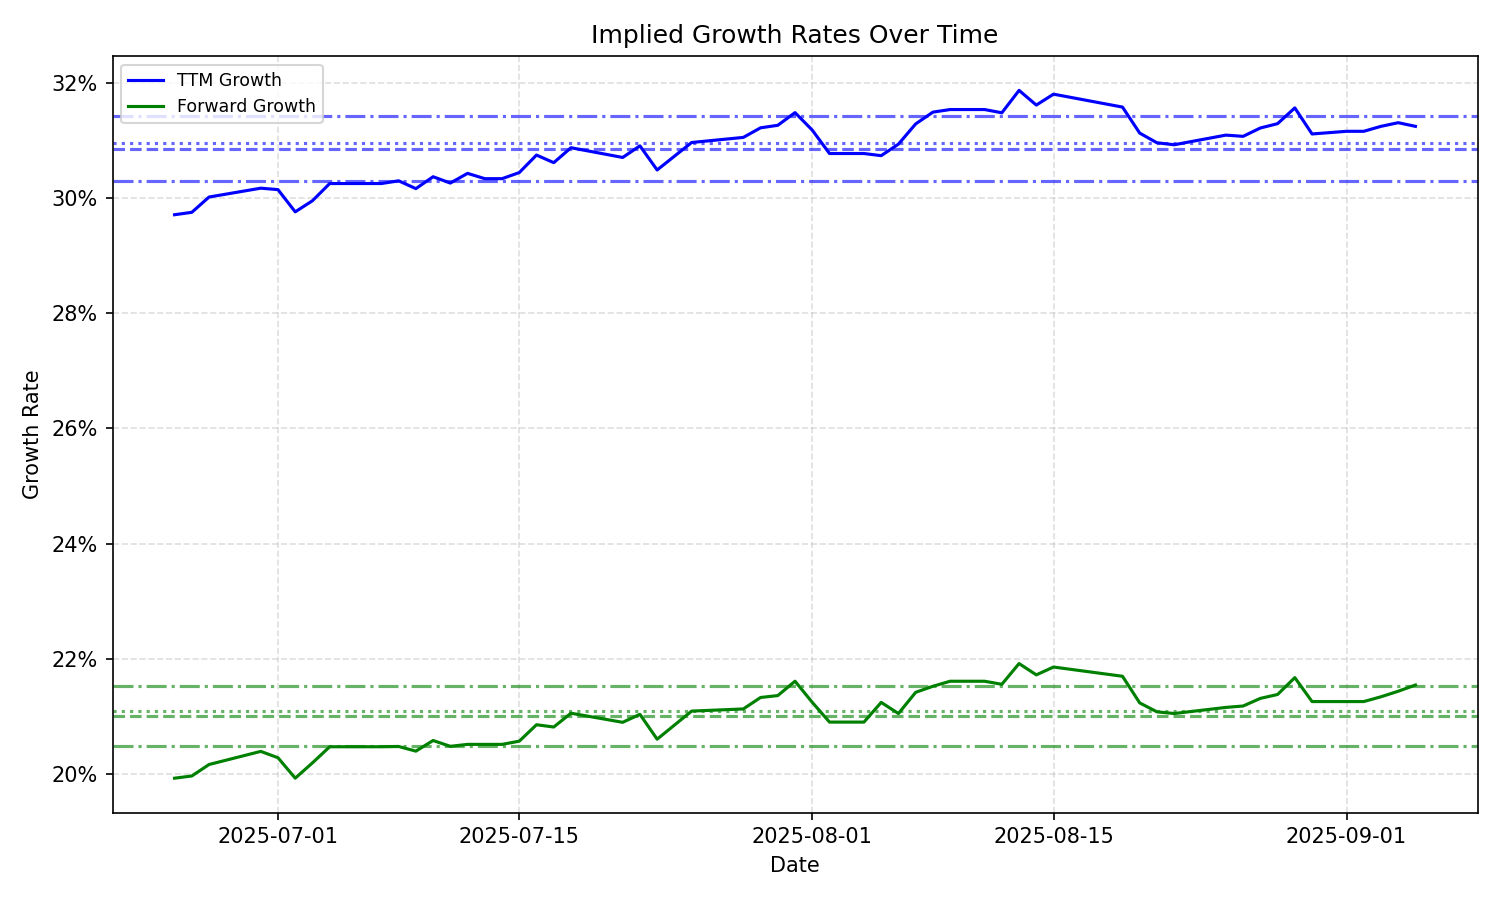
| Average | Median | Std Dev | Current | Percentile | ||||||
|---|---|---|---|---|---|---|---|---|---|---|
| TTM | Forward | TTM | Forward | TTM | Forward | TTM | Forward | TTM | Forward | |
| Timeframe | ||||||||||
| 1 Year | 28.07% | 17.85% | 28.21% | 20.48% | 2.23% | 5.01% | 28.07% | 13.23% | 45.1% | 32.1% |
| 3 Years | 28.07% | 17.85% | 28.21% | 20.48% | 2.23% | 5.01% | 28.07% | 13.23% | 45.1% | 32.1% |
| 5 Years | 28.07% | 17.85% | 28.21% | 20.48% | 2.23% | 5.01% | 28.07% | 13.23% | 45.1% | 32.1% |
| 10 Years | 28.07% | 17.85% | 28.21% | 20.48% | 2.23% | 5.01% | 28.07% | 13.23% | 45.1% | 32.1% |