Amazon.com, Inc. — AMZN
| Close Price | Market Cap | P/E Ratio | Forward P/E Ratio | Implied Growth* | Implied Forward Growth* | Dividend | P/B Ratio |
|---|---|---|---|---|---|---|---|
| $270.64 | $2.91T | 31.3 | 27.4 | 16.5% | 15.1% | - | 6.6 |
Latest Headlines
- · Amazon is Cutting Even More Jobs, Following the Mass Layoffs in January. Can It Maintain Its Cloud Dominance as Employees Exit?
- · Cash and Gift Cards Dominate Consumer Reward Preferences: Kashkick Survey of 224,000+ Aligns With $507B U.S. Gift Card Market
- · Blue Origin, NASA Suffer Setbacks After New Glenn Explosion. Space Stocks Dive.
- · Dow Jones Futures: Market Hits Highs On Iran Hopes; Nvidia, Tesla Lead 5 Trillion-Dollar Stocks Near Buy Points
- · Why Blue Origin Explosion Is Bad News for Amazon and These Space Stocks
- · Lenovo Stock Doubles in May on AI Server Boom—Best Month in 27 Years
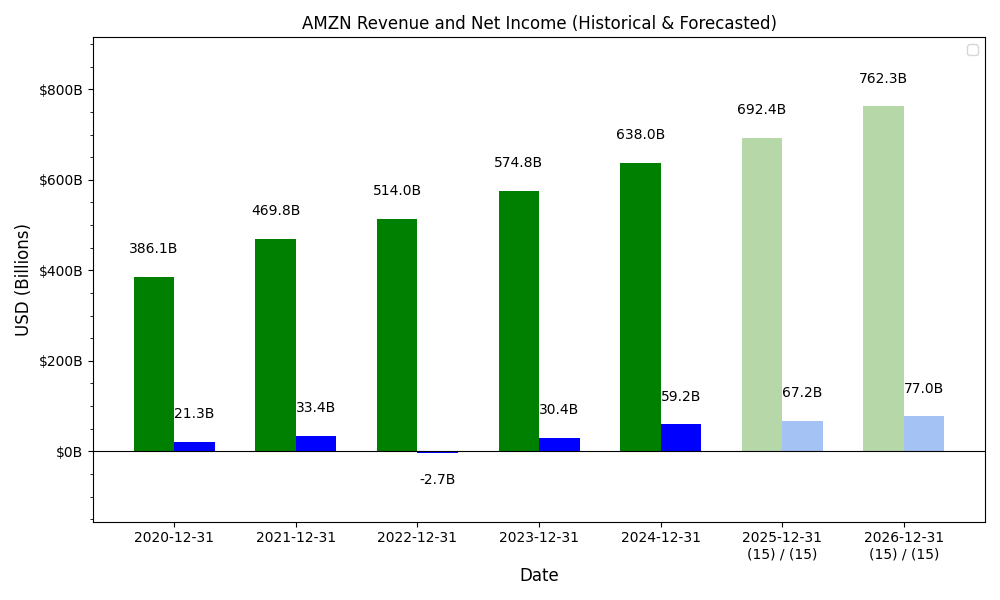
Revenue & Net Income
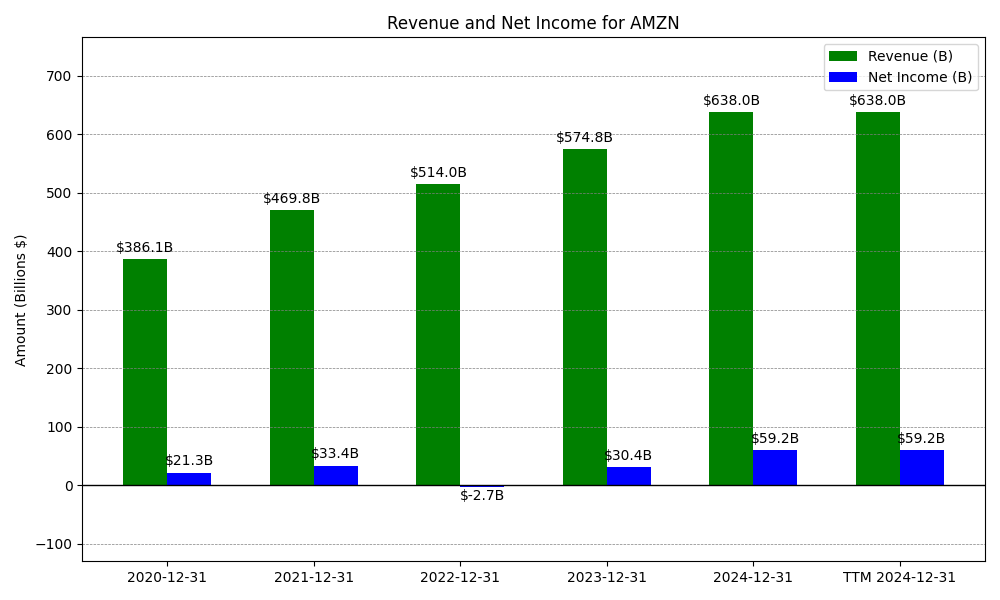
| Date | Revenue | Net_Income | EPS | Last_Updated | Revenue_Change | Net_Income_Change | EPS_Change | |
|---|---|---|---|---|---|---|---|---|
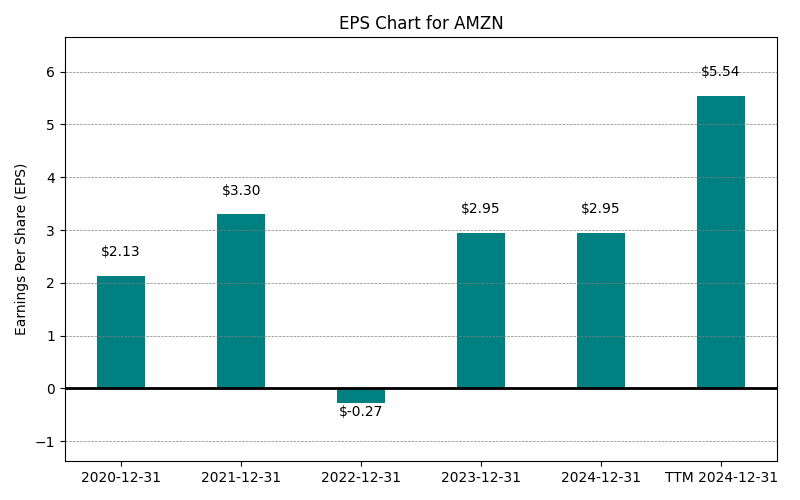
| 0 | 2020-12-31 | $386,064M | $21,331M | $2.13 | 2024-02-03 03:17:10 | N/A | N/A | N/A |
| 1 | 2021-12-31 | $469,822M | $33,364M | $-0.27 | 2026-02-09 08:39:22 | 21.7% | 56.4% | -112.7% |
| 2 | 2022-12-31 | $513,983M | $-2,722M | $-0.27 | 2026-05-29 09:04:42 | 9.4% | -108.2% | 0.0% |
| 3 | 2023-12-31 | $574,785M | $30,425M | $2.95 | 2026-05-29 09:04:42 | 11.8% | -1217.7% | -1192.6% |
| 4 | 2024-12-31 | $637,959M | $59,248M | $5.66 | 2026-05-29 09:04:42 | 11.0% | 94.7% | 91.9% |
| 5 | 2025-12-31 | $716,924M | $77,670M | $7.29 | 2026-05-29 09:04:42 | 12.4% | 31.1% | 28.8% |
| 6 | TTM 2026-03-31 | $742,776M | $90,798M | $8.66 | 2026-05-01 08:37:34 | 3.6% | 16.9% | 18.8% |
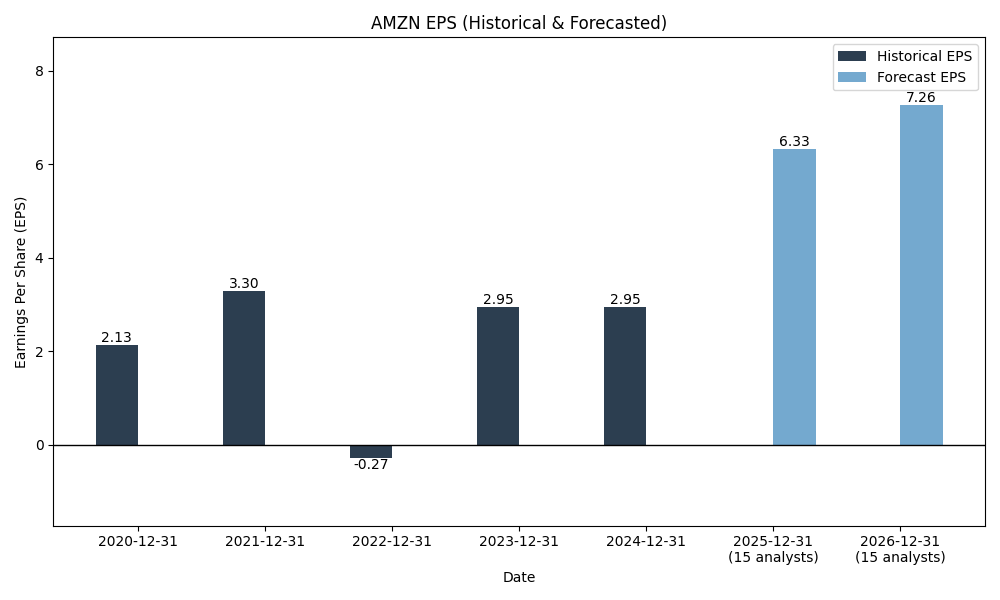
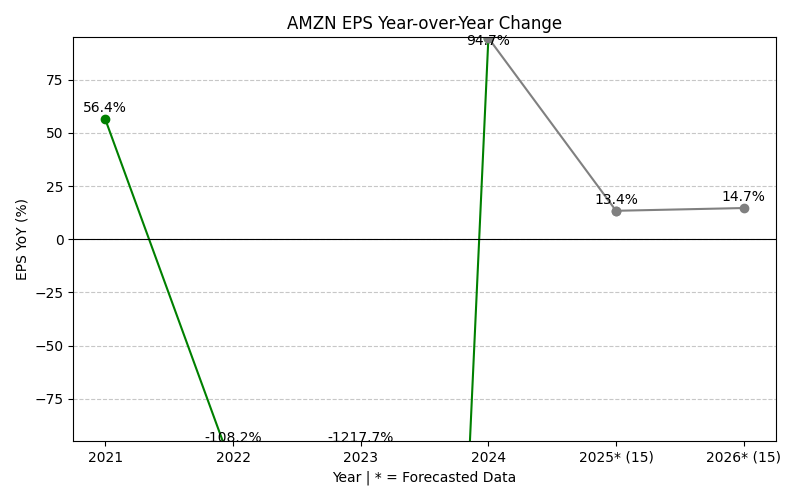
EPS
Forecasts
Y/Y % Change
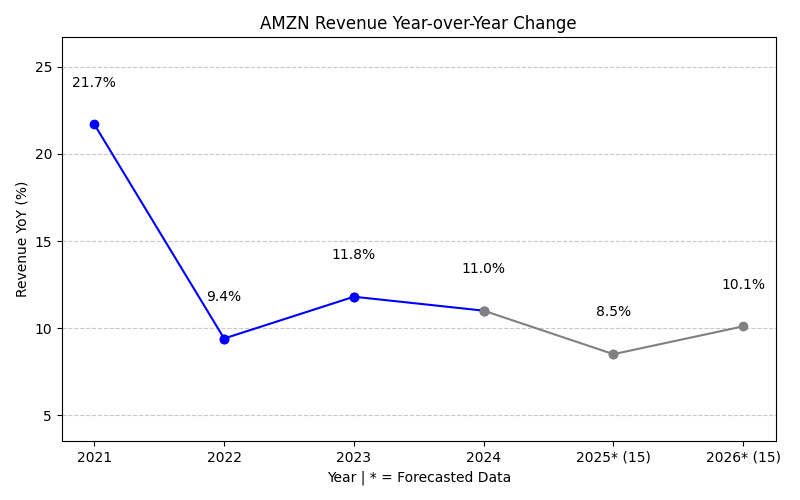
AMZN Year-over-Year Growth
| 2020 | 2021 | 2022 | 2023 | 2024 | 2025 | 2026 | 2027 | Average | |
|---|---|---|---|---|---|---|---|---|---|
| Revenue Growth (%) | 21.7% | 9.4% | 11.8% | 11.0% | 12.4% | 14.8% | 12.9% | 13.4% | |
| Revenue Analysts (#) | 0 | 0 | 0 | 0 | 0 | 0 | 61 | 62 | |
| EPS Growth (%) | 56.4% | -108.2% | -1217.7% | 94.7% | 31.1% | 19.7% | 14.0% | -158.6% | |
| EPS Analysts (#) | 0 | 0 | 0 | 0 | 0 | 0 | 58 | 56 |
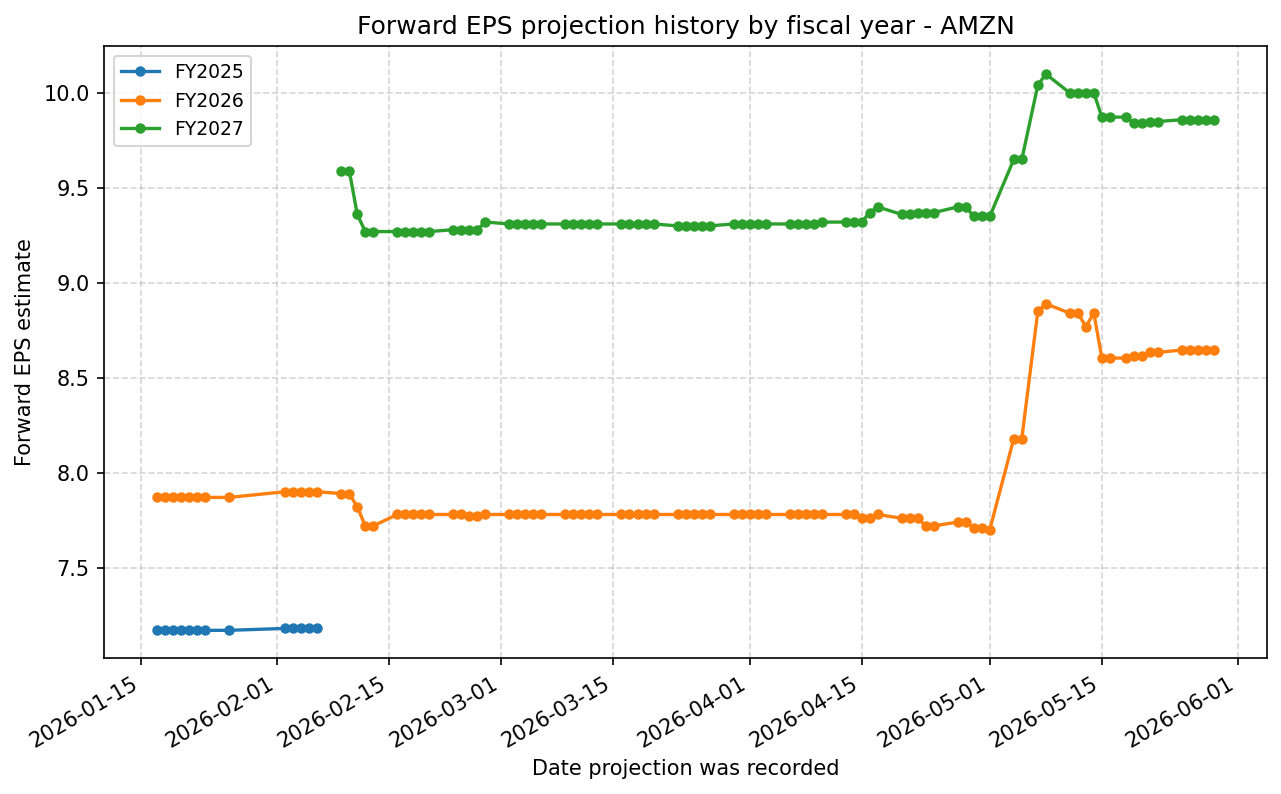
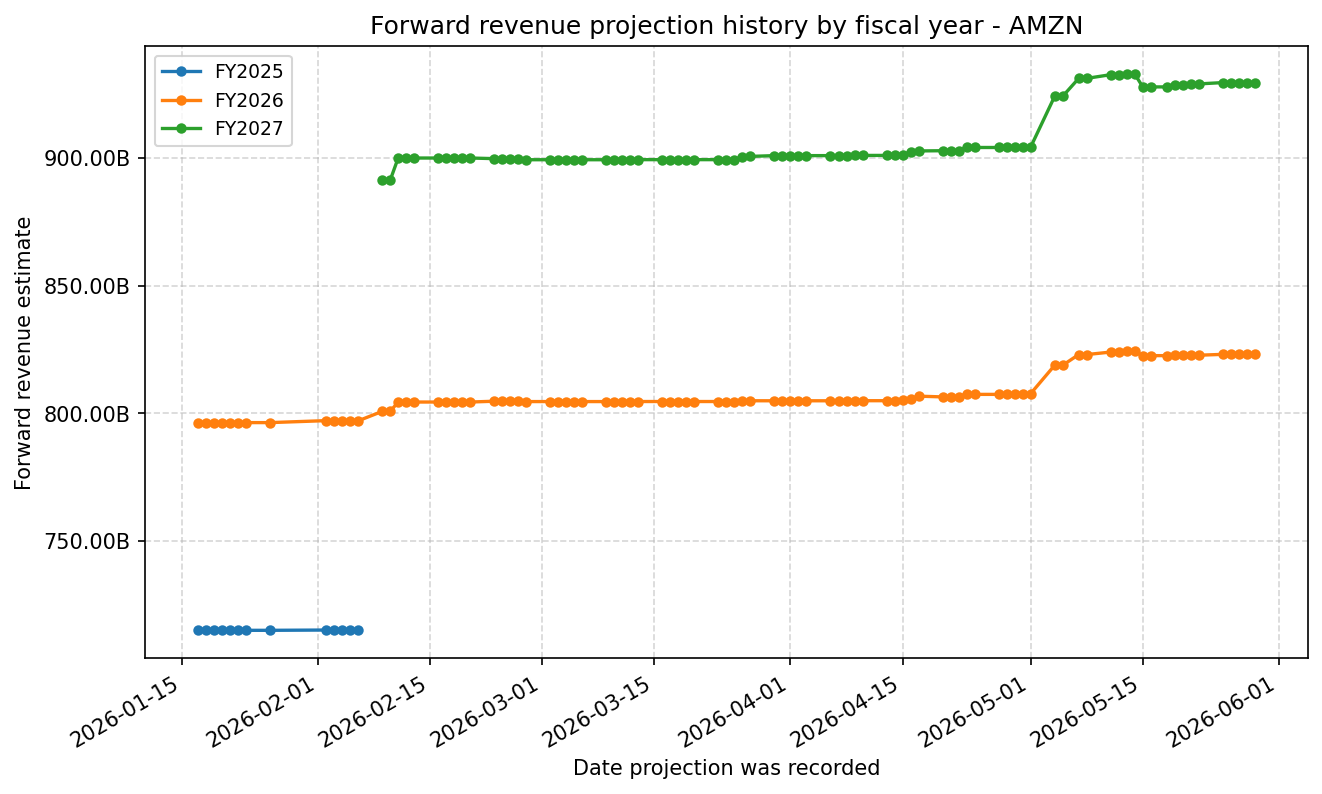
Forward Estimate History
How the next-FY EPS and revenue estimates have drifted over time. One line per fiscal year – past lines end when that FY became current.
Expenses
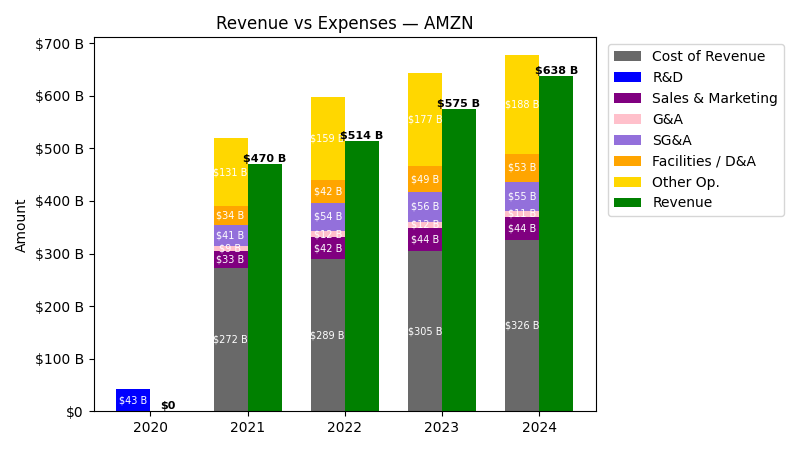
| Year | Revenue ($) | Cost of Revenue ($) | Sales & Marketing ($) | G&A ($) | SG&A ($) | Facilities / D&A ($) |
|---|---|---|---|---|---|---|
| 2021 | $469.8B | $237.9B | $32.6B | $8.8B | $41.4B | $34.4B |
| 2022 | $514.0B | $246.9B | $42.2B | $11.9B | $54.1B | $41.9B |
| 2023 | $574.8B | $256.1B | $44.4B | $11.8B | $56.2B | $48.7B |
| 2024 | $638.0B | $273.5B | $43.9B | $11.4B | $55.3B | $52.8B |
| 2025 | $716.9B | $290.7B | $47.1B | $11.2B | $58.3B | $65.8B |
| TTM | $742.8B | $296.5B | $47.7B | $11.1B | $58.8B | $70.4B |
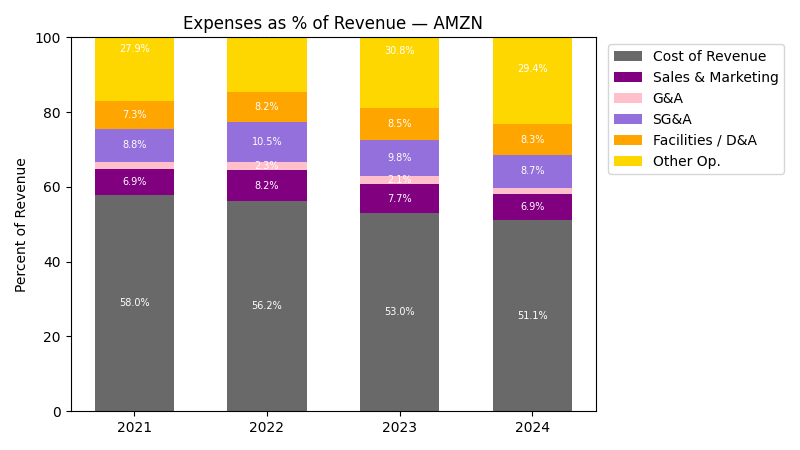
| Year | Revenue Change (%) | Cost of Revenue Change (%) | Sales & Marketing Change (%) | G&A Change (%) | SG&A Change (%) | Facilities / D&A Change (%) |
|---|---|---|---|---|---|---|
| 2022 | 9.40 | 3.78 | 29.76 | 34.77 | 30.83 | 21.75 |
| 2023 | 11.83 | 3.71 | 5.05 | -0.63 | 3.80 | 16.08 |
| 2024 | 10.99 | 6.80 | -1.04 | -3.87 | -1.64 | 8.49 |
| 2025 | 12.38 | 6.28 | 7.34 | -1.65 | 5.49 | 24.55 |
| TTM | 3.61 | 2.00 | 1.17 | -0.37 | 0.87 | 7.12 |
No unmapped expenses.
Segment Performance
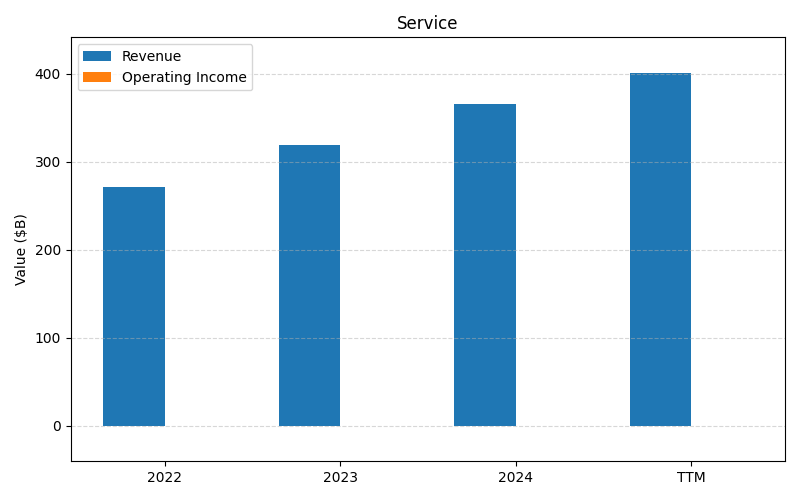
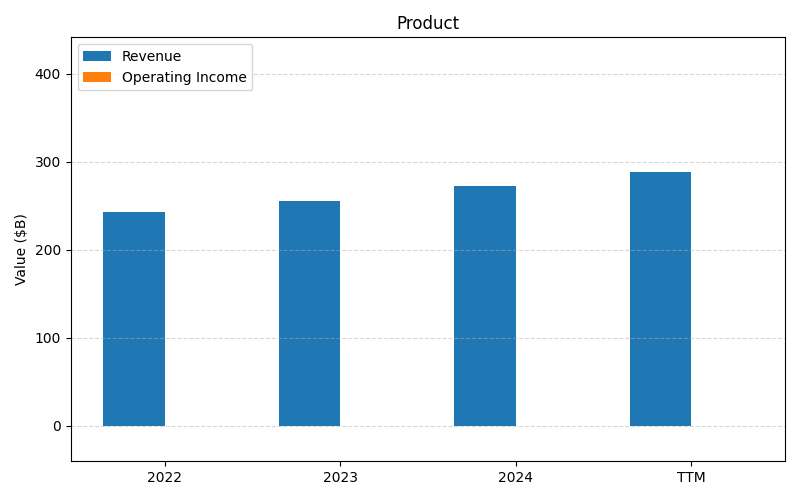
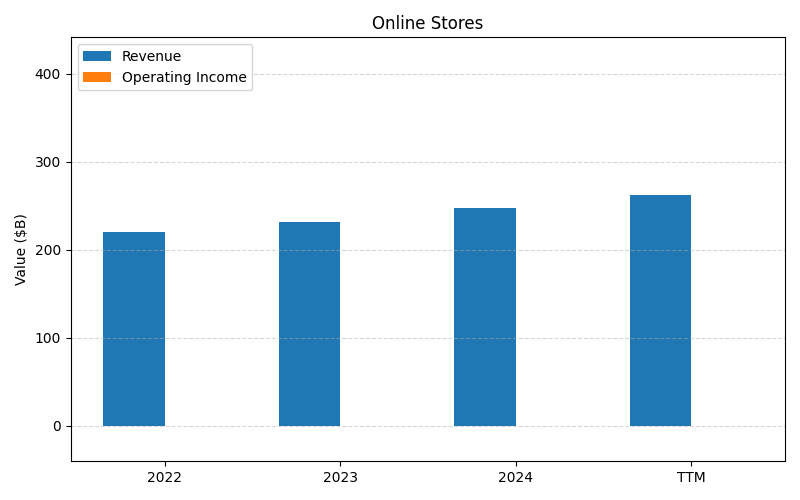
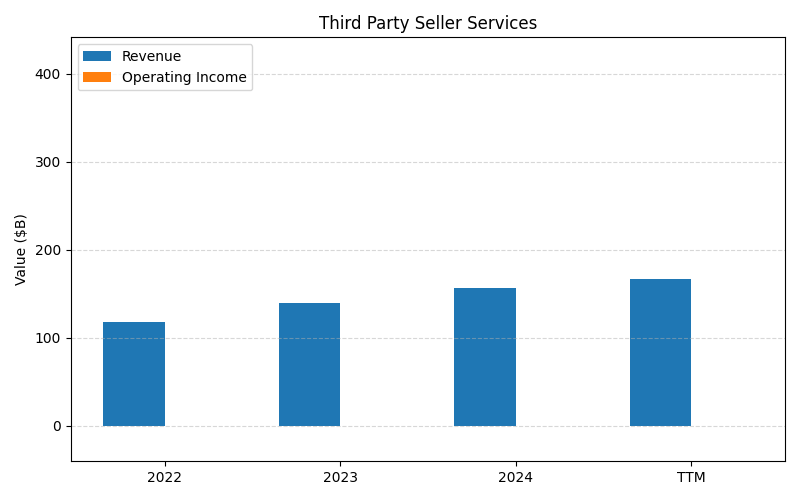
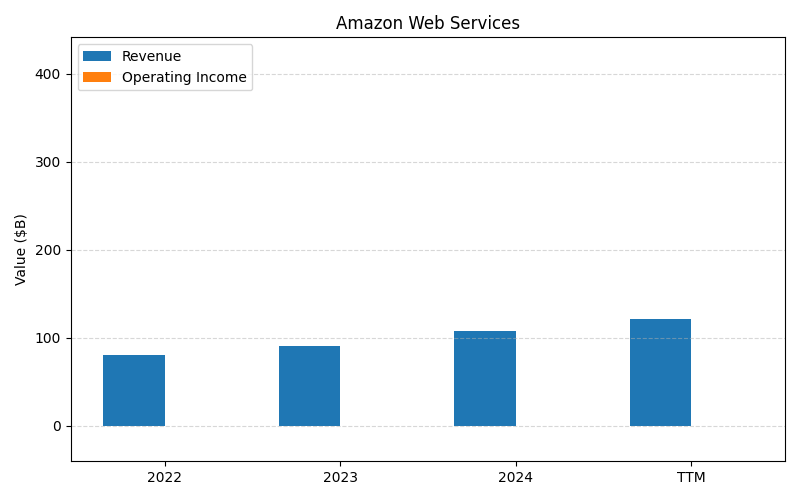
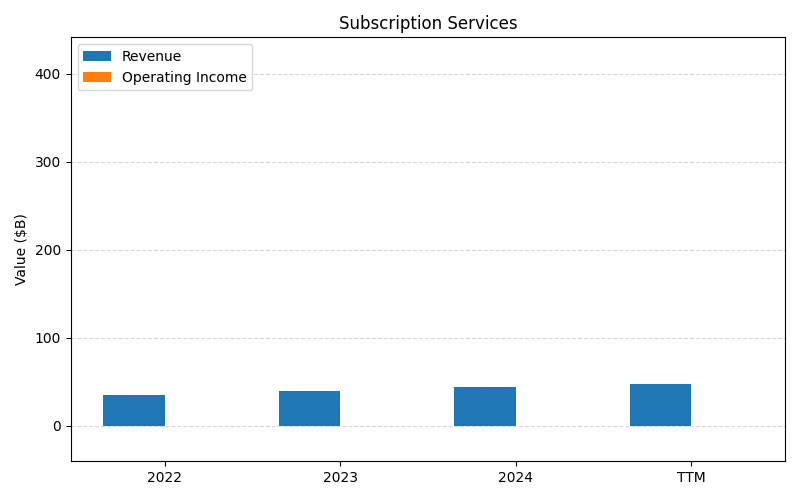
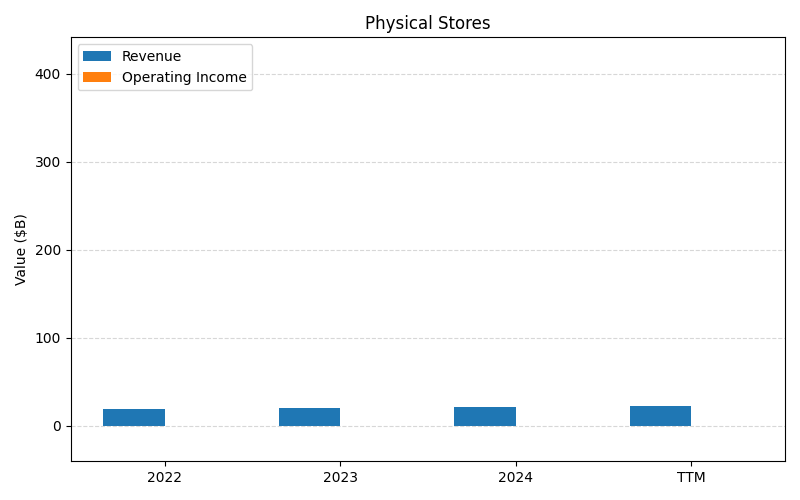
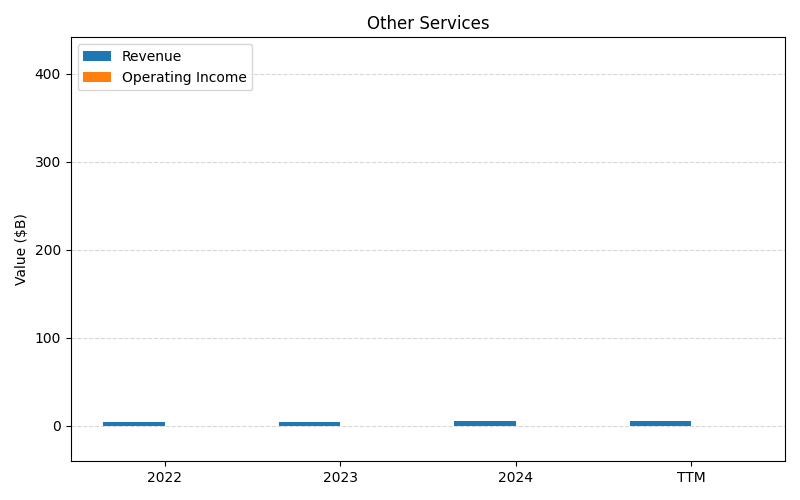
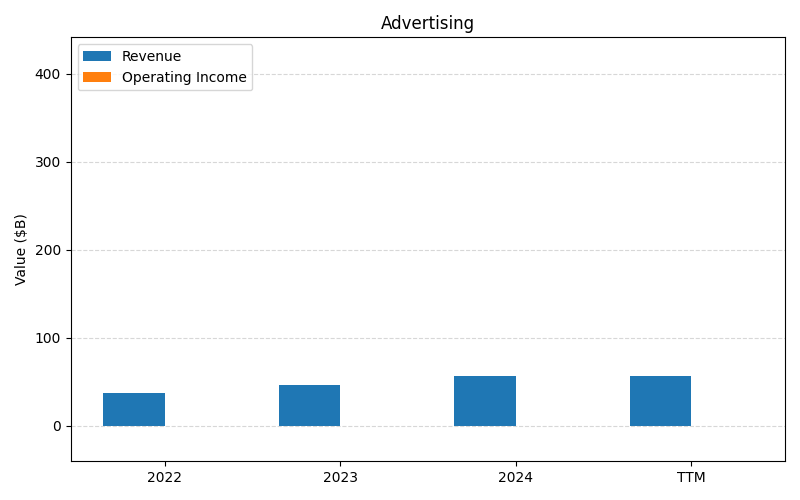
SEGMENTS v2025-09-09 · 2026-05-29 09:04 UTC — Units: $B. Rows list fiscal years (last 3 + TTM) with revenue for each segment; the final row shows the TTM revenue mix (operating income columns display “—” where mix is not applicable).
| Year | Services Rev | Prod Rev | Online Stores Rev | Third Party Seller Services Rev | Amazon Web Services Rev | Subscription Services Rev | Physical Stores Rev | Other Services Rev | Advertising Rev | Total Rev |
|---|---|---|---|---|---|---|---|---|---|---|
| 2023 | 318.9B | 255.9B | 231.9B | 140.1B | 90.8B | 40.2B | 20B | 4.96B | 46.9B | 1149.6B |
| 2024 | 365.6B | 272.3B | 247B | 156.1B | 107.6B | 44.4B | 21.2B | 5.42B | 56.2B | 1275.9B |
| 2025 | 420.7B | 296.3B | 269.3B | 172.2B | 128.7B | 49.6B | 22.6B | 5.93B | 68.6B | 1433.8B |
| TTM | 988.2B | 703.9B | 638B | 406.4B | 303.1B | 119.1B | 55.1B | 14.3B | – | 3228.1B |
| % of Total (TTM) | 30.6% | 21.8% | 19.8% | 12.6% | 9.4% | 3.7% | 1.7% | 0.4% | – | 100% |
Segment Performance (Axis 2)
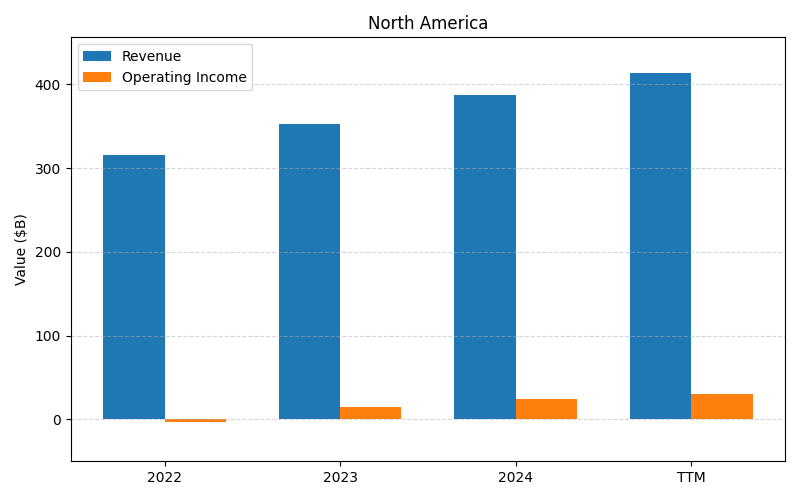
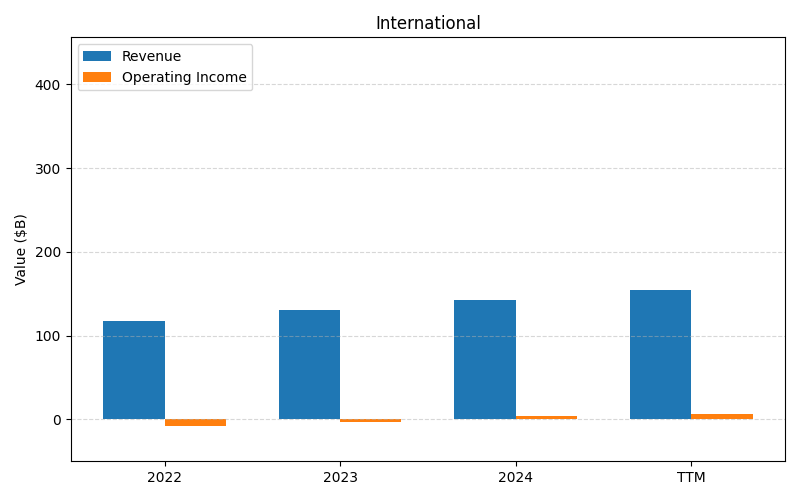
SEGMENTS v2025-09-09 · 2026-05-29 09:04 UTC — Units: $T. Rows list fiscal years (last 3 + TTM) with revenue and operating income for each segment; the final row shows the TTM revenue mix (operating income columns display “—” where mix is not applicable).
| Year | North America Rev | North America OI | International Rev | International OI | Total Rev | Total OI |
|---|---|---|---|---|---|---|
| 2023 | 0.35T | 0.01T | 0.13T | -0.00T | 0.48T | 0.01T |
| 2024 | 0.39T | 0.02T | 0.14T | 0.00T | 0.53T | 0.03T |
| 2025 | 0.43T | 0.03T | 0.16T | 0.00T | 0.59T | 0.03T |
| TTM | 1.01T | 0.07T | 0.38T | 0.01T | 1.39T | 0.08T |
| % of Total (TTM) | 72.8% | — | 27.2% | — | 100% | — |
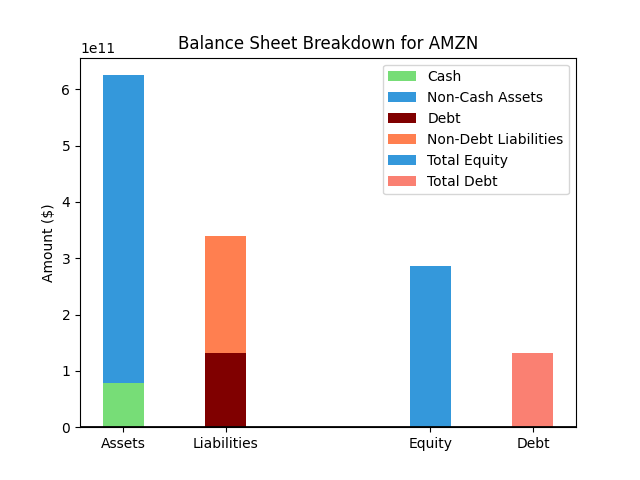
Balance Sheet
| Metric | Value | |
|---|---|---|
| 0 | Total Assets | $916,630M |
| 1 | Cash | $101,816M |
| 2 | Total Liabilities | $474,716M |
| 3 | Total Debt | $209,888M |
| 4 | Total Equity | $441,914M |
| 5 | Debt to Equity Ratio | 0.47 |
EPS & Dividend

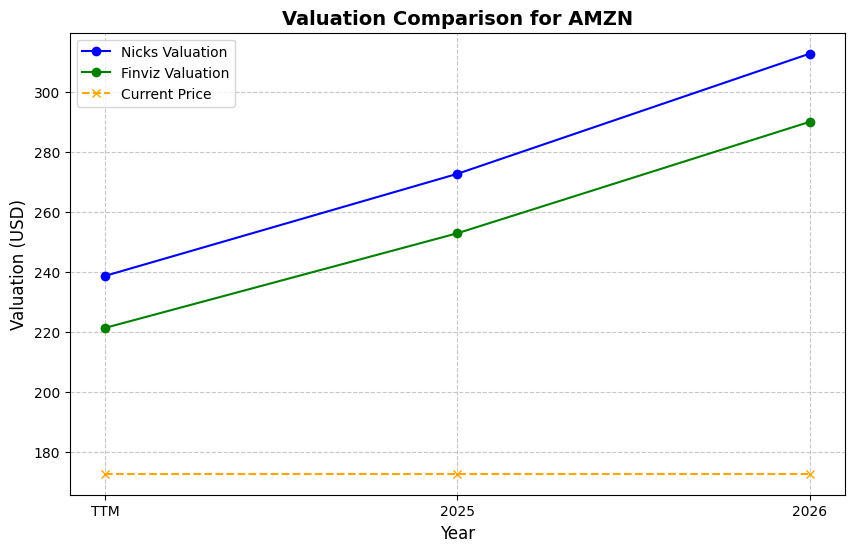
Valuation
| Share Price | Treasury Yield | Estimates | Fair Value (P/E) | Fair Value (P/S) | Current P/S | Current P/E |
|---|---|---|---|---|---|---|
| $270.64 | 4.5% | Nicks Growth: 20% Nick's Expected Margin: 5% FINVIZ Growth: 22% |
Nicks: 42 Finviz: 49 |
Nick's: 2.121 | 3.9 | 31.3 |
| Basis | Year | Nicks Valuation | Nicks vs Share Price | Finviz Valuation | Finviz vs Share Price |
|---|---|---|---|---|---|
| $8.66 EPS | TTM | $367.37 | 35.7% | $420.81 | 55.5% |
| $8.65 EPS | 2026 | $366.79 | 35.5% | $420.14 | 55.2% |
| $9.86 EPS | 2027 | $418.24 | 54.5% | $479.08 | 77.0% |
Implied Growth
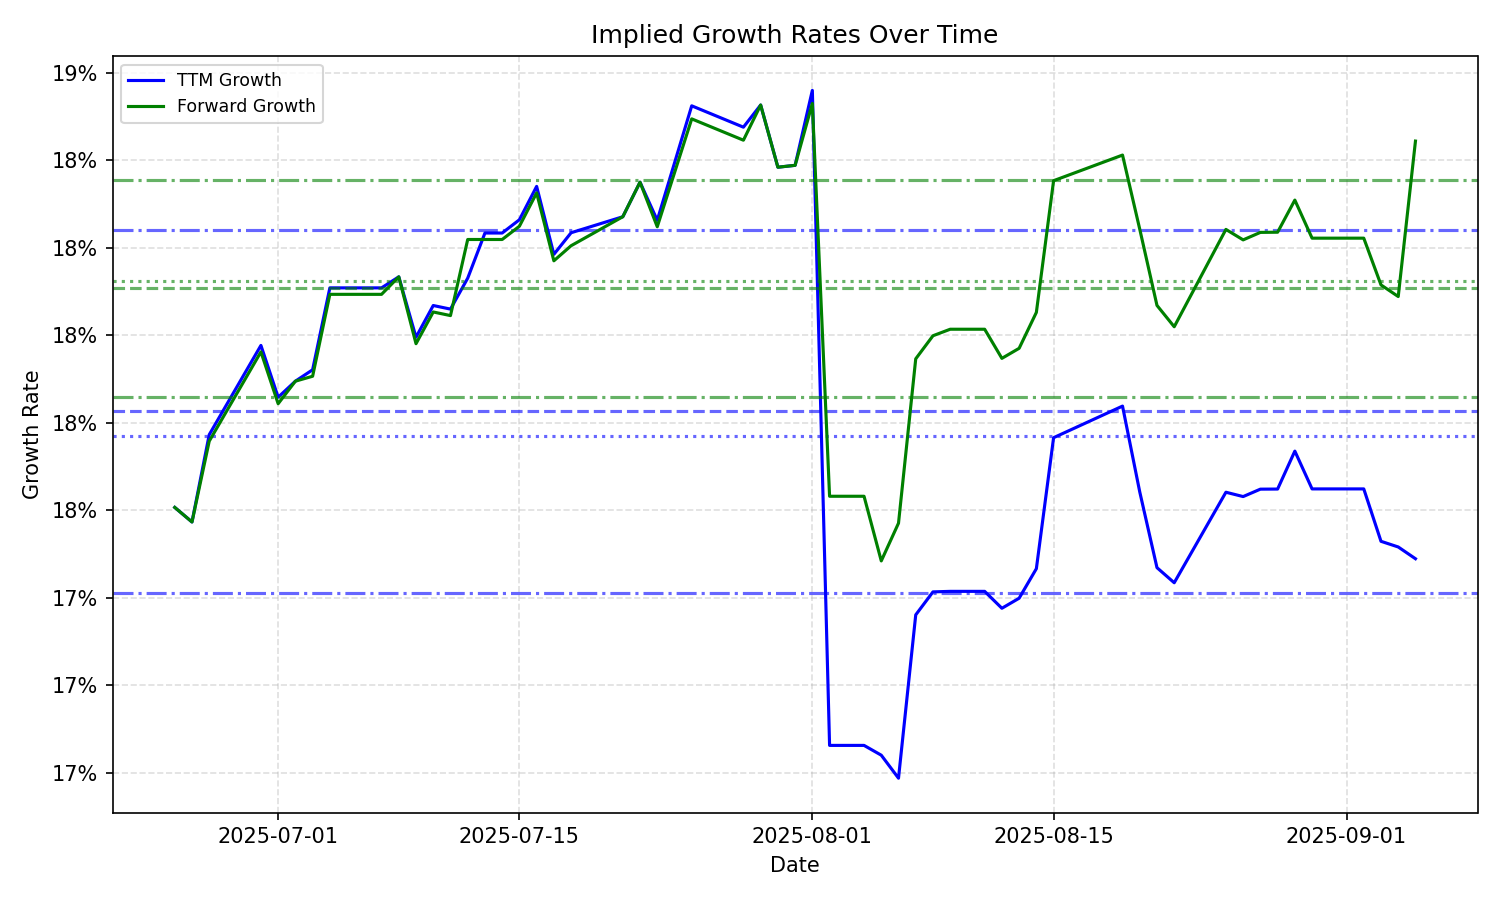
| Average | Median | Std Dev | Current | Percentile | ||||||
|---|---|---|---|---|---|---|---|---|---|---|
| TTM | Forward | TTM | Forward | TTM | Forward | TTM | Forward | TTM | Forward | |
| Timeframe | ||||||||||
| 1 Year | 16.92% | 16.31% | 16.99% | 17.49% | 0.87% | 2.21% | 16.66% | 15.22% | 28.7% | 34.2% |
| 3 Years | 16.92% | 16.31% | 16.99% | 17.49% | 0.87% | 2.21% | 16.66% | 15.22% | 28.7% | 34.2% |
| 5 Years | 16.92% | 16.31% | 16.99% | 17.49% | 0.87% | 2.21% | 16.66% | 15.22% | 28.7% | 34.2% |
| 10 Years | 16.92% | 16.31% | 16.99% | 17.49% | 0.87% | 2.21% | 16.66% | 15.22% | 28.7% | 34.2% |