Advanced Micro Devices, Inc. — AMD
| Close Price | Market Cap | P/E Ratio | Forward P/E Ratio | Implied Growth* | Implied Forward Growth* | Dividend | P/B Ratio |
|---|---|---|---|---|---|---|---|
| $516.10 | $841.55B | 172.0 | 39.8 | 37.4% | 19.3% | - | 13.1 |
Latest Headlines
- · Nvidia Dropped a Cryptic Clue About Its Next Big Move Ahead of GTC Event
- · Nvidia, AMD, & other chip names in focus at Computex 2026
- · The CEOs of the world's biggest chip companies are descending on Taiwan next week
- · This Risk ETF Is Riding Its Best Seven-Day Stretch in a Year
- · South Korea Is Up Nearly 96 Percent in 2026 and These 3 ETFs Let You Play the Chip Nation Story at Different Risk Levels
- · AMD CEO Lisa Su tells grads they shape the future, not AI—and the world doesn’t just need ‘people who know how to use powerful tools’
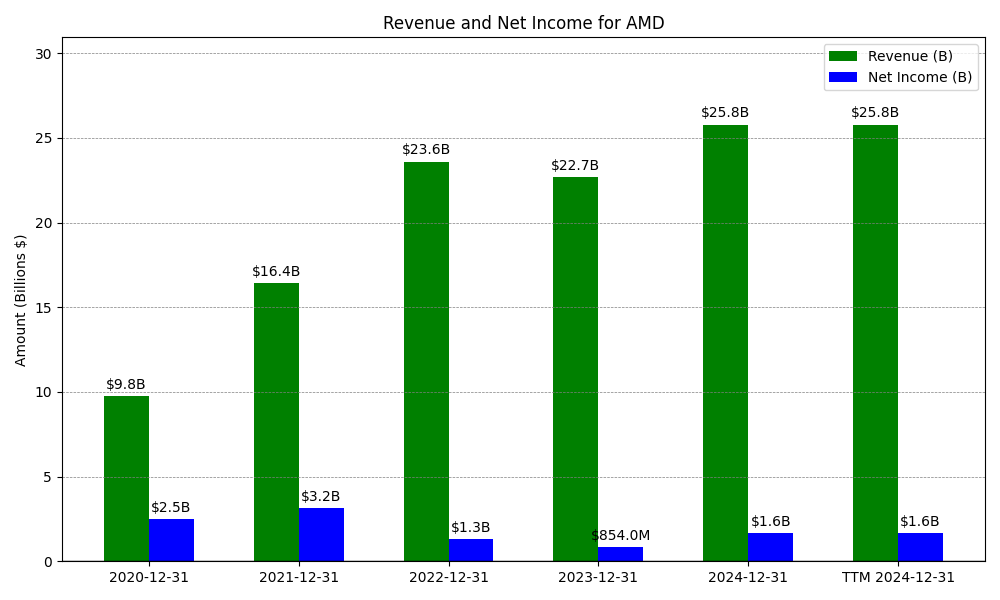
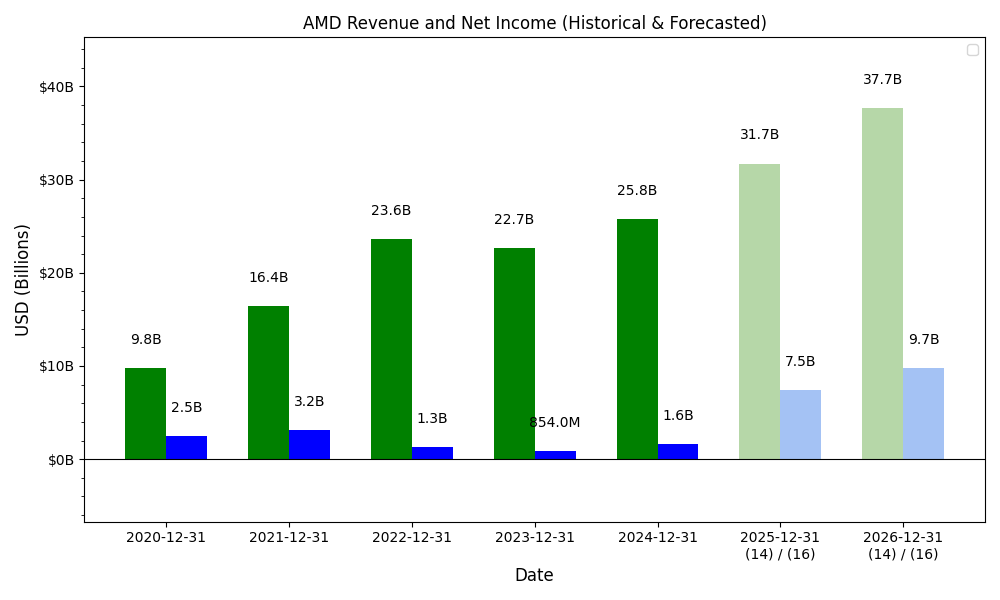
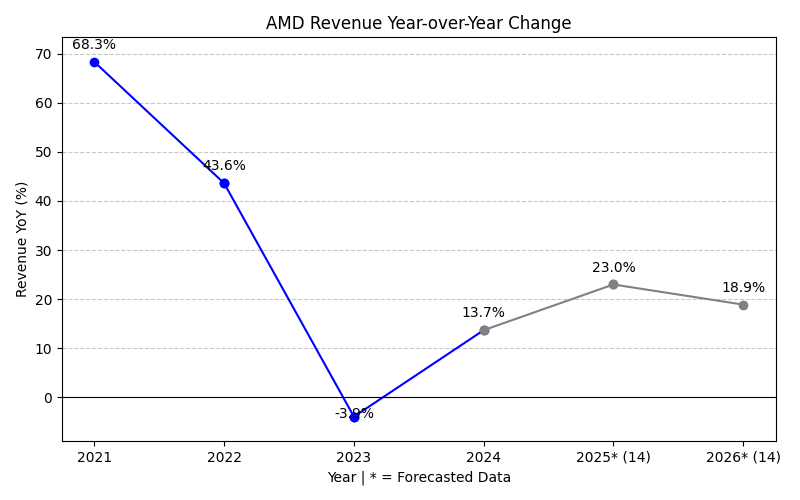
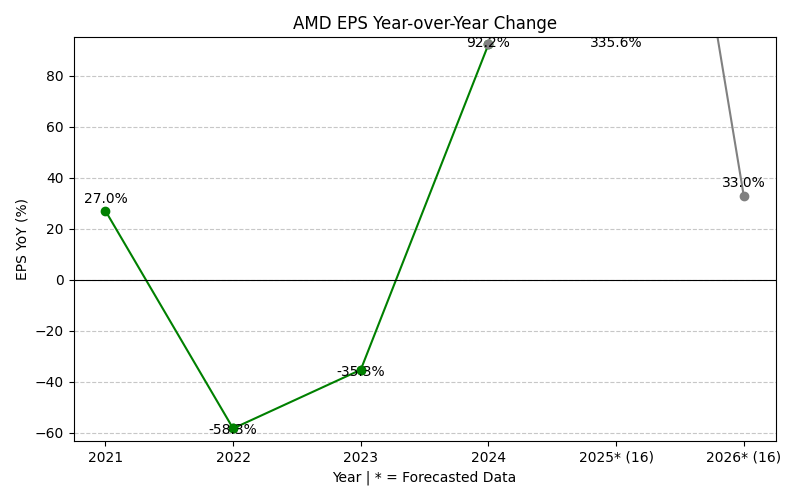
Revenue & Net Income
| Date | Revenue | Net_Income | EPS | Last_Updated | Revenue_Change | Net_Income_Change | EPS_Change | |
|---|---|---|---|---|---|---|---|---|
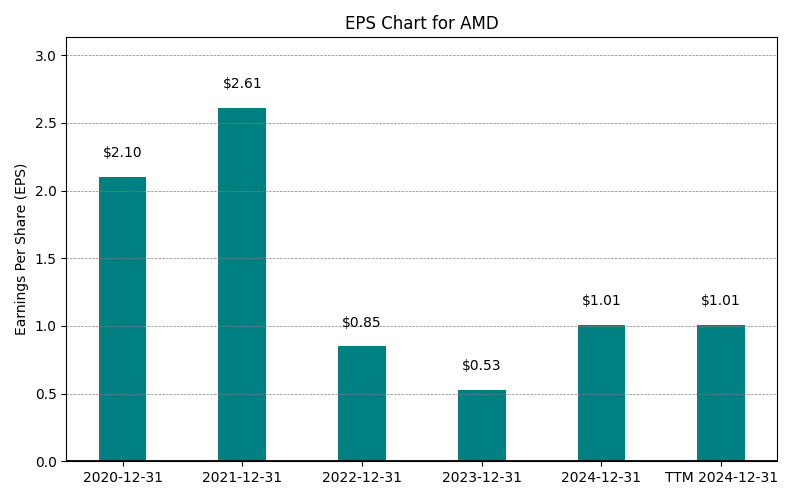
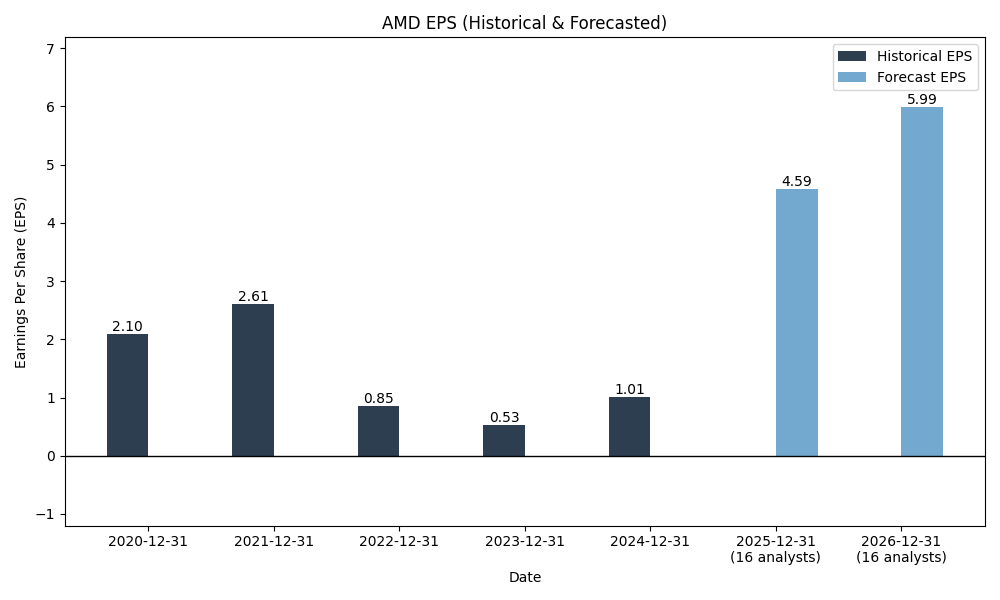
| 0 | 2020-12-31 | $9,763M | $2,490M | $2.10 | 2024-02-03 03:17:10 | N/A | N/A | N/A |
| 1 | 2021-12-31 | $16,434M | $3,162M | $2.61 | 2024-02-03 03:17:10 | 68.3% | 27.0% | 24.3% |
| 2 | 2022-12-31 | $23,601M | $1,320M | $0.85 | 2026-05-29 09:04:36 | 43.6% | -58.3% | -67.4% |
| 3 | 2023-12-31 | $22,680M | $854M | $0.53 | 2026-05-29 09:04:36 | -3.9% | -35.3% | -37.6% |
| 4 | 2024-12-31 | $25,785M | $1,641M | $1.01 | 2026-05-29 09:04:36 | 13.7% | 92.2% | 90.6% |
| 5 | 2025-12-31 | $34,639M | $4,335M | $2.67 | 2026-05-29 09:04:36 | 34.3% | 164.2% | 164.4% |
| 6 | TTM 2026-03-31 | $37,454M | $5,009M | $3.00 | 2026-05-20 09:02:51 | 8.1% | 15.5% | 12.4% |
EPS
Forecasts
Y/Y % Change
AMD Year-over-Year Growth
| 2020 | 2021 | 2022 | 2023 | 2024 | 2025 | 2026 | 2027 | Average | |
|---|---|---|---|---|---|---|---|---|---|
| Revenue Growth (%) | 68.3% | 43.6% | -3.9% | 13.7% | 34.3% | 42.7% | 53.7% | 36.1% | |
| Revenue Analysts (#) | 0 | 0 | 0 | 0 | 0 | 0 | 46 | 47 | |
| EPS Growth (%) | 27.0% | -58.3% | -35.3% | 92.2% | 164.2% | 177.1% | 75.9% | 63.3% | |
| EPS Analysts (#) | 0 | 0 | 0 | 0 | 0 | 0 | 46 | 45 |
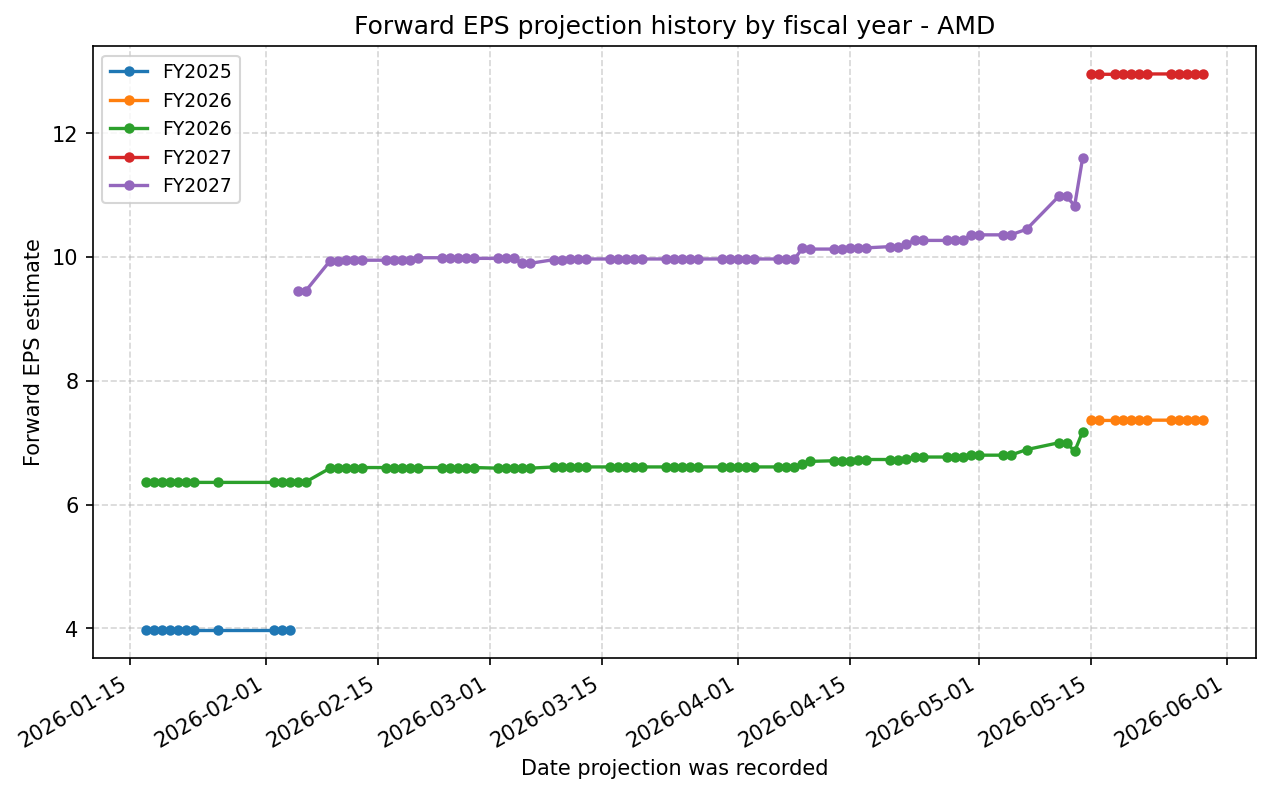
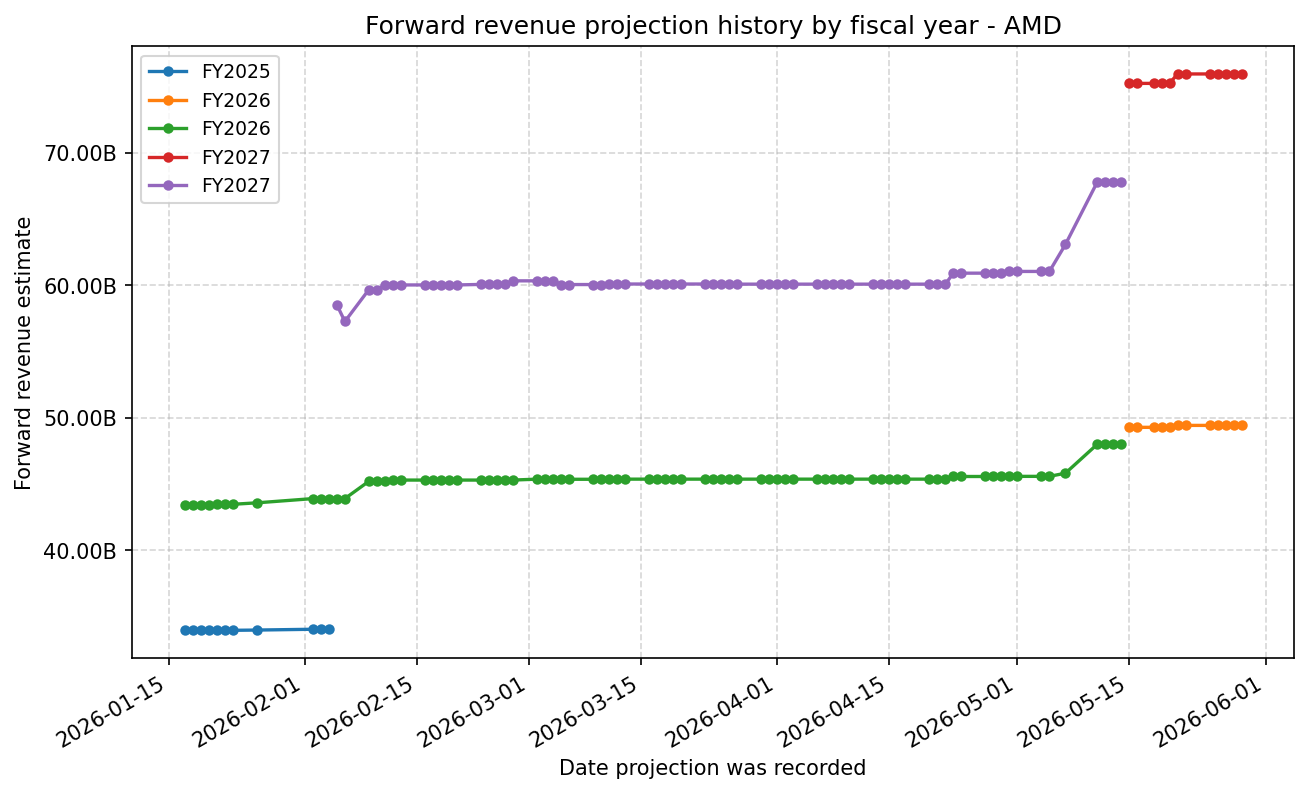
Forward Estimate History
How the next-FY EPS and revenue estimates have drifted over time. One line per fiscal year – past lines end when that FY became current.
Expenses
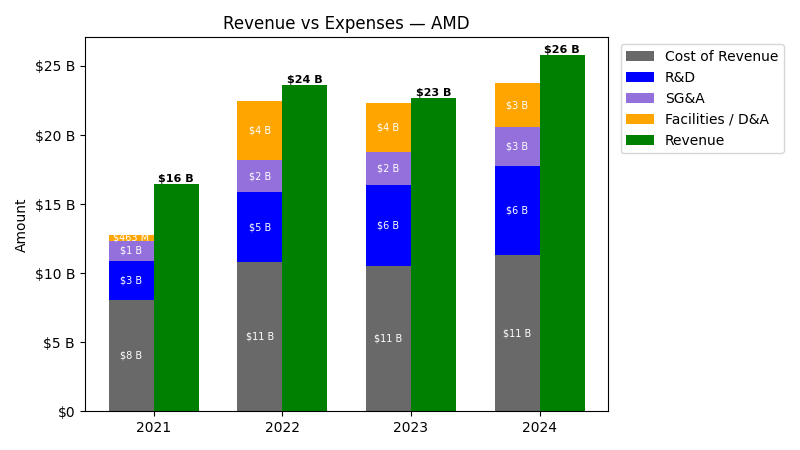
| Year | Revenue ($) | Cost of Revenue ($) | R&D ($) | SG&A ($) | Facilities / D&A ($) |
|---|---|---|---|---|---|
| 2022 | $23.6B | $6.6B | $5.0B | $2.3B | $4.3B |
| 2023 | $22.7B | $7.2B | $5.9B | $2.3B | $3.5B |
| 2024 | $25.8B | $8.4B | $6.5B | $2.7B | $3.1B |
| 2025 | $34.6B | $12.7B | $8.1B | $4.1B | $3.0B |
| TTM | $37.5B | $13.8B | $8.8B | $4.5B | $3.0B |
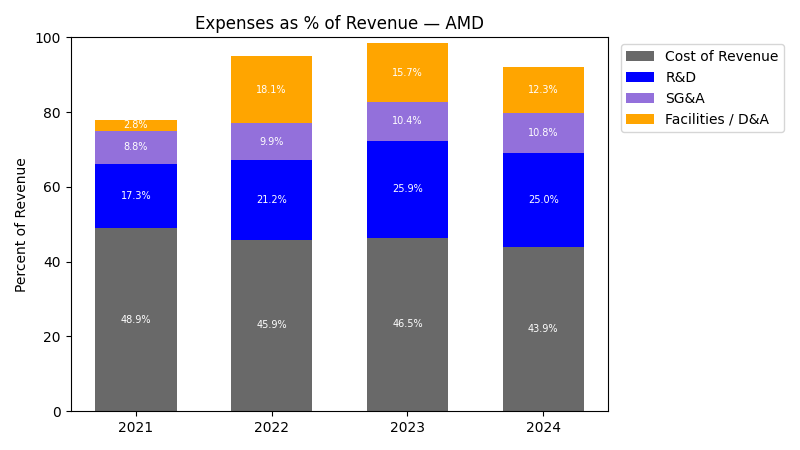
| Year | Revenue Change (%) | Cost of Revenue Change (%) | R&D Change (%) | SG&A Change (%) | Facilities / D&A Change (%) |
|---|---|---|---|---|---|
| 2023 | -3.90 | 9.26 | 17.32 | -0.77 | -18.98 |
| 2024 | 13.69 | 16.66 | 9.95 | 17.99 | -11.27 |
| 2025 | 34.34 | 51.58 | 25.33 | 51.52 | -1.96 |
| TTM | 8.13 | 8.49 | 8.27 | 8.86 | 0.50 |
No unmapped expenses.
Segment Performance
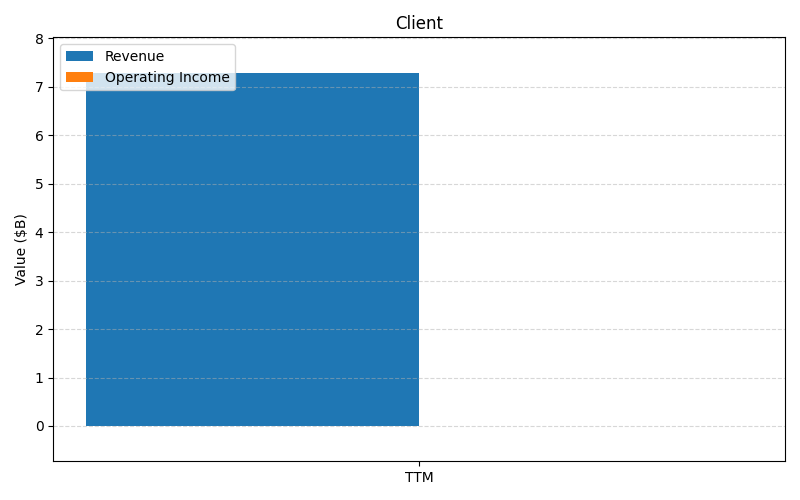
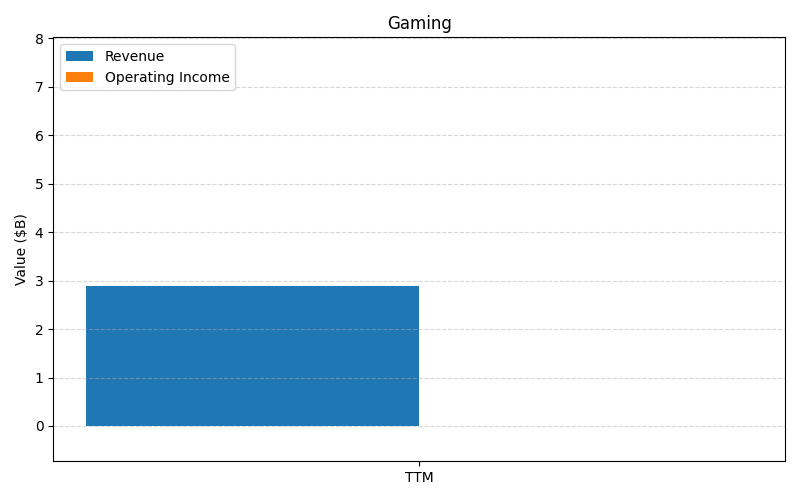
SEGMENTS v2025-09-09 · 2026-05-29 09:04 UTC — Units: $B. Rows list fiscal years (last 3 + TTM) with revenue for each segment; the final row shows the TTM revenue mix (operating income columns display “—” where mix is not applicable).
| Year | Client Rev | Gaming Rev | Total Rev |
|---|---|---|---|
| 2023 | 4.65B | 6.21B | 10.9B |
| 2024 | 7.05B | 2.60B | 9.65B |
| 2025 | 10.6B | 3.91B | 14.6B |
| TTM | 22.9B | 7.87B | 30.7B |
| % of Total (TTM) | 74.4% | 25.6% | 100% |
Segment Performance (Axis 2)
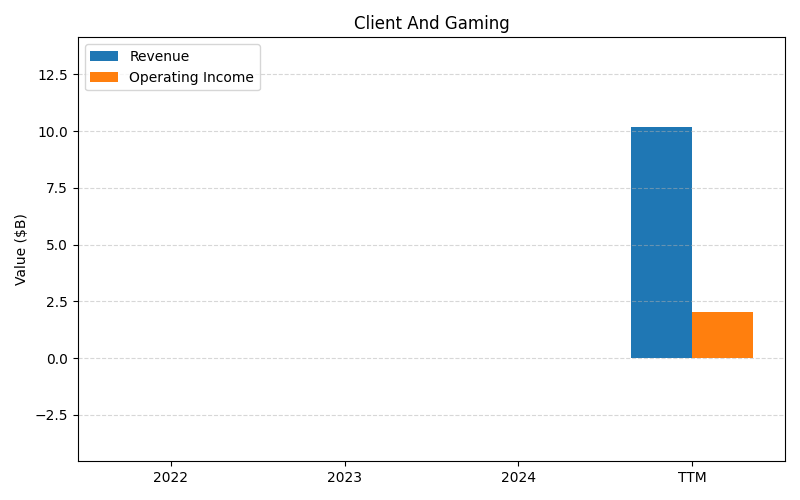
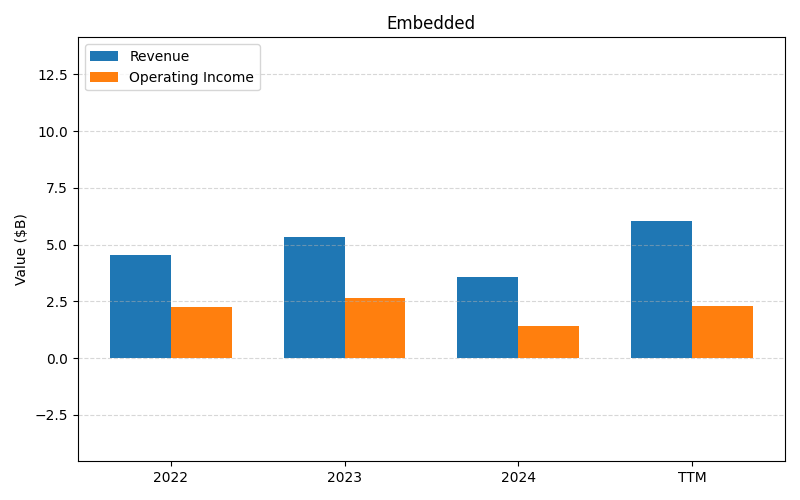
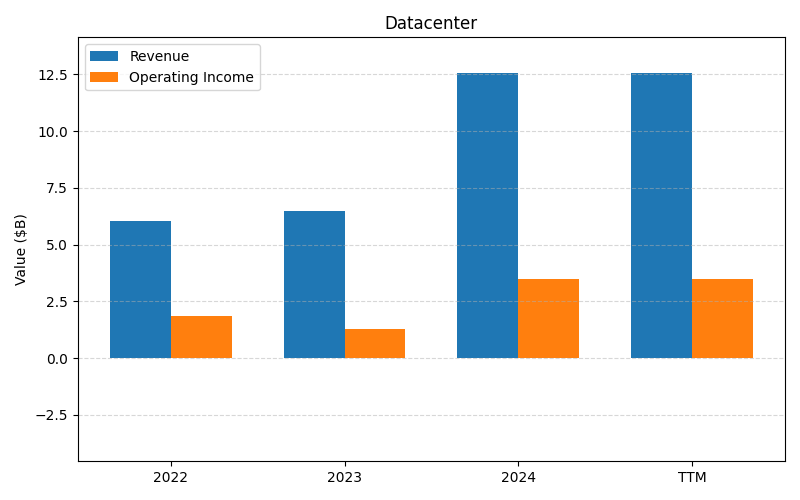
SEGMENTS v2025-09-09 · 2026-05-29 09:04 UTC — Units: $B. Rows list fiscal years (last 3 + TTM) with revenue and operating income for each segment; the final row shows the TTM revenue mix (operating income columns display “—” where mix is not applicable).
| Year | Client And Gaming Rev | Client And Gaming OI | Embedded Rev | Embedded OI | Datacenter Rev | Datacenter OI | Total Rev | Total OI |
|---|---|---|---|---|---|---|---|---|
| 2023 | 10.9B | 0.93B | 5.32B | 2.63B | 6.50B | 1.27B | 22.7B | 4.82B |
| 2024 | 9.65B | 1.19B | 3.56B | 1.42B | 12.6B | 3.48B | 25.8B | 6.09B |
| 2025 | 14.6B | 2.85B | 3.45B | 1.24B | 16.6B | 3.60B | 34.6B | 7.70B |
| TTM | 30.7B | 5.11B | 8.71B | 3.33B | – | – | 39.5B | 8.44B |
| % of Total (TTM) | 77.9% | — | 22.1% | — | – | — | 100% | — |
Balance Sheet

| Metric | Value | |
|---|---|---|
| 0 | Total Assets | $79,642M |
| 1 | Cash | $5,585M |
| 2 | Total Liabilities | $15,180M |
| 3 | Total Debt | $3,871M |
| 4 | Total Equity | $64,462M |
| 5 | Debt to Equity Ratio | 0.06 |
EPS & Dividend

Valuation
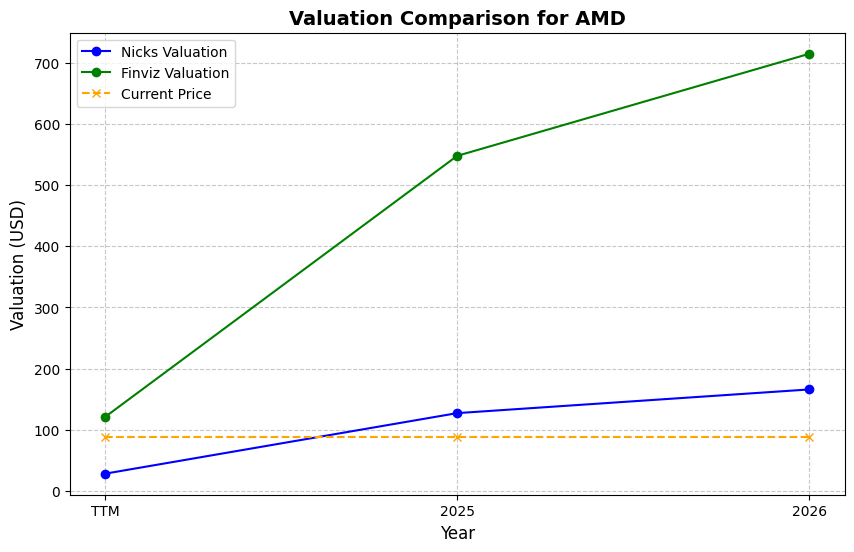
| Share Price | Treasury Yield | Estimates | Fair Value (P/E) | Fair Value (P/S) | Current P/S | Current P/E |
|---|---|---|---|---|---|---|
| $516.10 | 4.5% | Nicks Growth: 15% Nick's Expected Margin: 10% FINVIZ Growth: 62% |
Nicks: 27 Finviz: 964 |
Nick's: 2.726 | 22.5 | 172.0 |
| Basis | Year | Nicks Valuation | Nicks vs Share Price | Finviz Valuation | Finviz vs Share Price |
|---|---|---|---|---|---|
| $3.00 EPS | TTM | $81.77 | -84.2% | $2891.58 | 460.3% |
| $7.37 EPS | 2026 | $200.76 | -61.1% | $7099.48 | 1275.6% |
| $12.96 EPS | 2027 | $353.23 | -31.6% | $12491.18 | 2320.3% |
Implied Growth
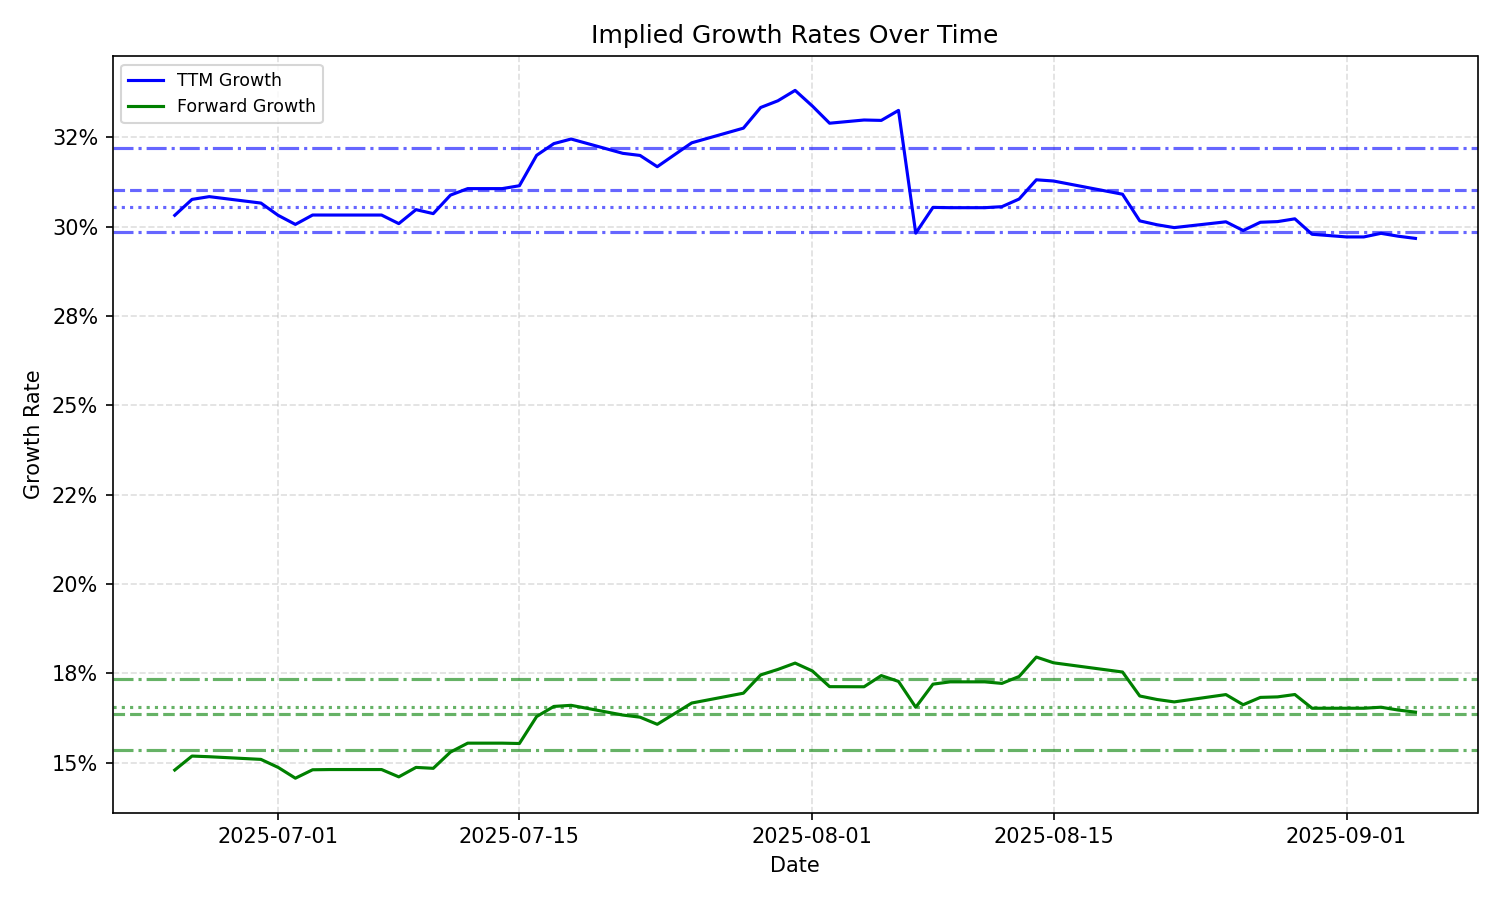
| Average | Median | Std Dev | Current | Percentile | ||||||
|---|---|---|---|---|---|---|---|---|---|---|
| TTM | Forward | TTM | Forward | TTM | Forward | TTM | Forward | TTM | Forward | |
| Timeframe | ||||||||||
| 1 Year | 31.07% | 16.20% | 30.99% | 16.58% | 2.67% | 3.17% | 37.42% | 19.32% | 100.0% | 81.7% |
| 3 Years | 31.07% | 16.20% | 30.99% | 16.58% | 2.67% | 3.17% | 37.42% | 19.32% | 100.0% | 81.7% |
| 5 Years | 31.07% | 16.20% | 30.99% | 16.58% | 2.67% | 3.17% | 37.42% | 19.32% | 100.0% | 81.7% |
| 10 Years | 31.07% | 16.20% | 30.99% | 16.58% | 2.67% | 3.17% | 37.42% | 19.32% | 100.0% | 81.7% |