Applied Materials, Inc. — AMAT
| Close Price | Market Cap | P/E Ratio | Forward P/E Ratio | Implied Growth* | Implied Forward Growth* | Dividend | P/B Ratio |
|---|---|---|---|---|---|---|---|
| $450.06 | $357.33B | 42.4 | 27.8 | 20.0% | 15.2% | $2.12 0.5% | 14.9 |
Latest Headlines
- · Stock Indexes Rally to Record Highs on Peace Deal Hopes and AI Spending
- · Applied Materials (AMAT) Surged Following the Blowout February Earnings Beat
- · Is Applied Materials Stock Outperforming the Nasdaq?
- · Assessing Applied Materials (AMAT) Valuation After Earnings Beat And New AI Chip Equipment Partnerships
- · The AI Memory Shortage Is Just Getting Started and These 3 ETFs Own Every Layer of the Supply Chain
- · Applied Materials Bets AI Boom Will Drive Logic, DRAM and Packaging Growth
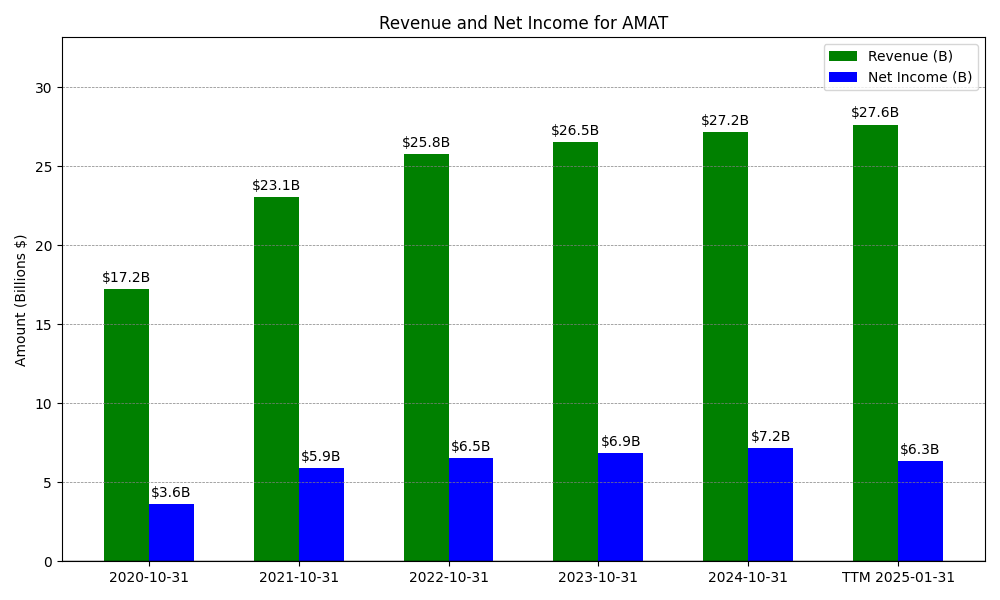
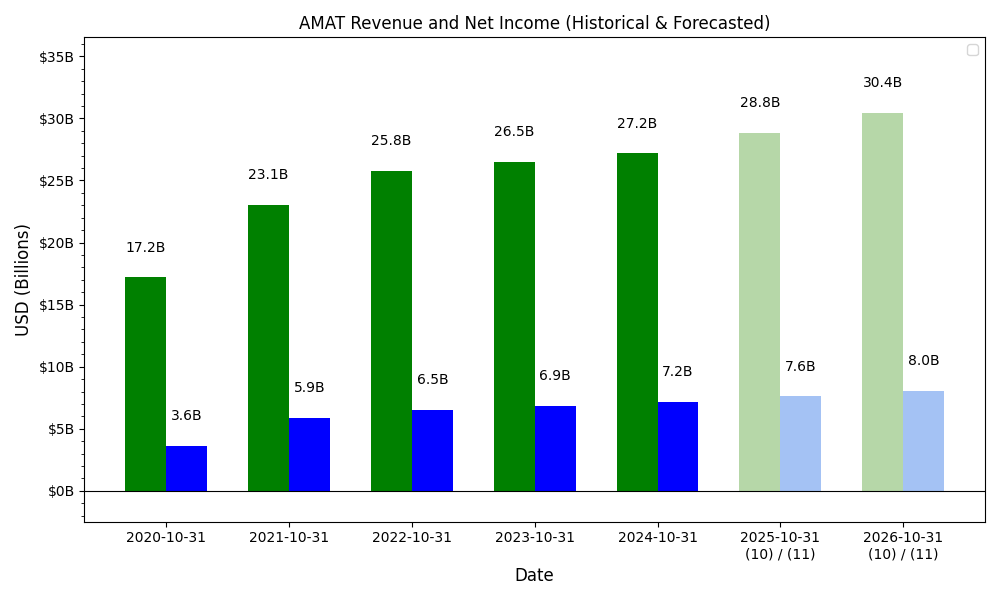
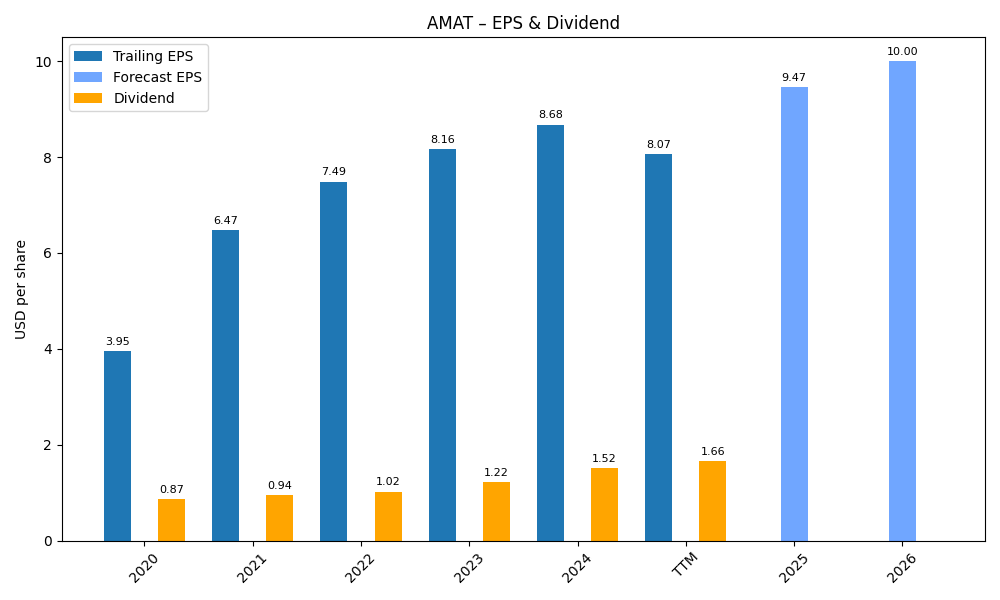
Revenue & Net Income
| Date | Revenue | Net_Income | EPS | Last_Updated | Revenue_Change | Net_Income_Change | EPS_Change | |
|---|---|---|---|---|---|---|---|---|
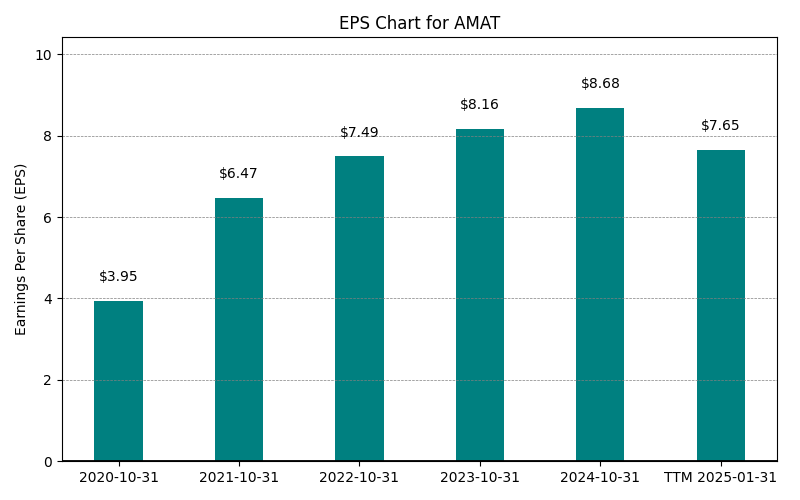
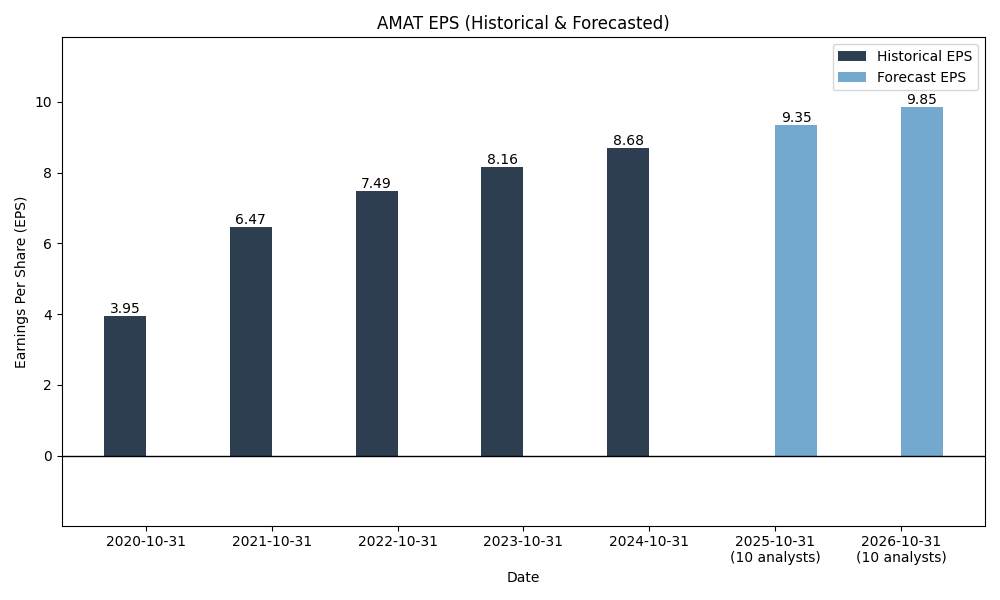
| 0 | 2020-10-31 | $17,202M | $3,619M | $3.95 | 2024-02-04 04:16:33 | N/A | N/A | N/A |
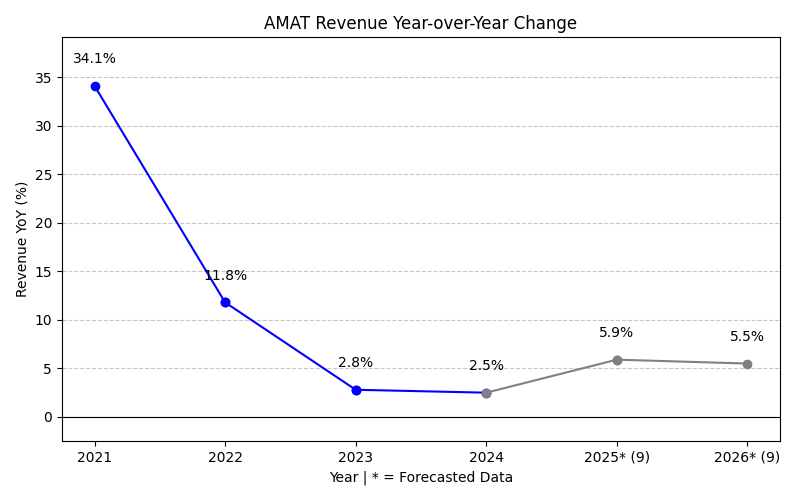
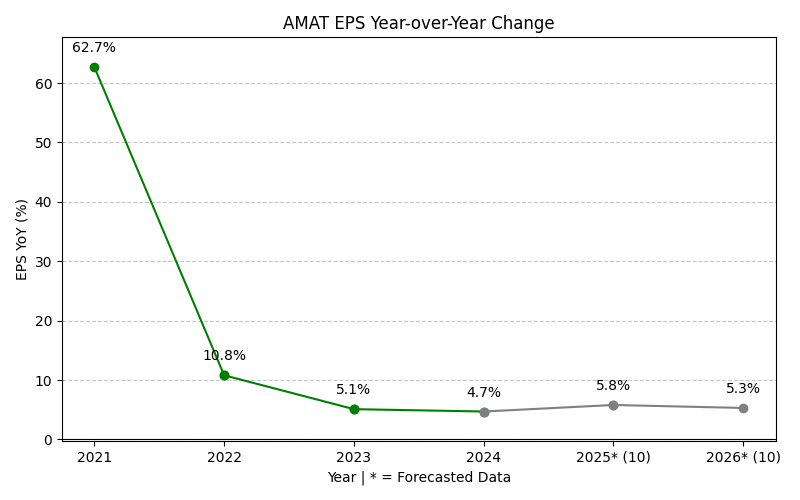
| 1 | 2021-10-31 | $23,063M | $5,888M | $6.47 | 2024-02-04 04:16:33 | 34.1% | 62.7% | 63.8% |
| 2 | 2022-10-31 | $25,785M | $6,525M | $7.49 | 2026-05-29 09:04:30 | 11.8% | 10.8% | 15.8% |
| 3 | 2023-10-31 | $26,517M | $6,856M | $8.16 | 2026-05-29 09:04:30 | 2.8% | 5.1% | 8.9% |
| 4 | 2024-10-31 | $27,176M | $7,177M | $8.68 | 2026-05-29 09:04:30 | 2.5% | 4.7% | 6.4% |
| 5 | 2025-10-31 | $28,368M | $6,998M | $8.71 | 2026-05-29 09:04:30 | 4.4% | -2.5% | 0.3% |
| 6 | TTM 2026-04-30 | $29,024M | $8,508M | $10.61 | 2026-05-20 09:02:44 | 2.3% | 21.6% | 21.8% |
EPS
Forecasts
Y/Y % Change
AMAT Year-over-Year Growth
| 2020 | 2021 | 2022 | 2023 | 2024 | 2025 | 2026 | 2027 | Average | |
|---|---|---|---|---|---|---|---|---|---|
| Revenue Growth (%) | 34.1% | 11.8% | 2.8% | 2.5% | 4.4% | 17.4% | 25.6% | 14.1% | |
| Revenue Analysts (#) | 0 | 0 | 0 | 0 | 0 | 0 | 35 | 35 | |
| EPS Growth (%) | 62.7% | 10.8% | 5.1% | 4.7% | -2.5% | 39.1% | 31.9% | 21.7% | |
| EPS Analysts (#) | 0 | 0 | 0 | 0 | 0 | 0 | 35 | 36 |
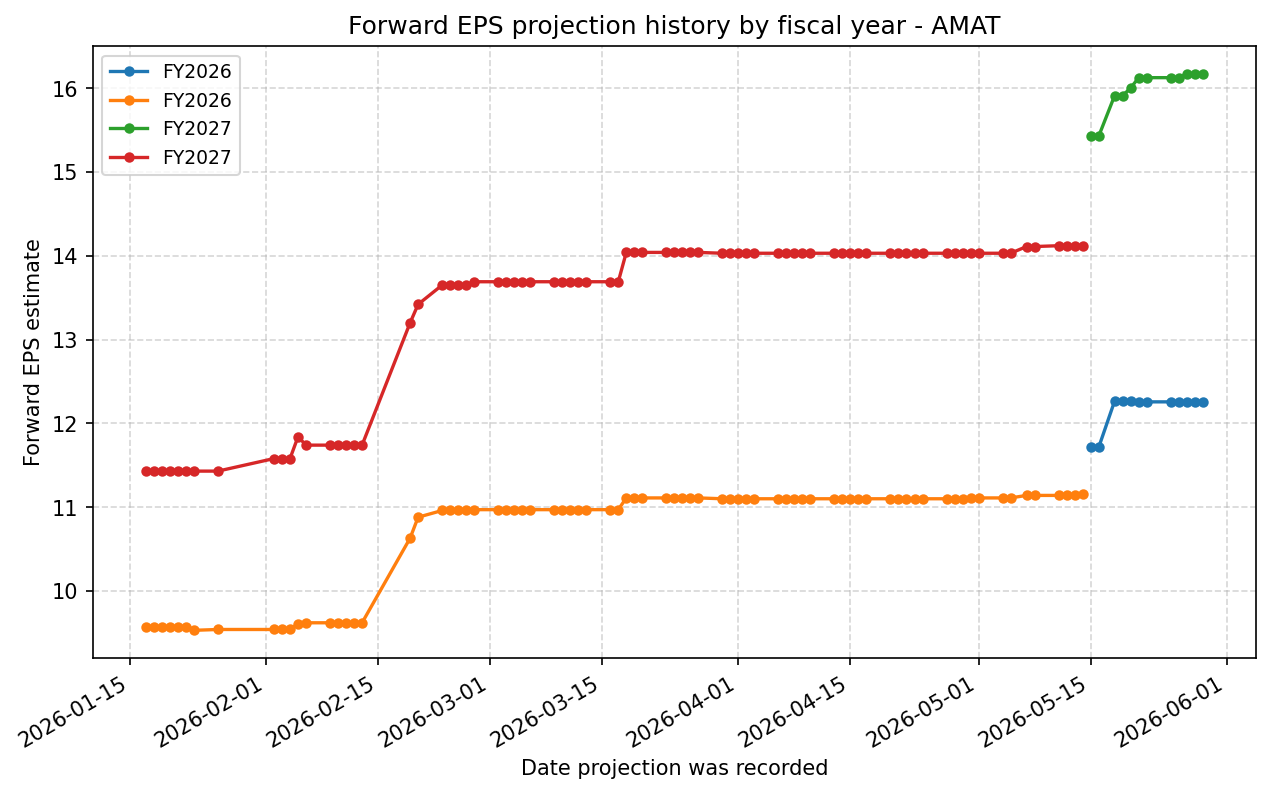
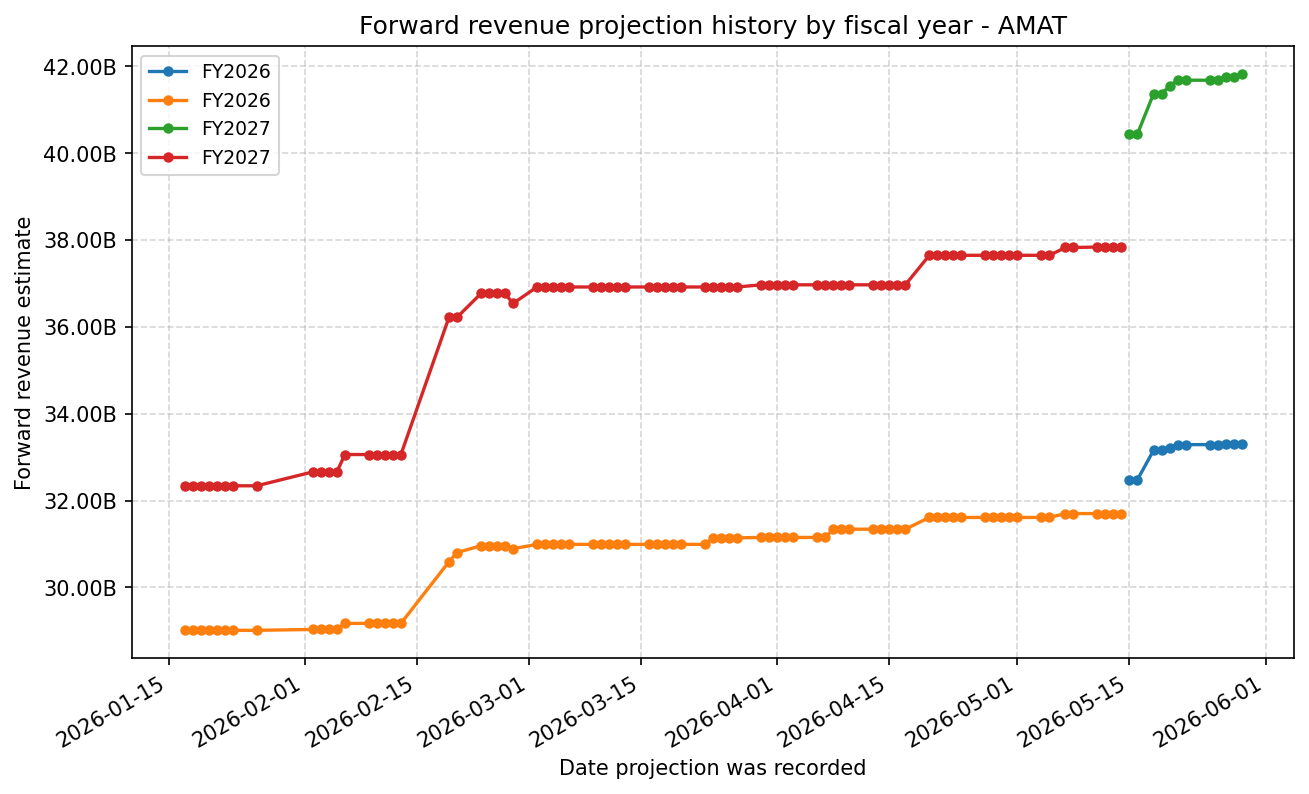
Forward Estimate History
How the next-FY EPS and revenue estimates have drifted over time. One line per fiscal year – past lines end when that FY became current.
Expenses
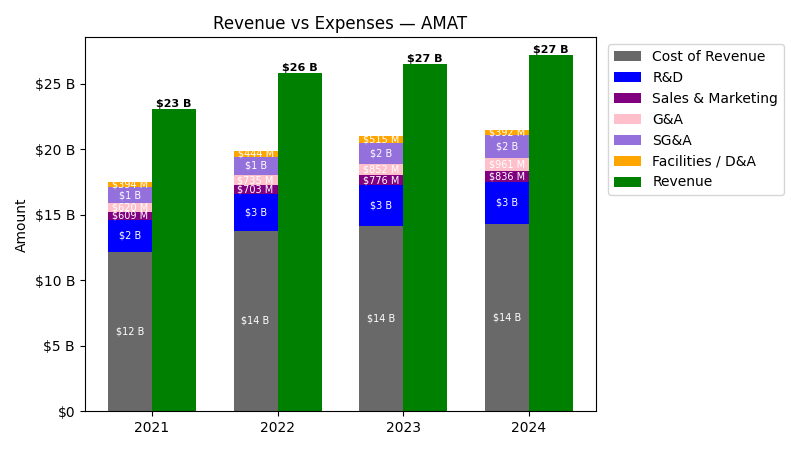
| Year | Revenue ($) | Cost of Revenue ($) | R&D ($) | Sales & Marketing ($) | G&A ($) | SG&A ($) | Facilities / D&A ($) |
|---|---|---|---|---|---|---|---|
| 2022 | $25.8B | $13.3B | $2.8B | $703.0M | $735.0M | $1.4B | $444.0M |
| 2023 | $26.5B | $13.6B | $3.1B | $776.0M | $852.0M | $1.6B | $515.0M |
| 2024 | $27.2B | $13.9B | $3.2B | $836.0M | $961.0M | $1.8B | $392.0M |
| 2025 | $28.4B | $14.1B | $3.6B | $858.0M | $910.0M | $1.8B | $435.0M |
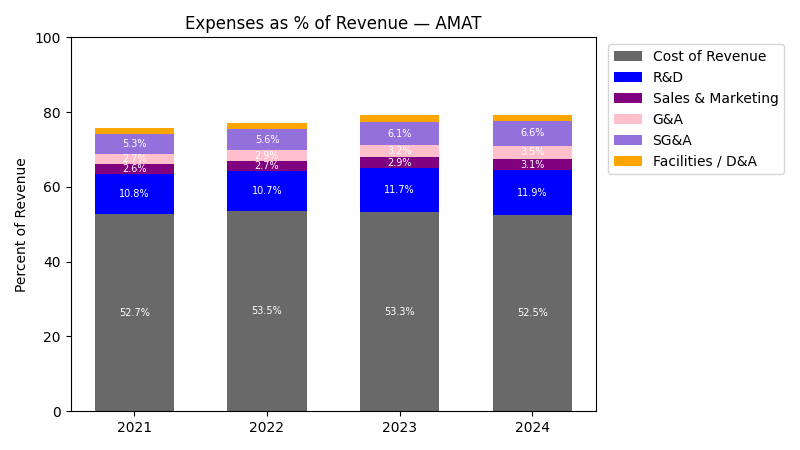
| Year | Revenue Change (%) | Cost of Revenue Change (%) | R&D Change (%) | Sales & Marketing Change (%) | G&A Change (%) | SG&A Change (%) | Facilities / D&A Change (%) |
|---|---|---|---|---|---|---|---|
| 2023 | 2.84 | 2.02 | 11.95 | 10.38 | 15.92 | 13.21 | 15.99 |
| 2024 | 2.49 | 1.98 | 4.22 | 7.73 | 12.79 | 10.38 | -23.88 |
| 2025 | 4.39 | 1.71 | 10.42 | 2.63 | -5.31 | -1.61 | 10.97 |
No unmapped expenses.
Segment Performance
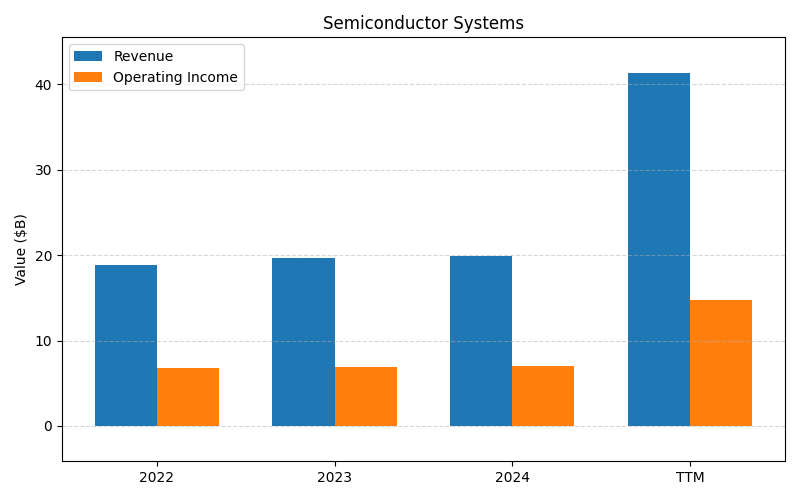
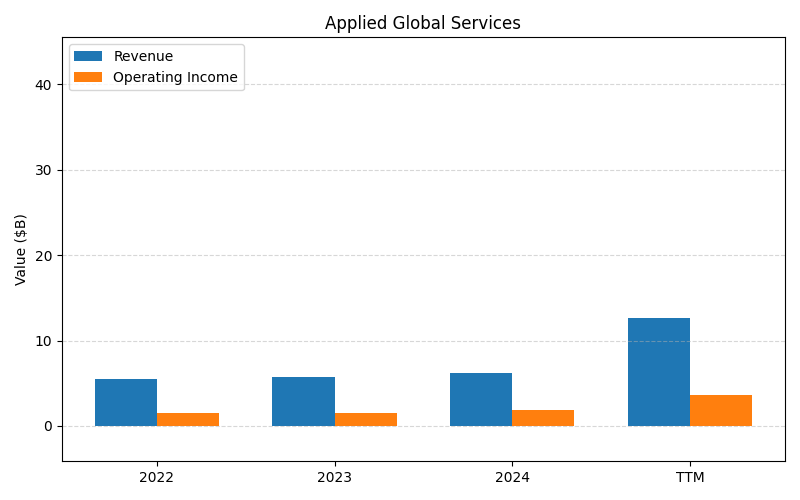
SEGMENTS v2025-09-09 · 2026-05-29 09:04 UTC — Units: $B. Rows list fiscal years (last 3 + TTM) with revenue and operating income for each segment; the final row shows the TTM revenue mix (operating income columns display “—” where mix is not applicable).
| Year | Semiconductor Systems Rev | Semiconductor Systems OI | Applied Global Services Rev | Applied Global Services OI | Total Rev | Total OI |
|---|---|---|---|---|---|---|
| 2023 | 19.7B | 6.88B | 5.73B | 1.53B | 25.4B | 8.41B |
| 2024 | 19.9B | 6.98B | 6.22B | 1.81B | 26.1B | 8.79B |
| 2025 | 20.8B | 7.38B | 6.38B | 1.79B | 27.2B | 9.17B |
| TTM | 74.2B | 25.4B | 21.7B | 6.11B | 95.9B | 31.5B |
| % of Total (TTM) | 77.4% | — | 22.6% | — | 100% | — |
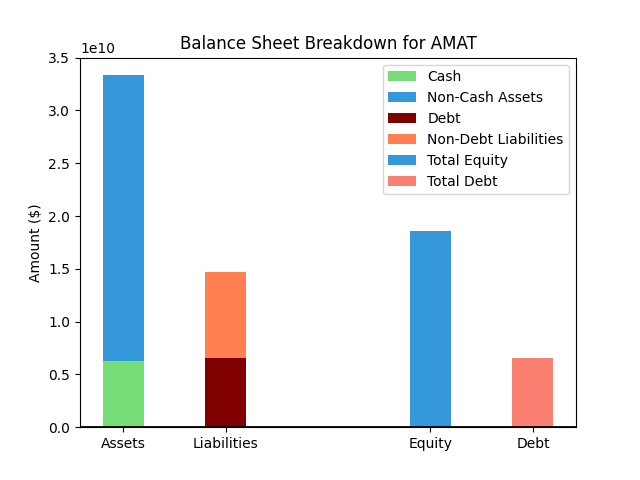
Balance Sheet
| Metric | Value | |
|---|---|---|
| 0 | Total Assets | $40,286M |
| 1 | Cash | $6,301M |
| 2 | Total Liabilities | $16,377M |
| 3 | Total Debt | $7,268M |
| 4 | Total Equity | $23,909M |
| 5 | Debt to Equity Ratio | 0.30 |
EPS & Dividend
Valuation
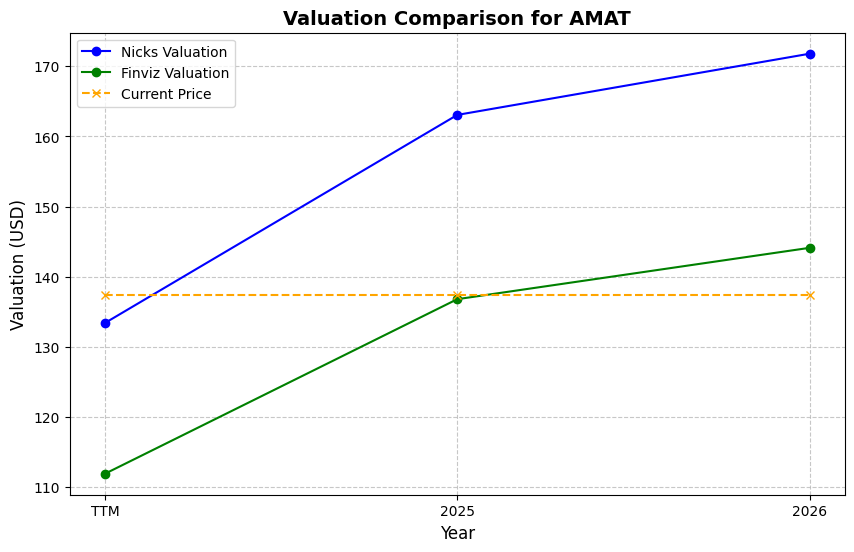
| Share Price | Treasury Yield | Estimates | Fair Value (P/E) | Fair Value (P/S) | Current P/S | Current P/E |
|---|---|---|---|---|---|---|
| $450.06 | 4.5% | Nicks Growth: 10% Nick's Expected Margin: 25% FINVIZ Growth: 28% |
Nicks: 17 Finviz: 83 |
Nick's: 4.289 | 12.3 | 42.4 |
| Basis | Year | Nicks Valuation | Nicks vs Share Price | Finviz Valuation | Finviz vs Share Price |
|---|---|---|---|---|---|
| $10.61 EPS | TTM | $182.04 | -59.6% | $882.66 | 96.1% |
| $12.26 EPS | 2026 | $210.34 | -53.3% | $1019.87 | 126.6% |
| $16.17 EPS | 2027 | $277.43 | -38.4% | $1345.18 | 198.9% |
Implied Growth
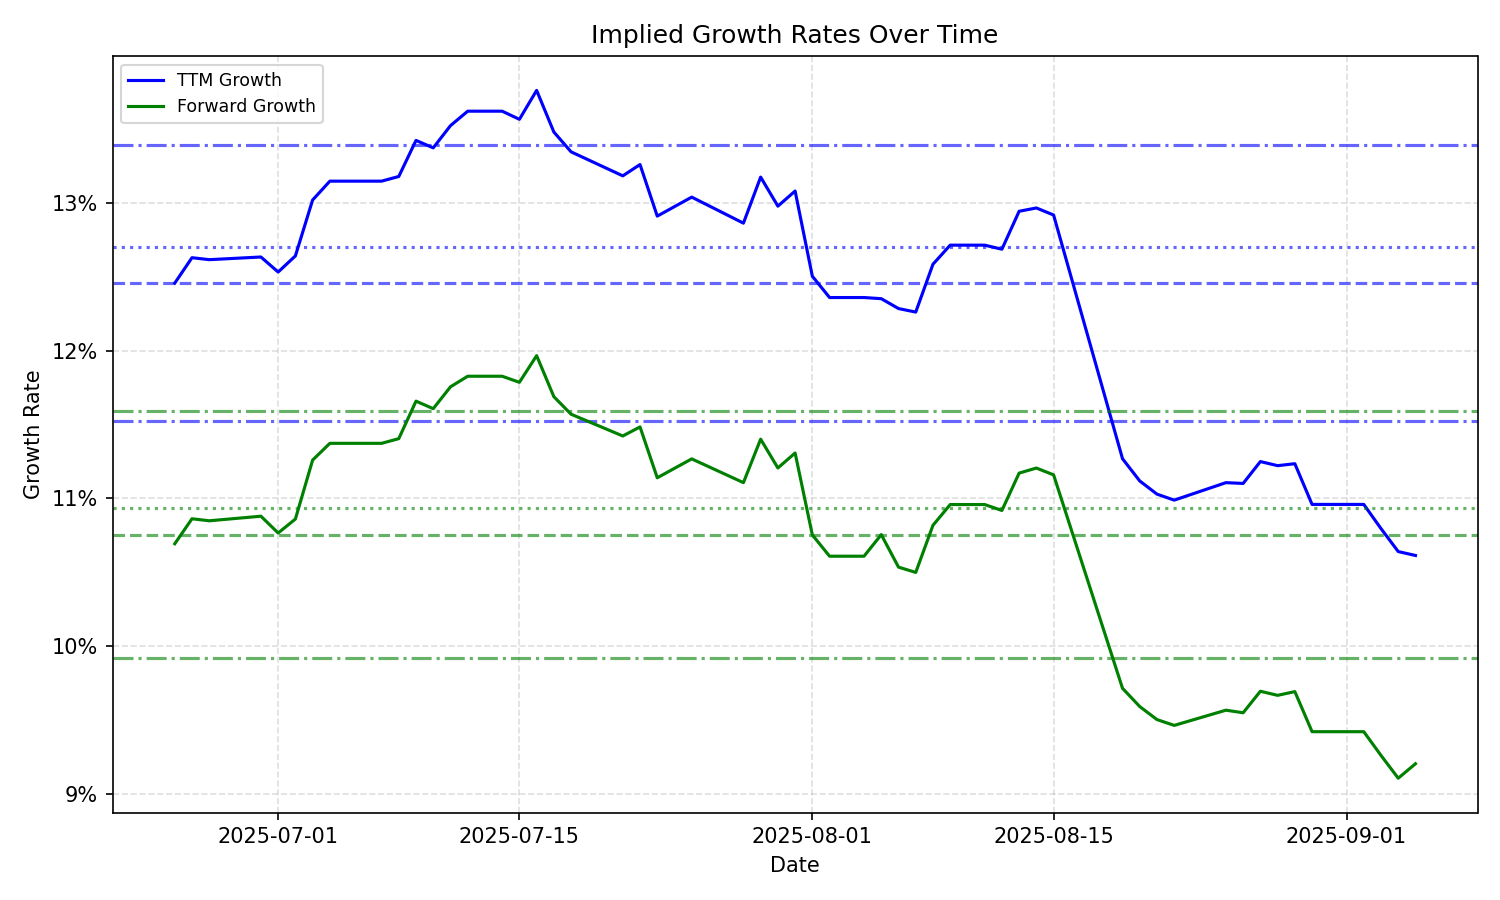
| Average | Median | Std Dev | Current | Percentile | ||||||
|---|---|---|---|---|---|---|---|---|---|---|
| TTM | Forward | TTM | Forward | TTM | Forward | TTM | Forward | TTM | Forward | |
| Timeframe | ||||||||||
| 1 Year | 15.56% | 12.94% | 15.14% | 13.12% | 2.85% | 1.86% | 19.99% | 15.22% | 97.1% | 92.9% |
| 3 Years | 15.56% | 12.94% | 15.14% | 13.12% | 2.85% | 1.86% | 19.99% | 15.22% | 97.1% | 92.9% |
| 5 Years | 15.56% | 12.94% | 15.14% | 13.12% | 2.85% | 1.86% | 19.99% | 15.22% | 97.1% | 92.9% |
| 10 Years | 15.56% | 12.94% | 15.14% | 13.12% | 2.85% | 1.86% | 19.99% | 15.22% | 97.1% | 92.9% |