Adobe Inc. — ADBE
| Close Price | Market Cap | P/E Ratio | Forward P/E Ratio | Implied Growth* | Implied Forward Growth* | Dividend | P/B Ratio |
|---|---|---|---|---|---|---|---|
| $259.21 | $104.77B | 15.1 | 9.8 | 8.7% | 4.3% | - | 9.2 |
Latest Headlines
- · Stocks Supported by Middle East Peace Hopes and AI Spending
- · How Is Adobe's Stock Performance Compared to Other Tech-Software Stocks?
- · Stock Indexes Rally to Record Highs on Peace Deal Hopes and AI Spending
- · Adobe (ADBE) is Future Proofing with AI Agents
- · Adobe’s Own AI Tool Is Destroying Its Own Stock Photo Business. Management Just Admitted It
- · Michael Burry Calls Adobe A ‘Fat Pitch’ In Latest Saas Analysis – Backs Firefly And AI Tie-Ups With OpenAI, Google
Revenue & Net Income
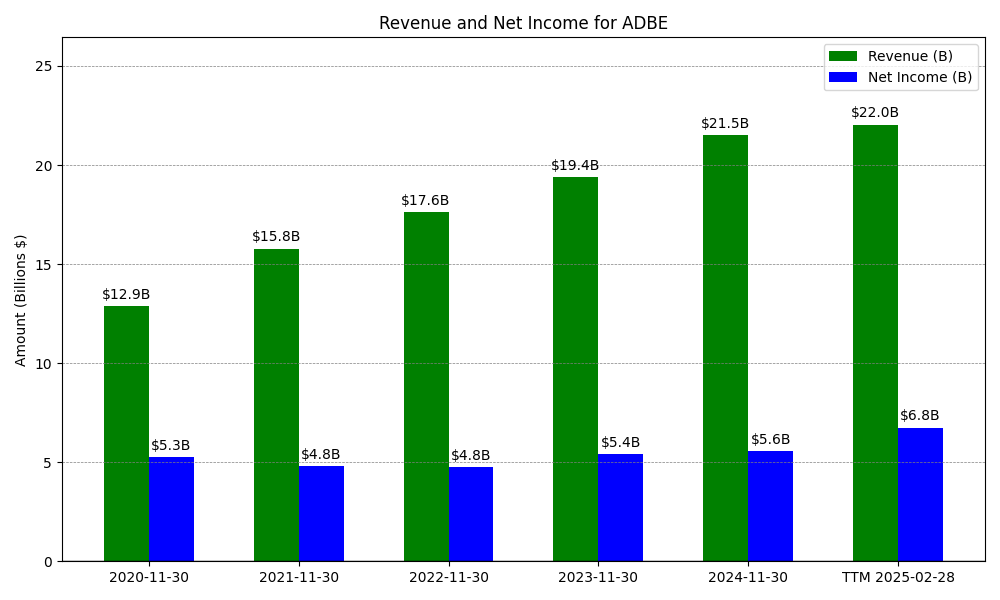
| Date | Revenue | Net_Income | EPS | Last_Updated | Revenue_Change | Net_Income_Change | EPS_Change | |
|---|---|---|---|---|---|---|---|---|
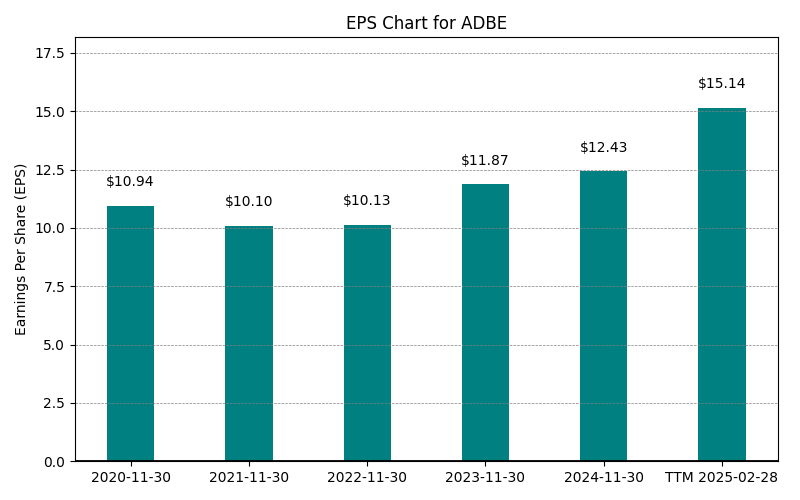
| 0 | 2020-11-30 | $12,868M | $5,260M | $10.94 | 2024-02-04 04:16:33 | N/A | N/A | N/A |
| 1 | 2021-11-30 | $15,785M | $4,822M | $10.10 | 2024-02-04 04:16:33 | 22.7% | -8.3% | -7.7% |
| 2 | 2022-11-30 | $17,606M | $4,756M | $10.13 | 2026-05-29 09:04:24 | 11.5% | -1.4% | 0.3% |
| 3 | 2023-11-30 | $19,409M | $5,428M | $11.87 | 2026-05-29 09:04:24 | 10.2% | 14.1% | 17.2% |
| 4 | 2024-11-30 | $21,505M | $5,560M | $12.43 | 2026-05-29 09:04:24 | 10.8% | 2.4% | 4.7% |
| 5 | 2025-11-30 | $23,769M | $7,130M | $16.73 | 2026-05-29 09:04:24 | 10.5% | 28.2% | 34.6% |
| 6 | TTM 2026-02-28 | $24,453M | $7,208M | $17.17 | 2026-03-17 08:40:24 | 2.9% | 1.1% | 2.6% |
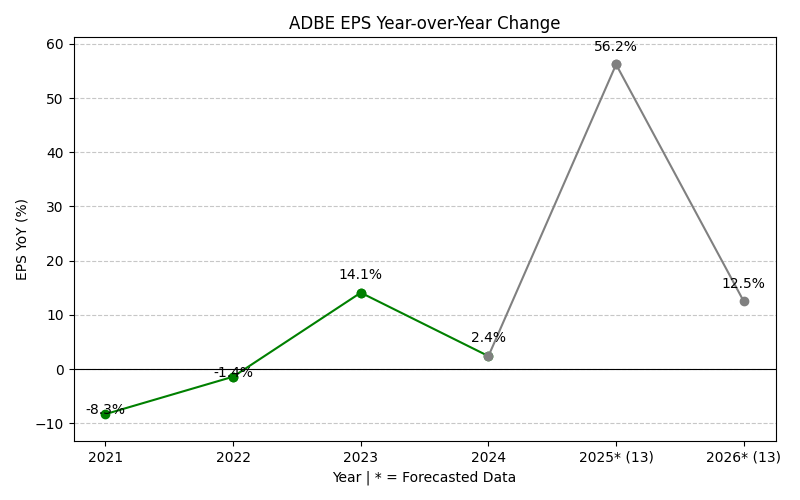
EPS
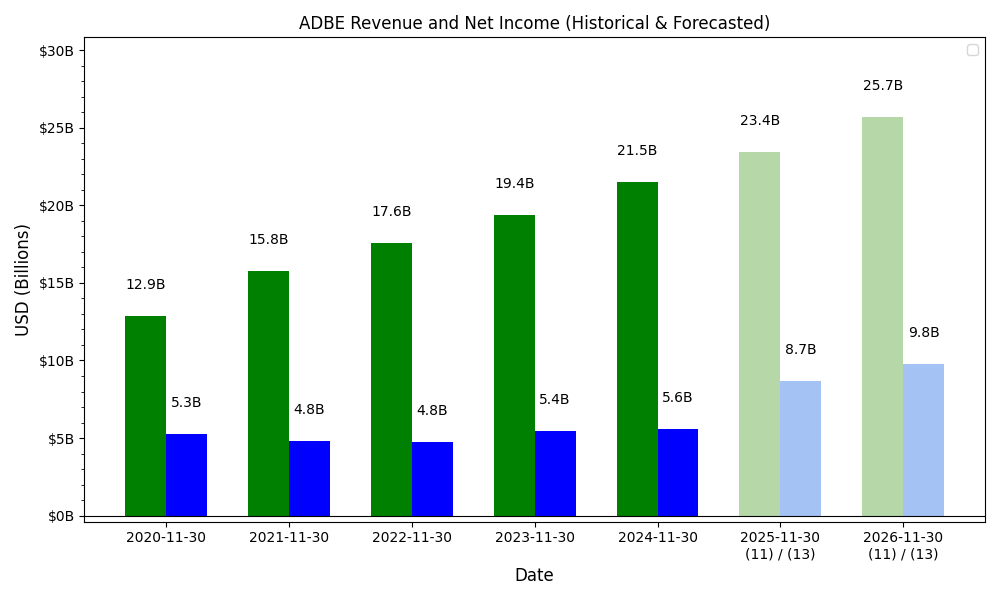
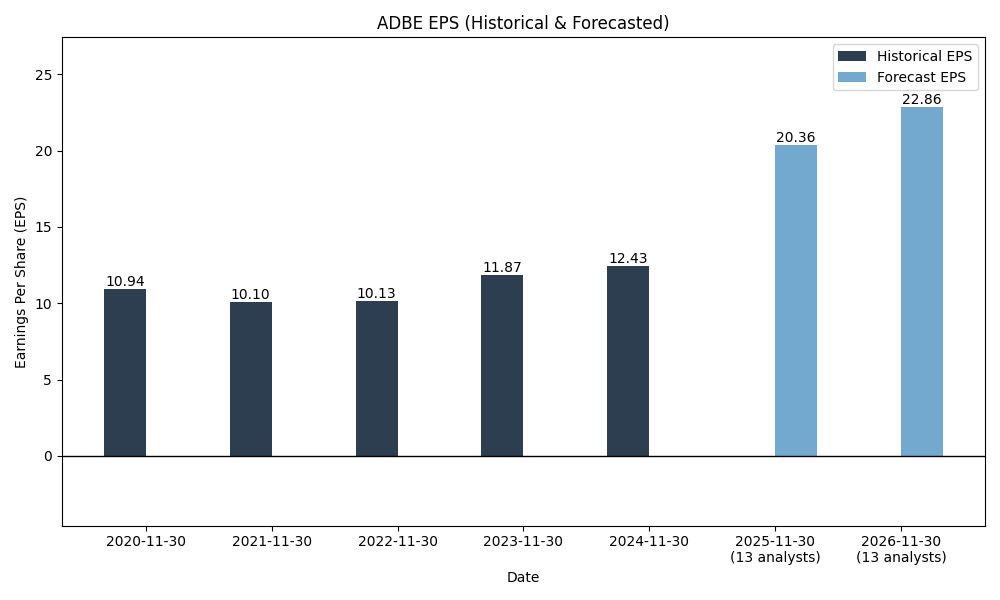
Forecasts
Y/Y % Change
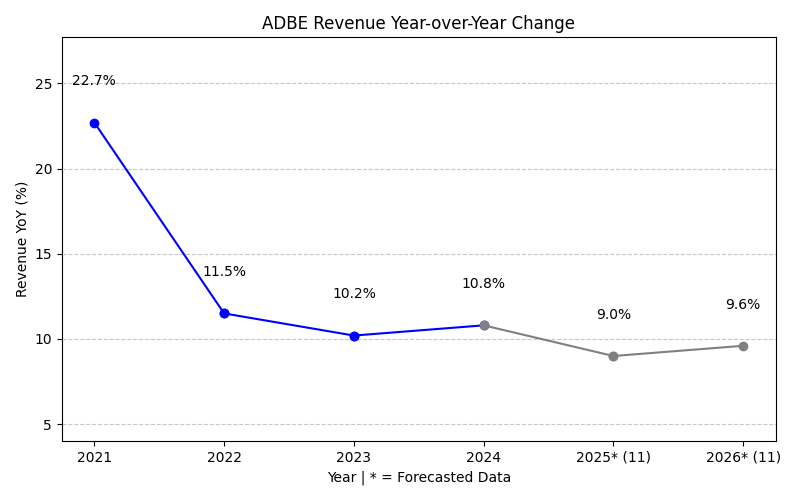
ADBE Year-over-Year Growth
| 2020 | 2021 | 2022 | 2023 | 2024 | 2025 | 2026 | 2027 | Average | |
|---|---|---|---|---|---|---|---|---|---|
| Revenue Growth (%) | 22.7% | 11.5% | 10.2% | 10.8% | 10.5% | 9.8% | 9.0% | 12.1% | |
| Revenue Analysts (#) | 0 | 0 | 0 | 0 | 0 | 0 | 37 | 37 | |
| EPS Growth (%) | -8.3% | -1.4% | 14.1% | 2.4% | 28.2% | 33.5% | 12.0% | 11.5% | |
| EPS Analysts (#) | 0 | 0 | 0 | 0 | 0 | 0 | 33 | 35 |
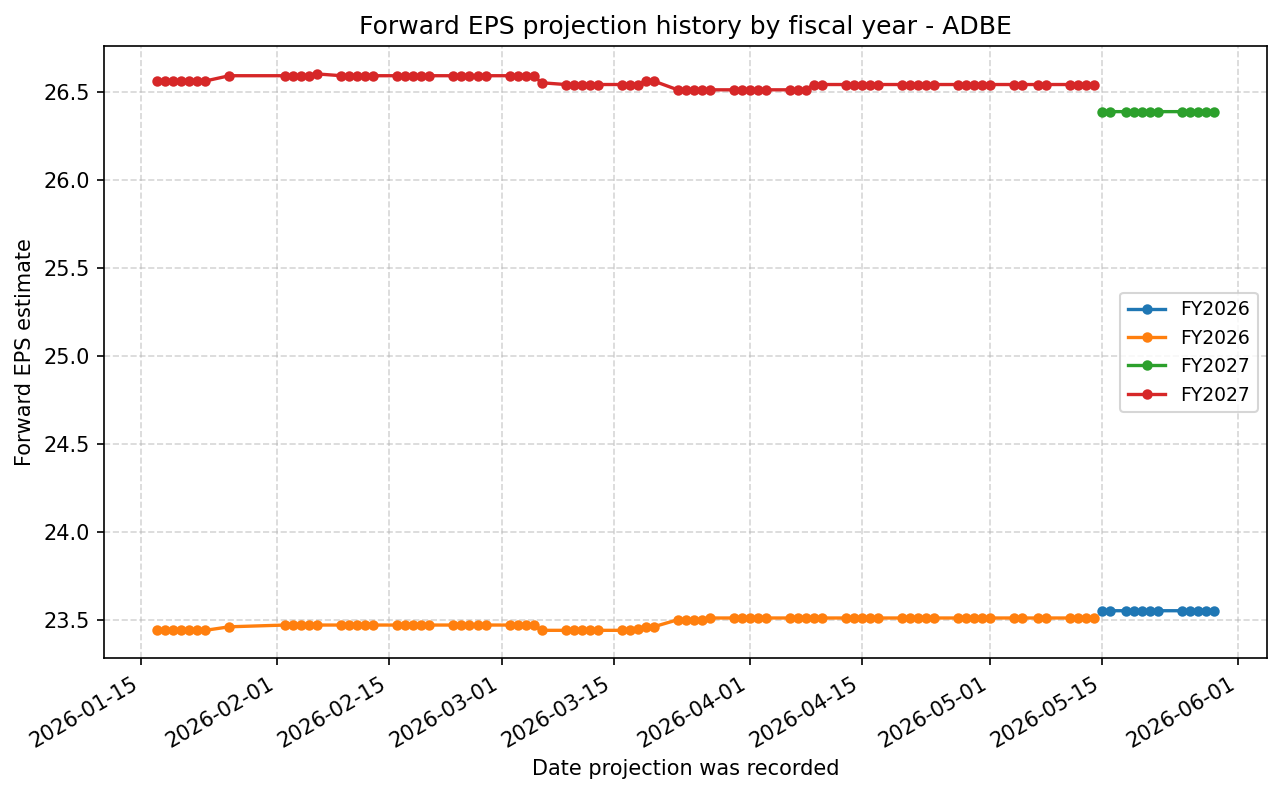
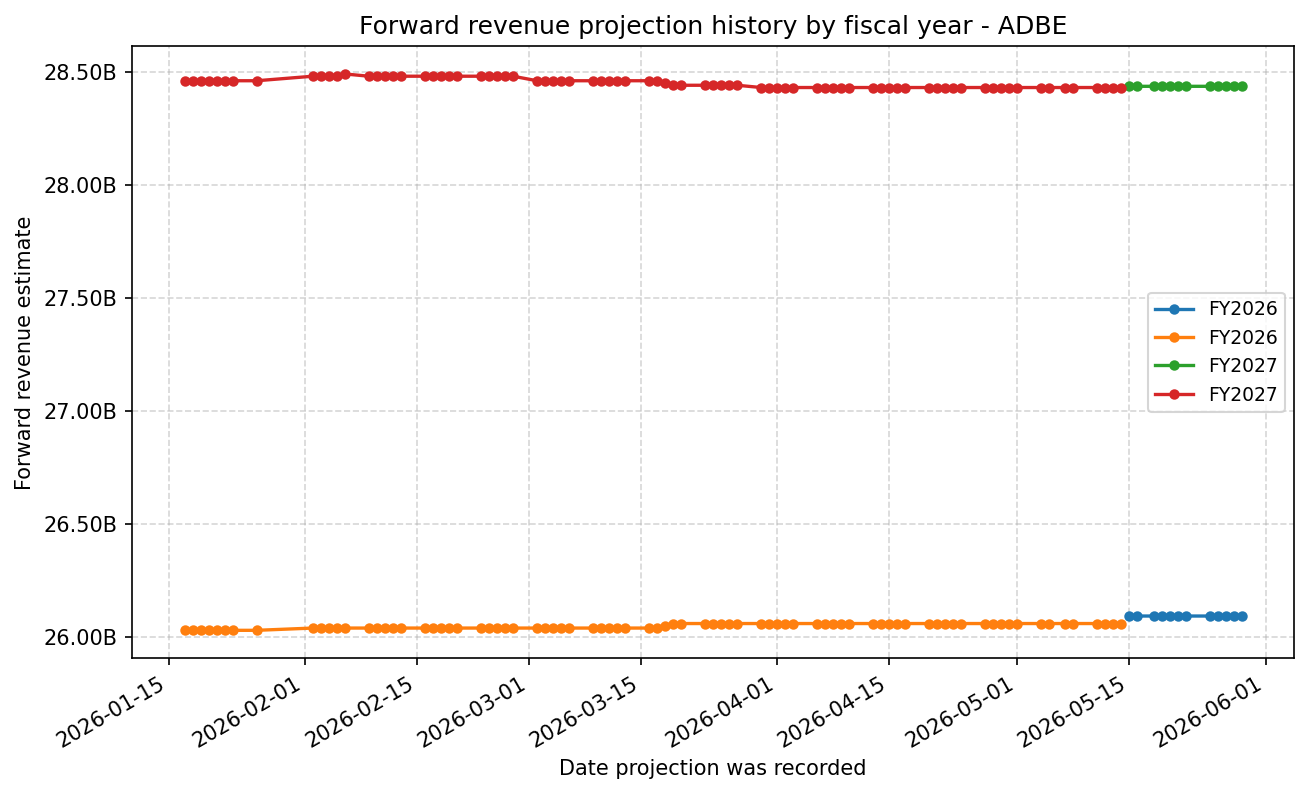
Forward Estimate History
How the next-FY EPS and revenue estimates have drifted over time. One line per fiscal year – past lines end when that FY became current.
Expenses
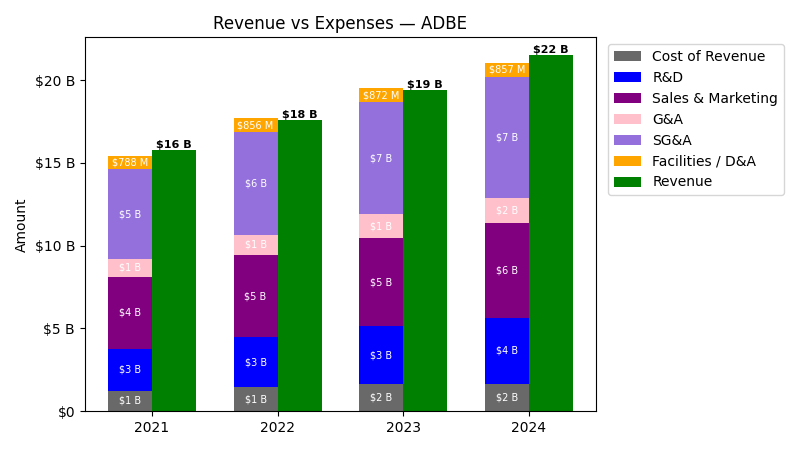
| Year | Revenue ($) | Cost of Revenue ($) | R&D ($) | Sales & Marketing ($) | G&A ($) | SG&A ($) | Facilities / D&A ($) |
|---|---|---|---|---|---|---|---|
| 2021 | $15.8B | $461.0M | $2.5B | $4.3B | $1.1B | $5.4B | $788.0M |
| 2022 | $17.6B | $622.0M | $3.0B | $5.0B | $1.2B | $6.2B | $856.0M |
| 2023 | $19.4B | $778.0M | $3.5B | $5.4B | $1.4B | $6.8B | $872.0M |
| 2024 | $21.5B | $813.0M | $3.9B | $5.8B | $1.5B | $7.3B | $857.0M |
| 2025 | $23.8B | $1.1B | $4.3B | $6.5B | $1.6B | $8.1B | $818.0M |
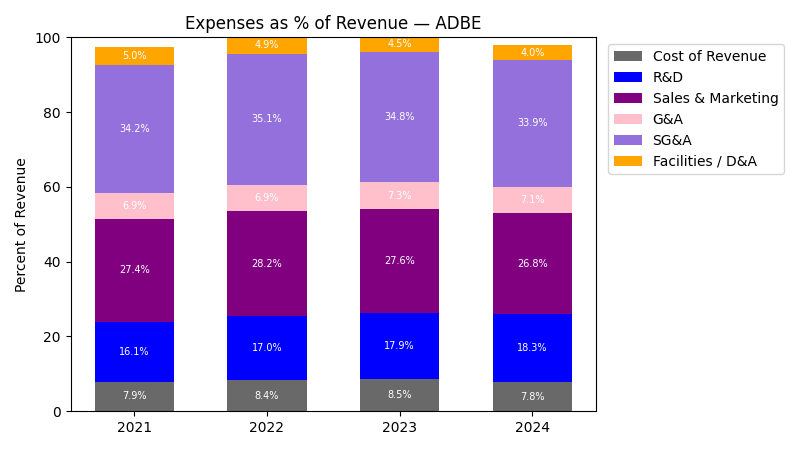
| Year | Revenue Change (%) | Cost of Revenue Change (%) | R&D Change (%) | Sales & Marketing Change (%) | G&A Change (%) | SG&A Change (%) | Facilities / D&A Change (%) |
|---|---|---|---|---|---|---|---|
| 2022 | 11.54 | 34.92 | 17.60 | 14.97 | 12.35 | 14.45 | 8.63 |
| 2023 | 10.24 | 25.08 | 16.27 | 7.71 | 15.91 | 9.33 | 1.87 |
| 2024 | 10.80 | 4.50 | 13.56 | 7.72 | 8.21 | 7.82 | -1.72 |
| 2025 | 10.53 | 31.86 | 8.87 | 12.56 | 2.88 | 10.53 | -4.55 |
No unmapped expenses.
Segment Performance
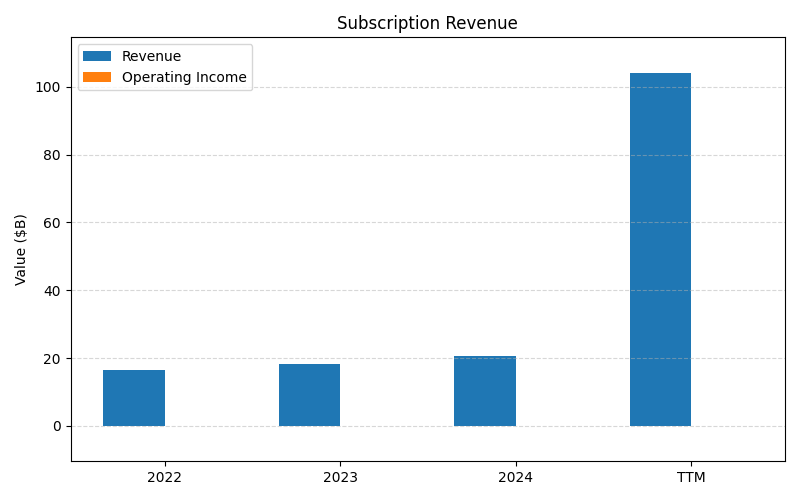
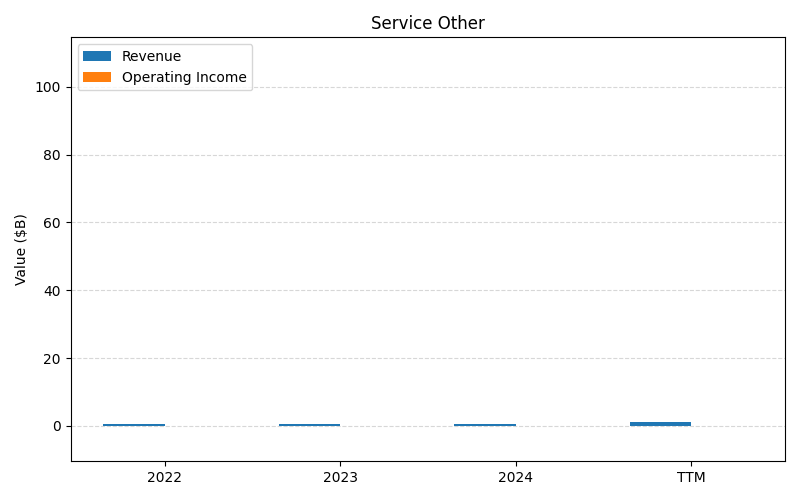
SEGMENTS v2025-09-09 · 2026-05-29 09:04 UTC — Units: $B. Rows list fiscal years (last 3 + TTM) with revenue for each segment; the final row shows the TTM revenue mix (operating income columns display “—” where mix is not applicable).
| Year | Subscription Revenue Rev | Service Other Rev | Prod Rev | Total Rev |
|---|---|---|---|---|
| 2023 | 91.2B | 0.67B | 0.46B | 92.3B |
| 2024 | 102.4B | 0.60B | 0.39B | 103.4B |
| 2025 | 114.3B | 0.54B | 0.33B | 115.2B |
| TTM | 263.4B | 1.38B | 0.90B | 265.6B |
| % of Total (TTM) | 99.1% | 0.5% | 0.3% | 100% |
Segment Performance (Axis 2)
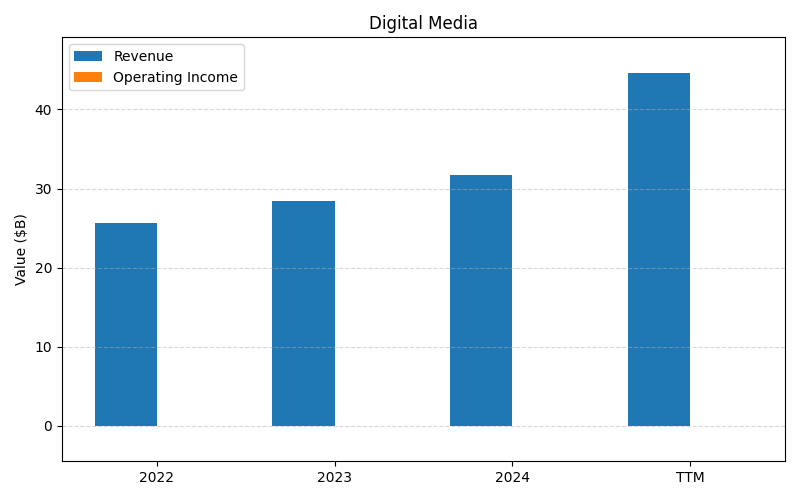
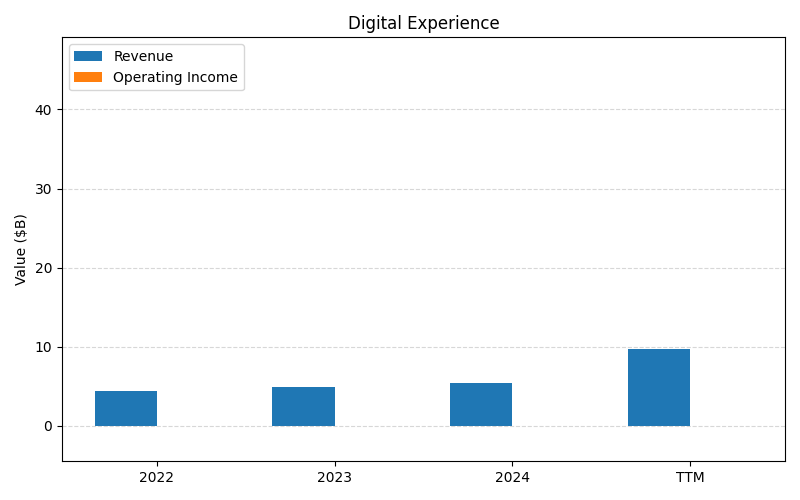
SEGMENTS v2025-09-09 · 2026-05-29 09:04 UTC — Units: $B. Rows list fiscal years (last 3 + TTM) with revenue for each segment; the final row shows the TTM revenue mix (operating income columns display “—” where mix is not applicable).
| Year | Digital Media Rev | Digital Experience Rev | Publishing And Advertising Rev | Total Rev |
|---|---|---|---|---|
| 2023 | 14.2B | 4.89B | 0.30B | 19.4B |
| 2024 | 15.9B | 5.37B | 0.28B | 21.5B |
| 2025 | 17.6B | 5.86B | 0.26B | 23.8B |
Balance Sheet
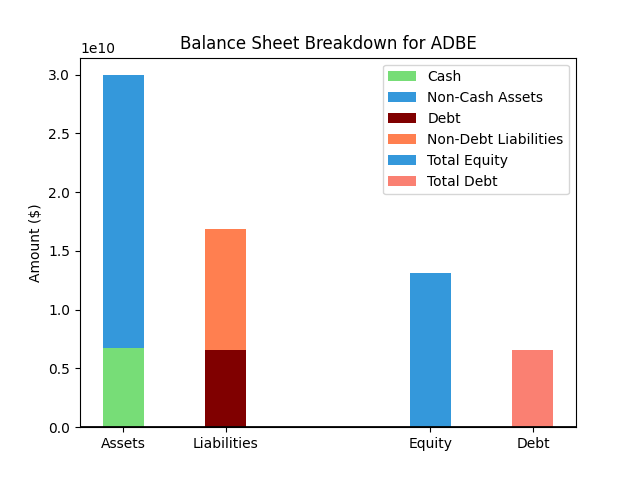
| Metric | Value | |
|---|---|---|
| 0 | Total Assets | $29,704M |
| 1 | Cash | $6,332M |
| 2 | Total Liabilities | $18,271M |
| 3 | Total Debt | $6,656M |
| 4 | Total Equity | $11,433M |
| 5 | Debt to Equity Ratio | 0.58 |
EPS & Dividend

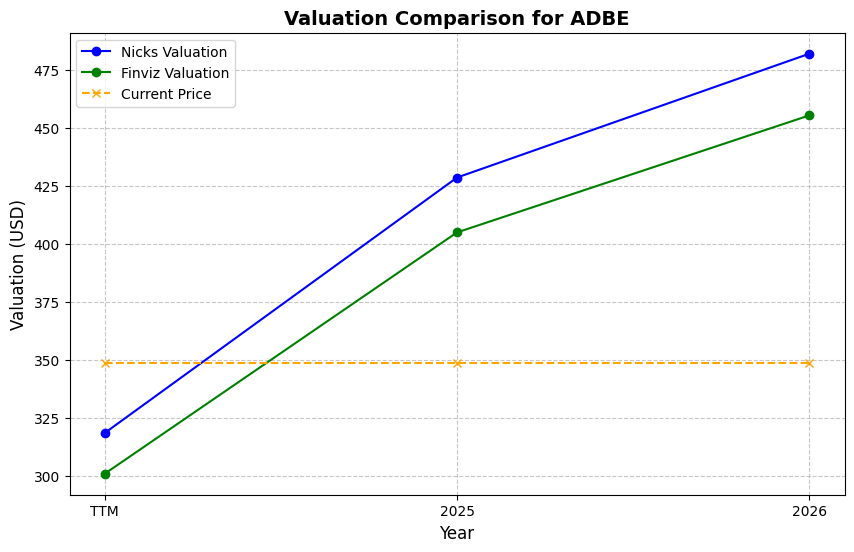
Valuation
| Share Price | Treasury Yield | Estimates | Fair Value (P/E) | Fair Value (P/S) | Current P/S | Current P/E |
|---|---|---|---|---|---|---|
| $259.21 | 4.5% | Nicks Growth: 12% Nick's Expected Margin: 25% FINVIZ Growth: 12% |
Nicks: 21 Finviz: 21 |
Nick's: 5.175 | 4.3 | 15.1 |
| Basis | Year | Nicks Valuation | Nicks vs Share Price | Finviz Valuation | Finviz vs Share Price |
|---|---|---|---|---|---|
| $17.17 EPS | TTM | $355.43 | 37.1% | $367.51 | 41.8% |
| $23.55 EPS | 2026 | $487.52 | 88.1% | $504.09 | 94.5% |
| $26.39 EPS | 2027 | $546.21 | 110.7% | $564.77 | 117.9% |
Implied Growth
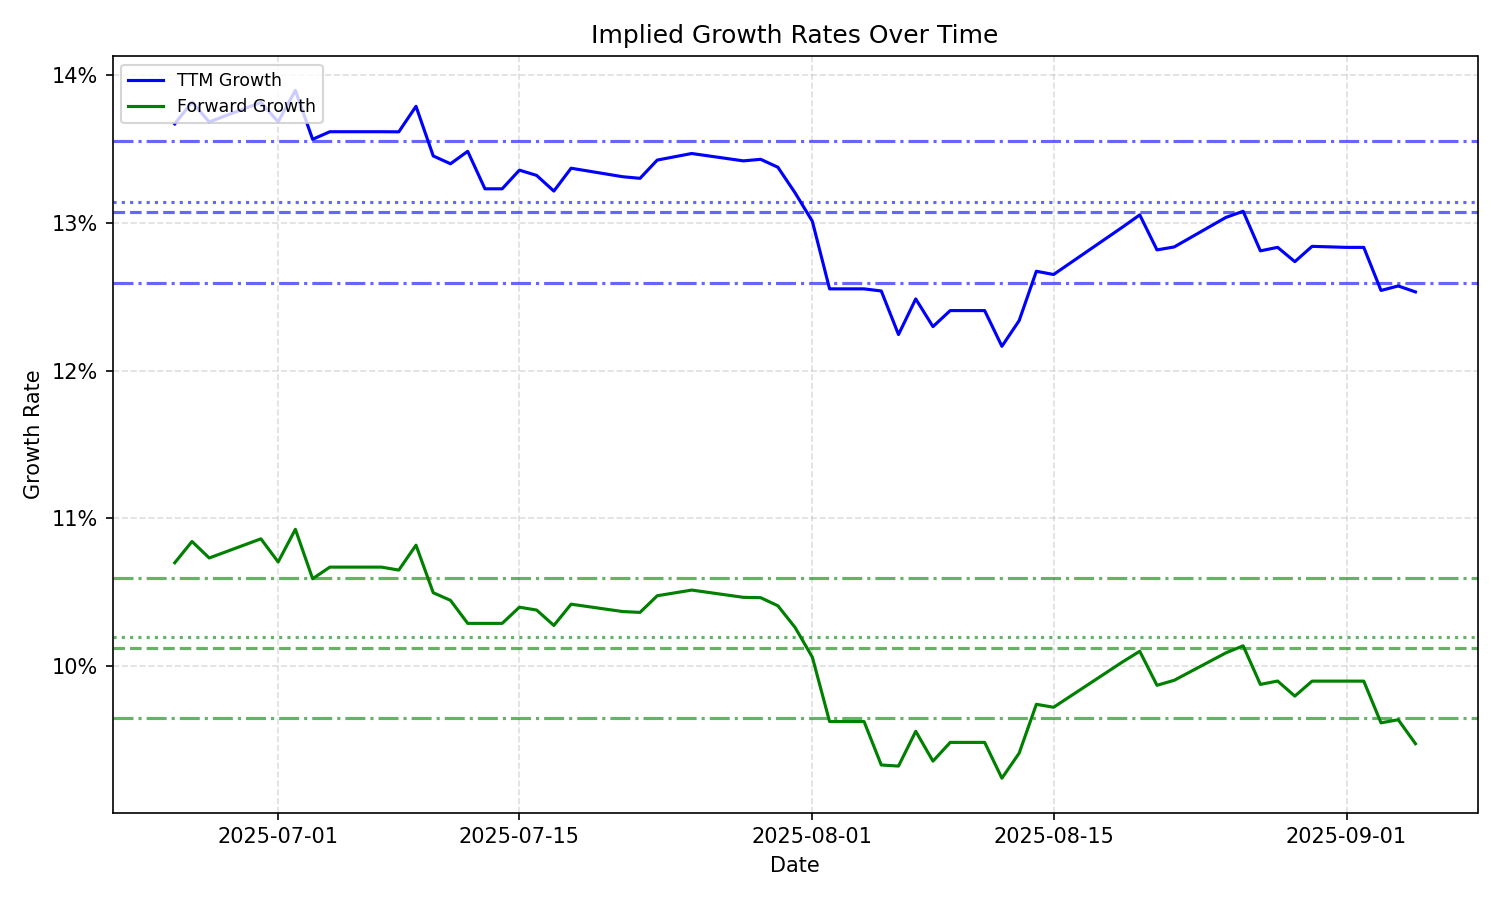
| Average | Median | Std Dev | Current | Percentile | ||||||
|---|---|---|---|---|---|---|---|---|---|---|
| TTM | Forward | TTM | Forward | TTM | Forward | TTM | Forward | TTM | Forward | |
| Timeframe | ||||||||||
| 1 Year | 10.88% | 7.29% | 11.55% | 8.76% | 2.04% | 2.76% | 7.92% | 3.57% | 11.2% | 11.2% |
| 3 Years | 10.88% | 7.29% | 11.55% | 8.76% | 2.04% | 2.76% | 7.92% | 3.57% | 11.2% | 11.2% |
| 5 Years | 10.88% | 7.29% | 11.55% | 8.76% | 2.04% | 2.76% | 7.92% | 3.57% | 11.2% | 11.2% |
| 10 Years | 10.88% | 7.29% | 11.55% | 8.76% | 2.04% | 2.76% | 7.92% | 3.57% | 11.2% | 11.2% |