AbbVie Inc. — ABBV
| Close Price | Market Cap | P/E Ratio | Forward P/E Ratio | Implied Growth* | Implied Forward Growth* | Dividend | P/B Ratio |
|---|---|---|---|---|---|---|---|
| $217.72 | $384.67B | 107.3 | 13.4 | 31.2% | 7.4% | $6.92 3.2% | -57.8 |
Latest Headlines
- · Three Stocks That May Be Trading Below Estimated Value In May 2026
- · AbbVie (ABBV) Up 3.5% Since Last Earnings Report: Can It Continue?
- · VYM Climbs 26% In a Year While Its Core Dividend Payers Extend Their Streaks
- · CooperVision Names Muru Annamalai as President, Asia-Pacific
- · AbbVie Announces European Commission Authorization of Expanded Label for VENCLYXTO® (venetoclax) to Include Additional Combinations in Previously Untreated Chronic Lymphocytic Leukemia
- · Discover May 2026's Stocks That Could Be Trading Below Estimated Value
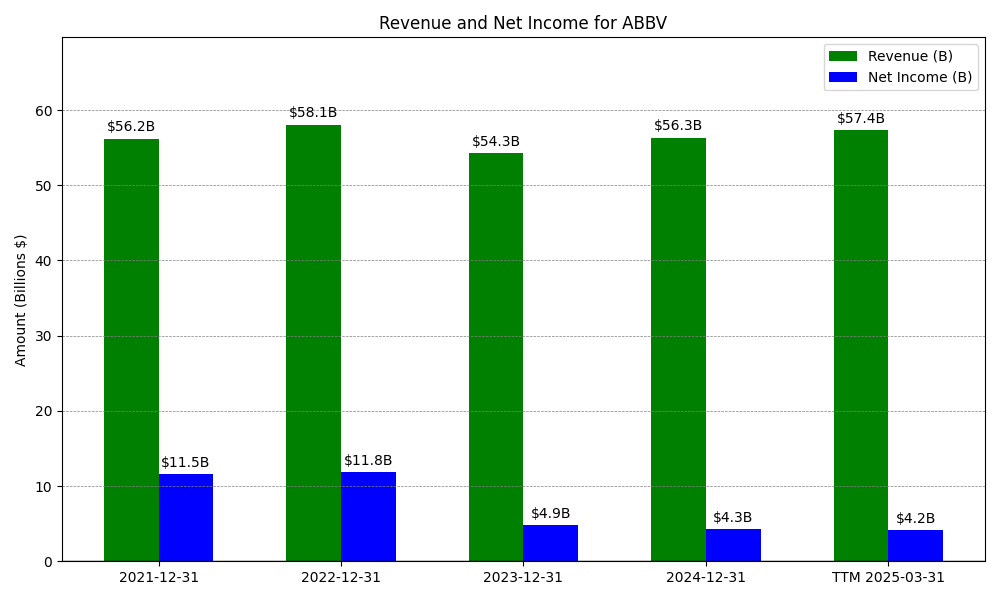
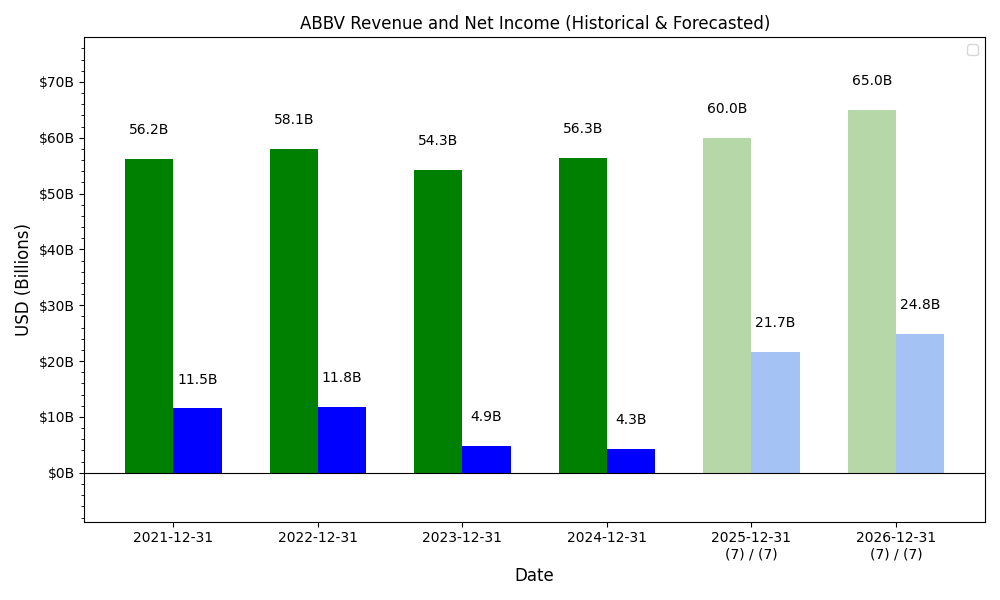
Revenue & Net Income
| Date | Revenue | Net_Income | EPS | Last_Updated | Revenue_Change | Net_Income_Change | EPS_Change | |
|---|---|---|---|---|---|---|---|---|
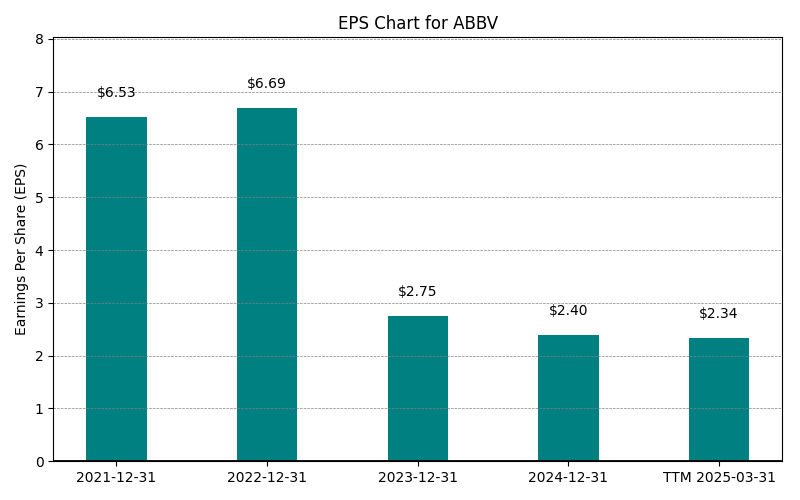
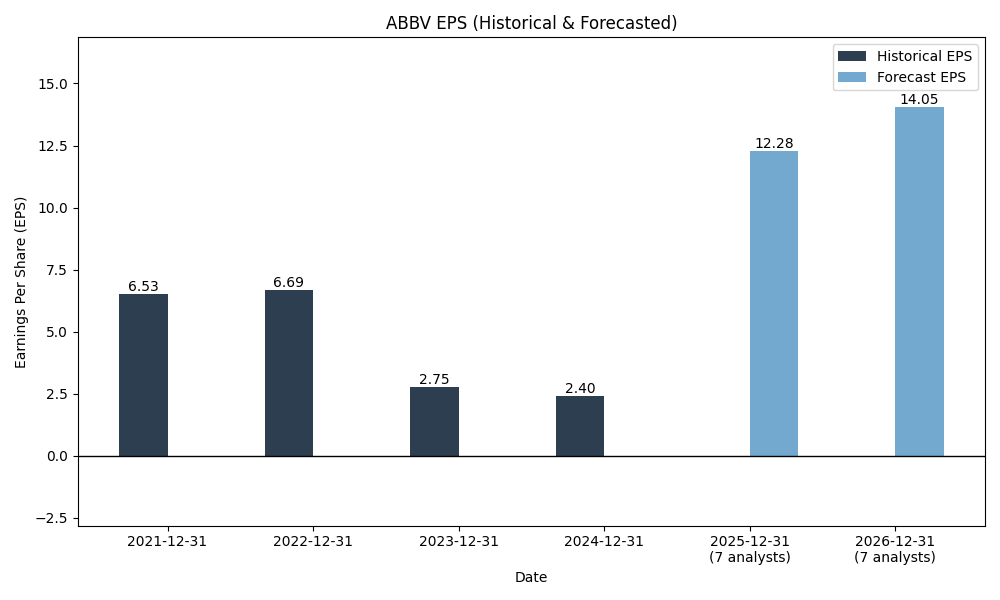
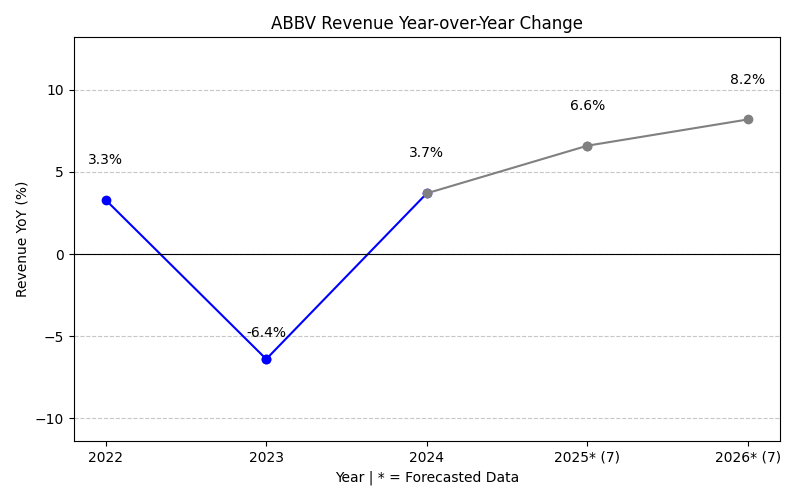
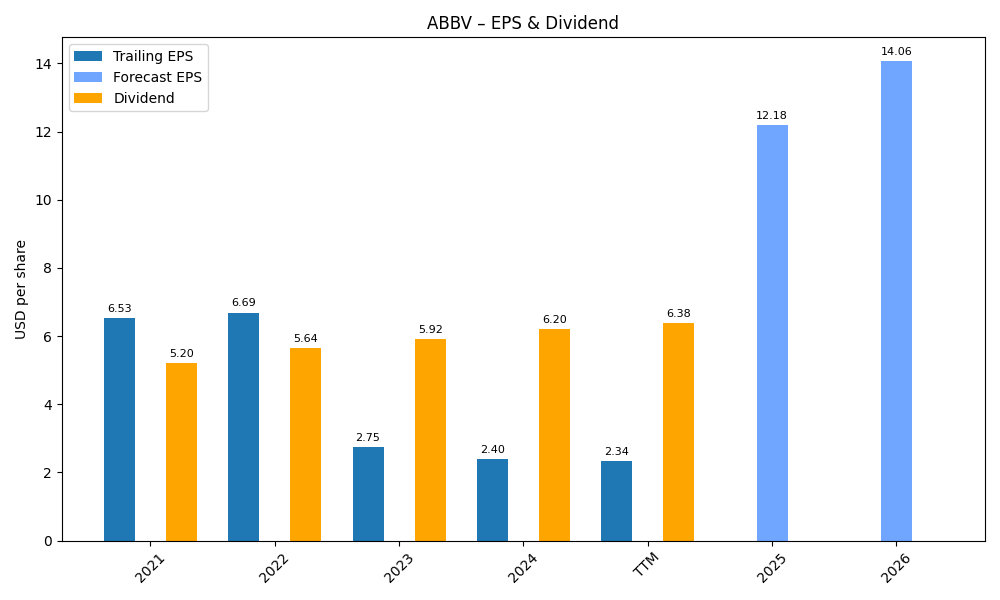
| 0 | 2021-12-31 | $56,197M | $11,542M | $6.69 | 2026-02-27 13:24:53 | N/A | N/A | N/A |
| 1 | 2022-12-31 | $58,054M | $11,836M | $6.69 | 2026-05-29 09:04:17 | 3.3% | 2.5% | 0.0% |
| 2 | 2023-12-31 | $54,318M | $4,863M | $2.75 | 2026-05-29 09:04:17 | -6.4% | -58.9% | -58.8% |
| 3 | 2024-12-31 | $56,334M | $4,278M | $2.42 | 2026-05-29 09:04:17 | 3.7% | -12.0% | -12.0% |
| 4 | 2025-12-31 | $61,160M | $4,226M | $2.37 | 2026-05-29 09:04:17 | 8.6% | -1.2% | -2.2% |
| 5 | TTM 2026-03-31 | $62,819M | $3,635M | $2.03 | 2026-05-01 08:37:07 | 2.7% | -14.0% | -14.3% |
EPS
Forecasts
Y/Y % Change

ABBV Year-over-Year Growth
| 2021 | 2022 | 2023 | 2024 | 2025 | 2026 | 2027 | Average | |
|---|---|---|---|---|---|---|---|---|
| Revenue Growth (%) | 3.3% | -6.4% | 3.7% | 8.6% | 9.9% | 8.1% | 4.5% | |
| Revenue Analysts (#) | 0 | 0 | 0 | 0 | 0 | 29 | 28 | |
| EPS Growth (%) | 2.5% | -58.9% | -12.0% | -1.2% | 495.2% | 14.0% | 73.3% | |
| EPS Analysts (#) | 0 | 0 | 0 | 0 | 0 | 32 | 31 |
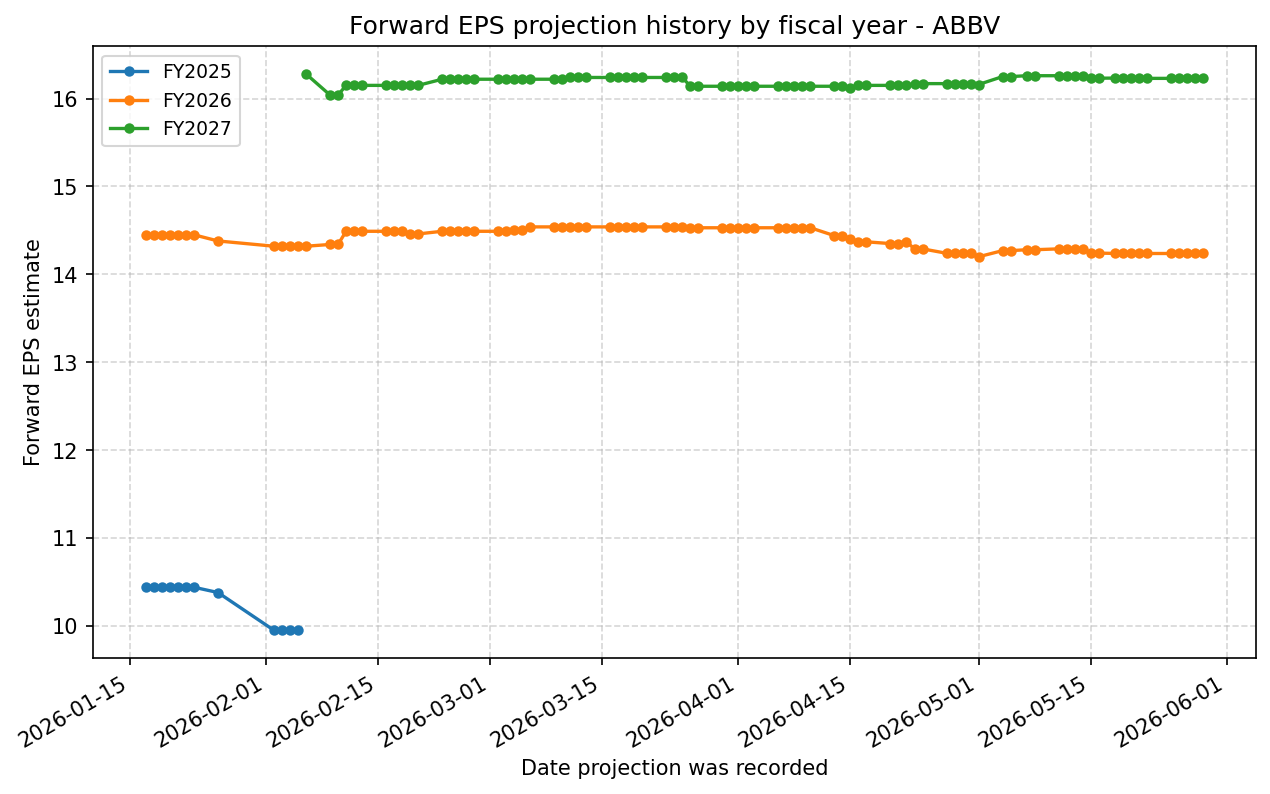
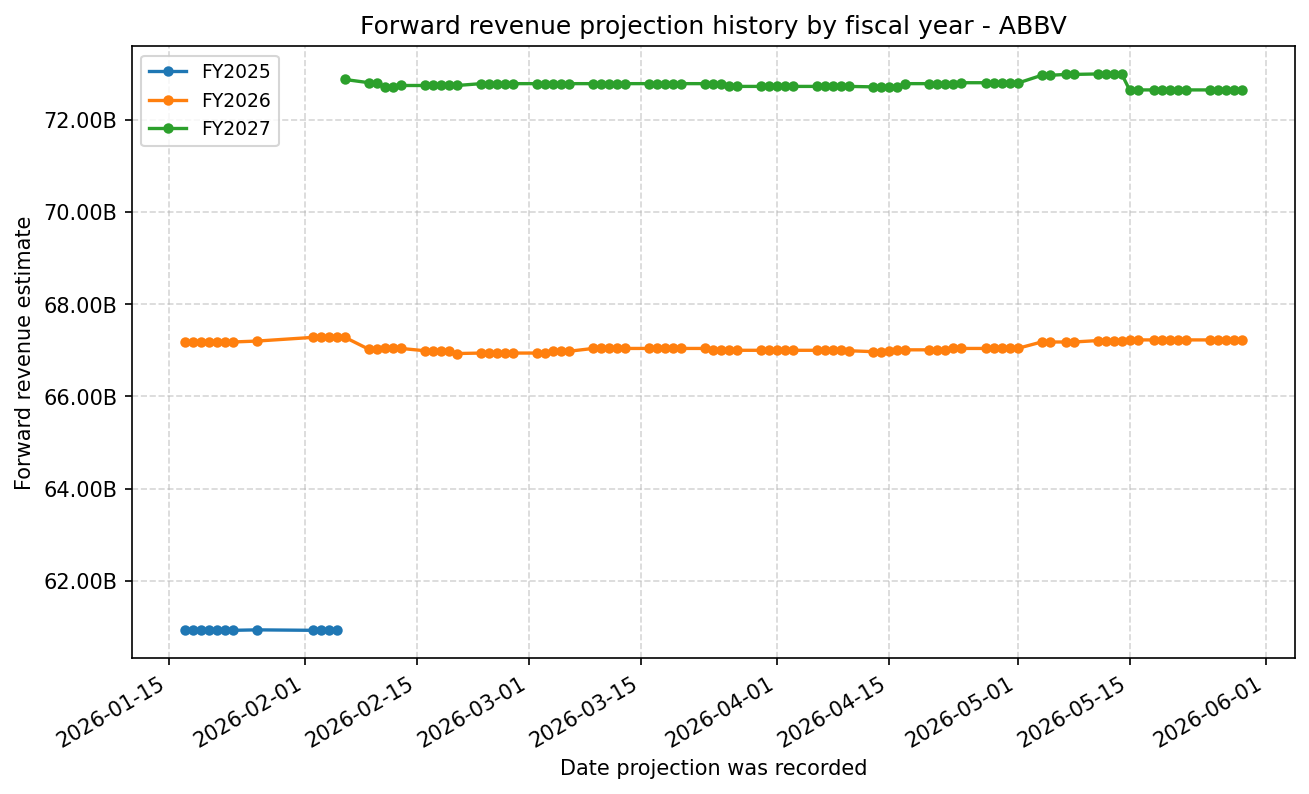
Forward Estimate History
How the next-FY EPS and revenue estimates have drifted over time. One line per fiscal year – past lines end when that FY became current.
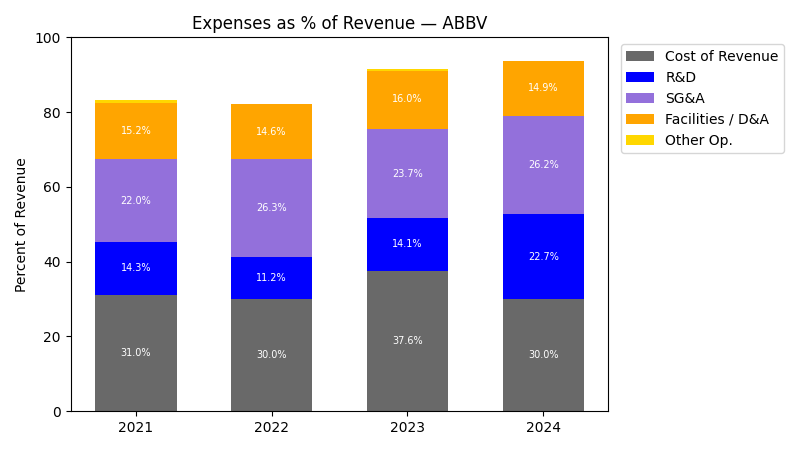
Expenses
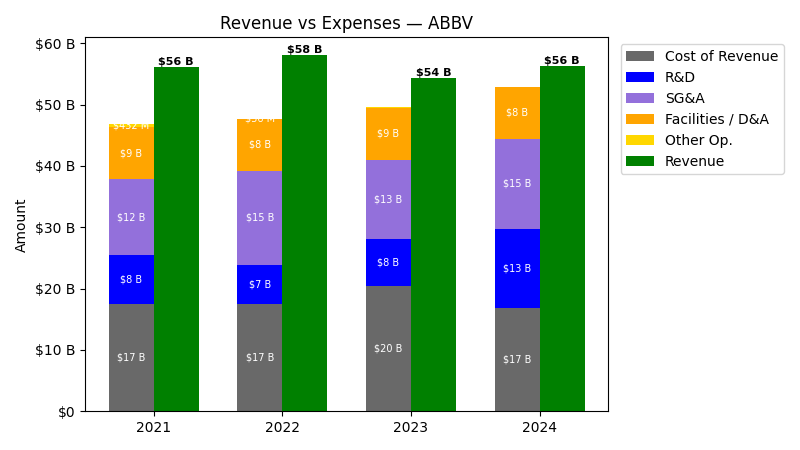
| Year | Revenue ($) | Cost of Revenue ($) | R&D ($) | SG&A ($) | Facilities / D&A ($) |
|---|---|---|---|---|---|
| 2021 | $56.2B | $8.9B | $8.0B | $12.3B | $8.5B |
| 2022 | $58.1B | $8.9B | $6.5B | $15.3B | $8.5B |
| 2023 | $54.3B | $11.7B | $7.7B | $12.9B | $8.7B |
| 2024 | $56.3B | $8.5B | $12.8B | $14.8B | $8.4B |
| 2025 | $61.2B | $10.1B | $9.1B | $14.0B | $8.1B |
| TTM | $62.8B | $10.4B | $9.5B | $14.3B | $8.0B |
| Year | Revenue Change (%) | Cost of Revenue Change (%) | R&D Change (%) | SG&A Change (%) | Facilities / D&A Change (%) |
|---|---|---|---|---|---|
| 2022 | 3.30 | 0.25 | -19.09 | 23.57 | -0.63 |
| 2023 | -6.44 | 30.96 | 17.90 | -15.65 | 2.73 |
| 2024 | 3.71 | -27.30 | 66.66 | 14.61 | -3.59 |
| 2025 | 8.57 | 18.16 | -28.89 | -5.03 | -2.95 |
| TTM | 2.71 | 3.17 | 4.45 | 2.03 | -1.27 |
No unmapped expenses.
Segment Performance
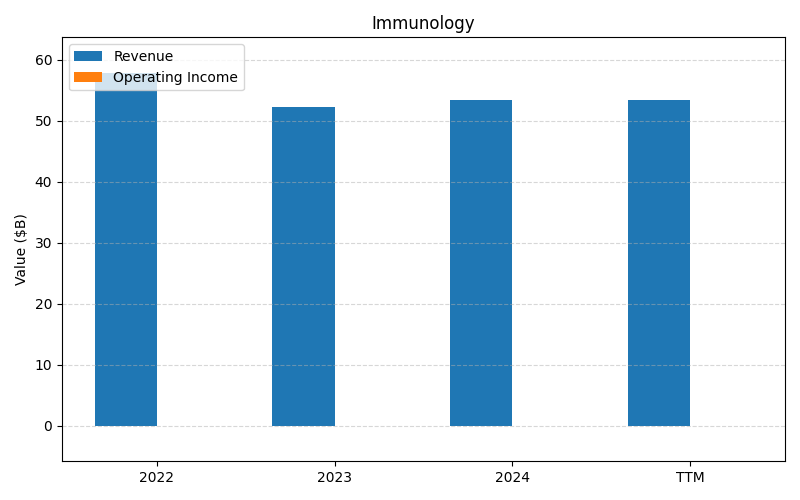
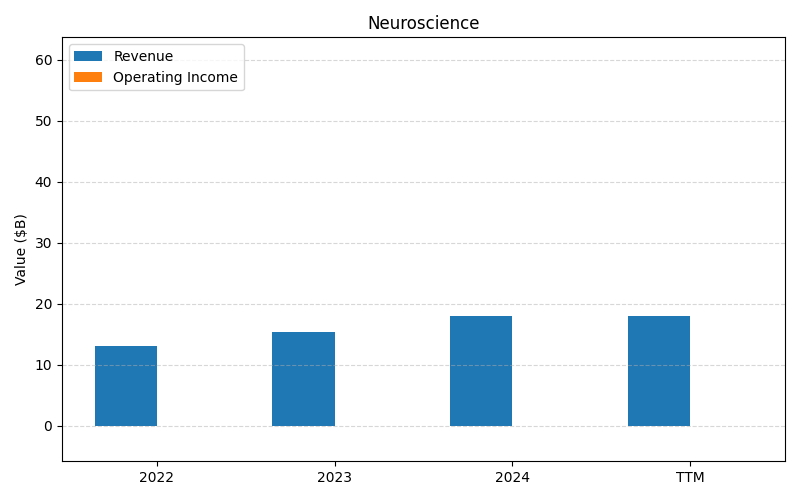
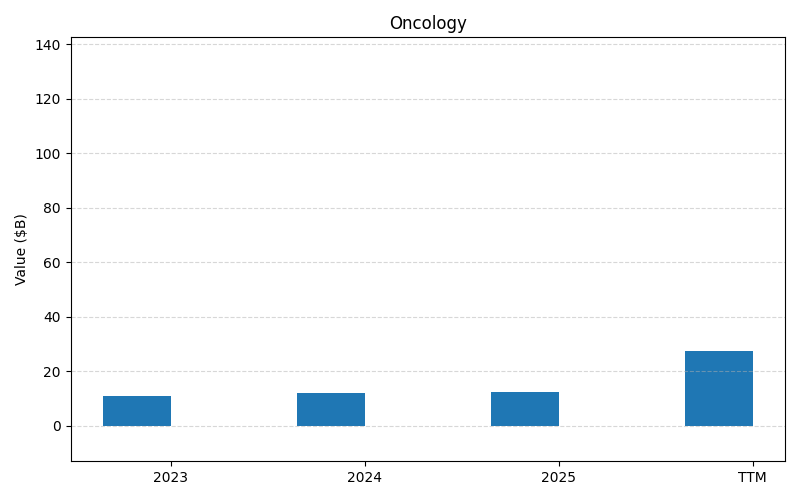
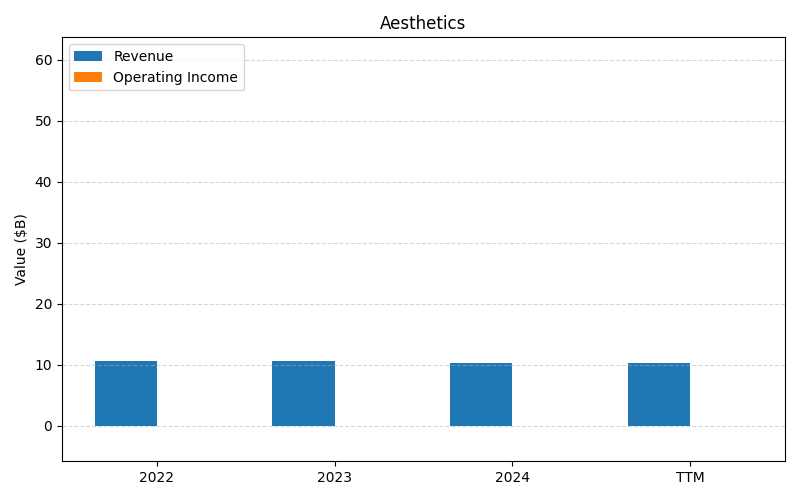
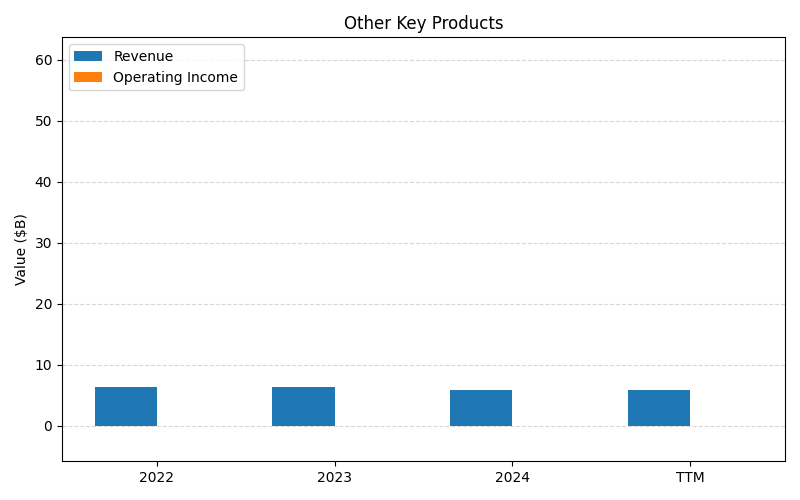
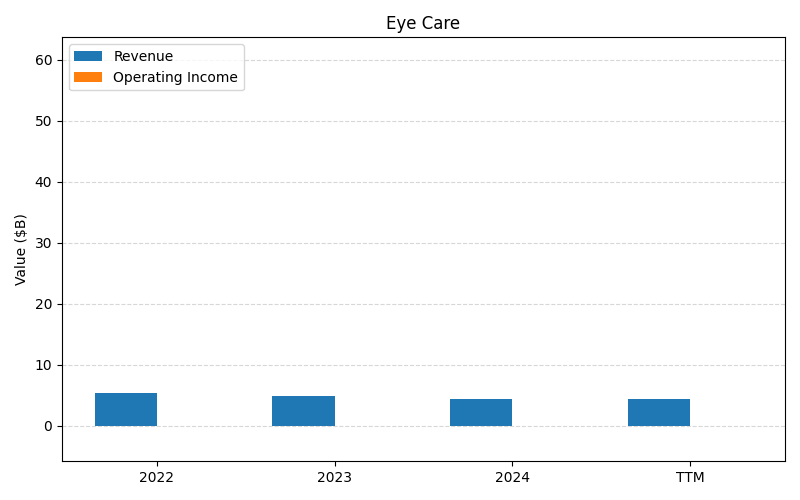
SEGMENTS v2025-09-09 · 2026-05-29 09:04 UTC — Units: $B. Rows list fiscal years (last 3 + TTM) with revenue for each segment; the final row shows the TTM revenue mix (operating income columns display “—” where mix is not applicable).
| Year | Immunology Rev | Neuroscience Rev | Oncology Rev | Aesthetics Rev | Other Key Products Rev | Eye Care Rev | Total Rev |
|---|---|---|---|---|---|---|---|
| 2023 | 52.3B | 15.4B | 10.9B | 10.6B | 6.34B | 4.83B | 100.3B |
| 2024 | 53.4B | 18B | 12.1B | 10.4B | 5.91B | 4.48B | 104.2B |
| 2025 | 60.8B | 21.5B | 12.3B | 9.72B | 5.96B | 4.22B | 114.5B |
| TTM | 129.5B | 45.2B | 27.6B | 22.4B | 13B | – | 237.6B |
| % of Total (TTM) | 54.5% | 19.0% | 11.6% | 9.4% | 5.5% | – | 100% |
Balance Sheet
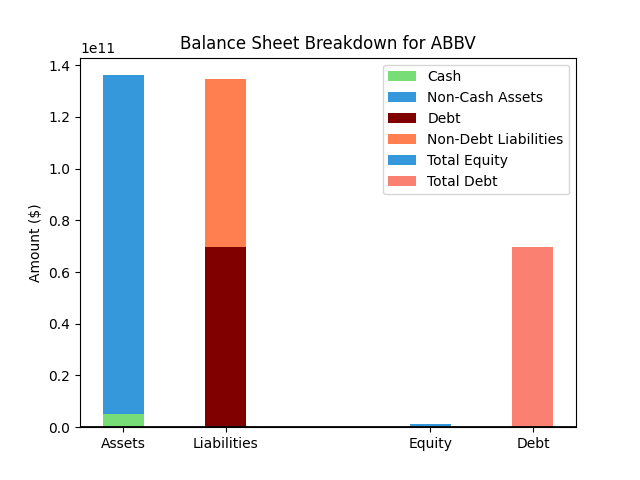
| Metric | Value | |
|---|---|---|
| 0 | Total Assets | $136,463M |
| 1 | Cash | $9,391M |
| 2 | Total Liabilities | $143,075M |
| 3 | Total Debt | $72,858M |
| 4 | Total Equity | $-6,656M |
| 5 | Debt to Equity Ratio | -10.95 |
EPS & Dividend
Valuation
| Share Price | Treasury Yield | Estimates | Fair Value (P/E) | Fair Value (P/S) | Current P/S | Current P/E |
|---|---|---|---|---|---|---|
| $217.72 | 4.5% | FINVIZ Growth: 21% | Nicks: 6 Finviz: 48 |
Nick's: 0.000 | 6.1 | 107.3 |
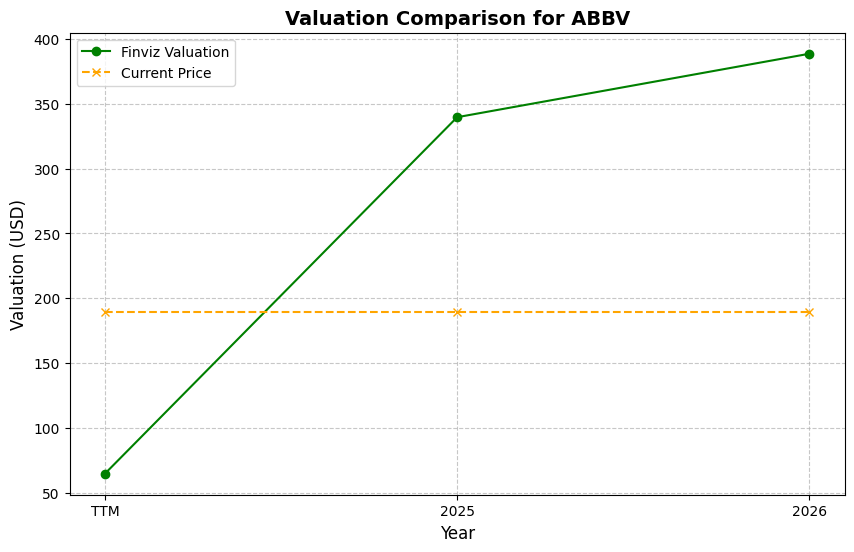
| Basis | Year | Nicks Valuation | Nicks vs Share Price | Finviz Valuation | Finviz vs Share Price |
|---|---|---|---|---|---|
| $2.03 EPS | TTM | $12.87 | -94.1% | $97.55 | -55.2% |
| $14.24 EPS | 2026 | $90.28 | -58.5% | $684.19 | 214.3% |
| $16.23 EPS | 2027 | $102.92 | -52.7% | $779.94 | 258.2% |
Implied Growth
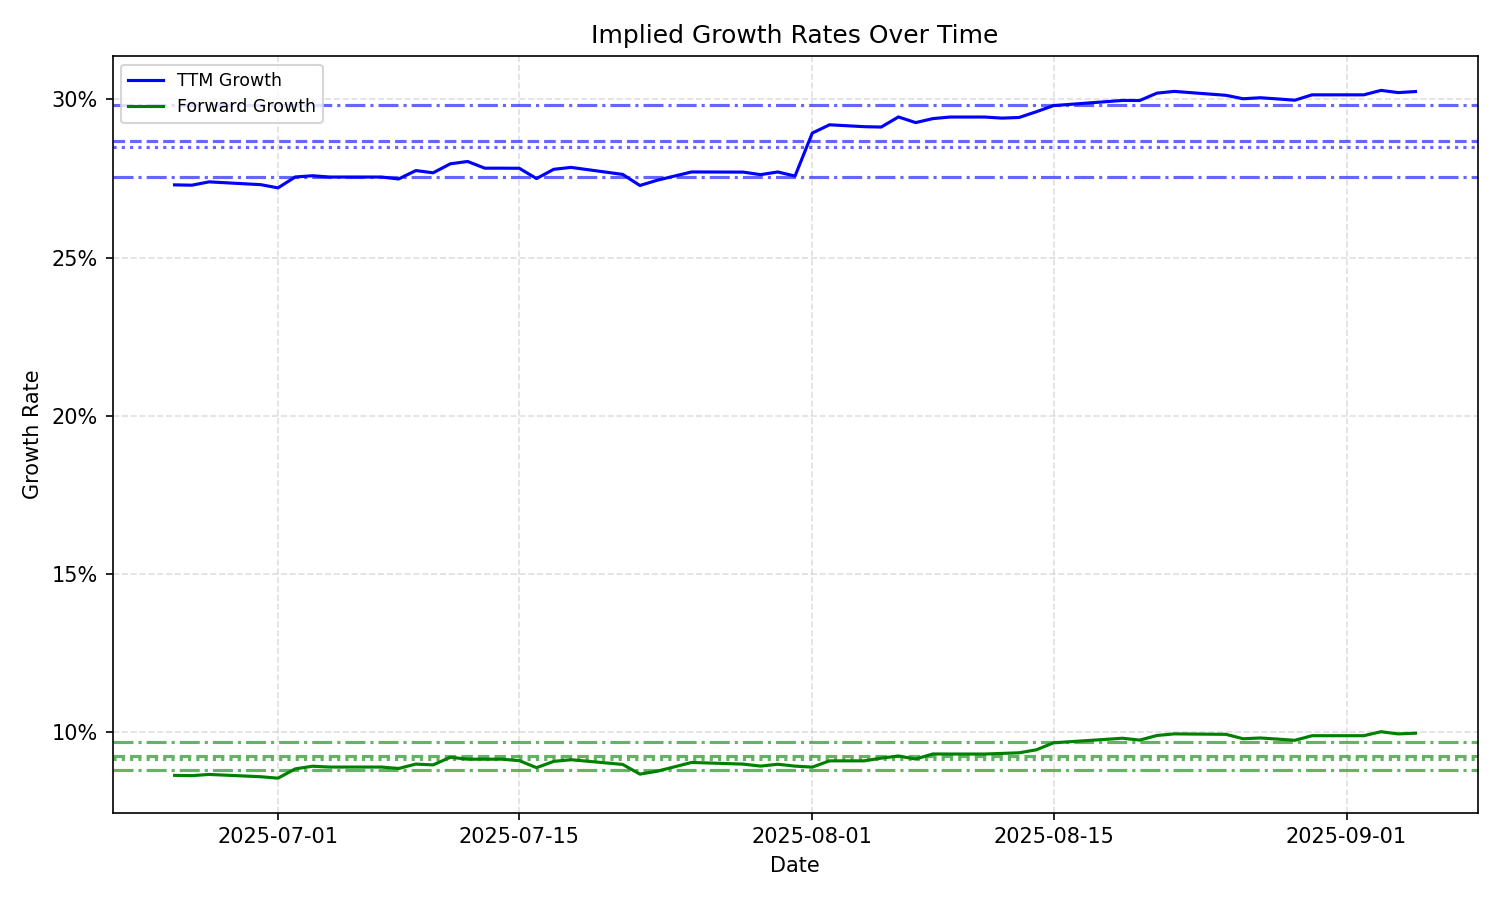
| Average | Median | Std Dev | Current | Percentile | ||||||
|---|---|---|---|---|---|---|---|---|---|---|
| TTM | Forward | TTM | Forward | TTM | Forward | TTM | Forward | TTM | Forward | |
| Timeframe | ||||||||||
| 1 Year | 31.28% | 8.88% | 30.14% | 8.99% | 3.32% | 1.37% | 31.28% | 7.48% | 74.9% | 24.3% |
| 3 Years | 31.28% | 8.88% | 30.14% | 8.99% | 3.32% | 1.37% | 31.28% | 7.48% | 74.9% | 24.3% |
| 5 Years | 31.28% | 8.88% | 30.14% | 8.99% | 3.32% | 1.37% | 31.28% | 7.48% | 74.9% | 24.3% |
| 10 Years | 31.28% | 8.88% | 30.14% | 8.99% | 3.32% | 1.37% | 31.28% | 7.48% | 74.9% | 24.3% |