Apple Inc. — AAPL
| Close Price | Market Cap | P/E Ratio | Forward P/E Ratio | Implied Growth* | Implied Forward Growth* | Dividend | P/B Ratio |
|---|---|---|---|---|---|---|---|
| $312.06 | $4.58T | 37.8 | 32.5 | 18.7% | 17.0% | $1.08 0.3% | 43.0 |
Latest Headlines
- · These 2 Tech Titans Just Declared Dividend Raises. Should You Buy One or Both?
- · Apple AI Shift And Huawei Chips Test Valuation And Growth Expectations
- · The Memory Shortage Is Just Beginning. The Consumer Pain Is Already Here.
- · Sell in May? You Would’ve Missed One of the S&P 500’s Best Mays Since the ‘50s.
- · Apple (AAPL) is a Great Momentum Stock: Should You Buy?
- · 3 Dow Jones Stocks to Consider Right Now
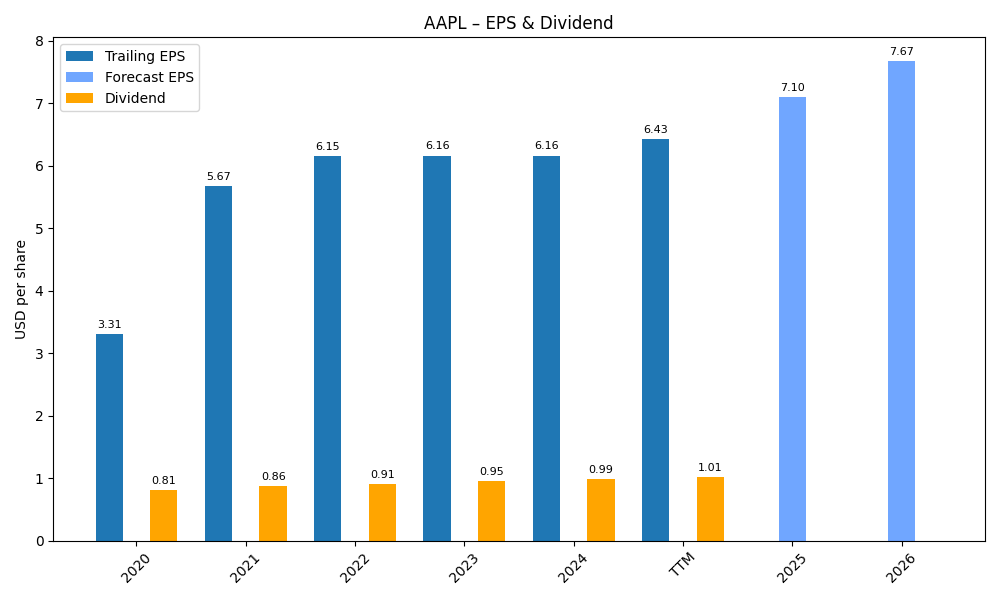
Revenue & Net Income
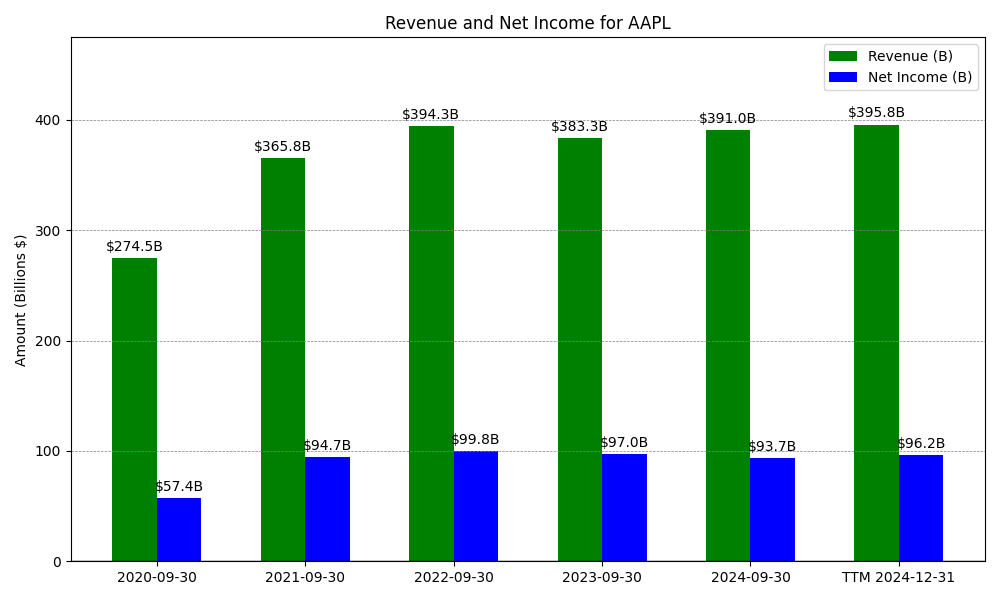
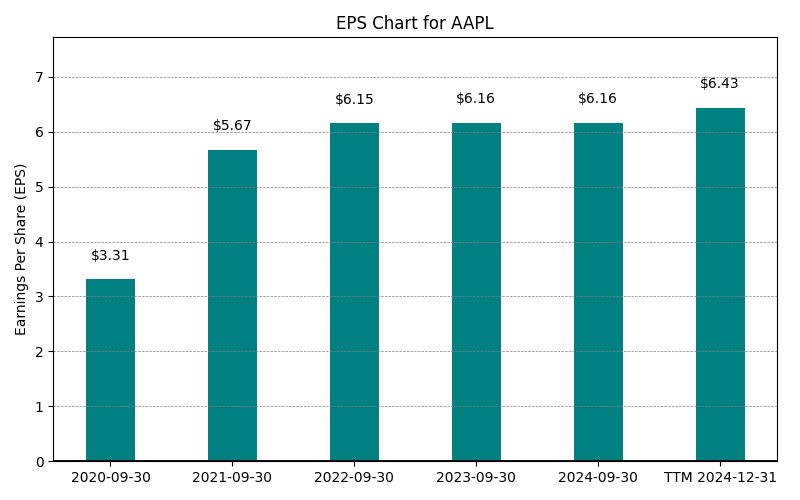
| Date | Revenue | Net_Income | EPS | Last_Updated | Revenue_Change | Net_Income_Change | EPS_Change | |
|---|---|---|---|---|---|---|---|---|
| 0 | 2020-09-30 | $274,515M | $57,411M | $3.31 | 2024-02-04 00:03:16 | N/A | N/A | N/A |
| 1 | 2021-09-30 | $365,817M | $94,680M | $5.67 | 2024-02-04 00:03:16 | 33.3% | 64.9% | 71.3% |
| 2 | 2022-09-30 | $394,328M | $99,803M | $6.15 | 2026-05-29 09:04:11 | 7.8% | 5.4% | 8.5% |
| 3 | 2023-09-30 | $383,285M | $96,995M | $6.16 | 2026-05-29 09:04:11 | -2.8% | -2.8% | 0.2% |
| 4 | 2024-09-30 | $391,035M | $93,736M | $6.11 | 2026-05-29 09:04:11 | 2.0% | -3.4% | -0.8% |
| 5 | 2025-09-30 | $416,161M | $112,010M | $7.49 | 2026-05-29 09:04:11 | 6.4% | 19.5% | 22.6% |
| 6 | TTM 2026-03-31 | $451,442M | $122,575M | $8.25 | 2026-05-04 08:48:14 | 8.5% | 9.4% | 10.1% |
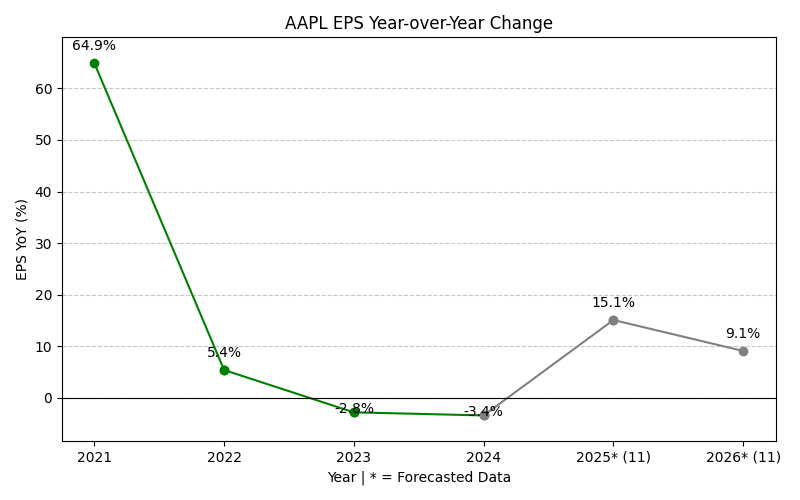
EPS
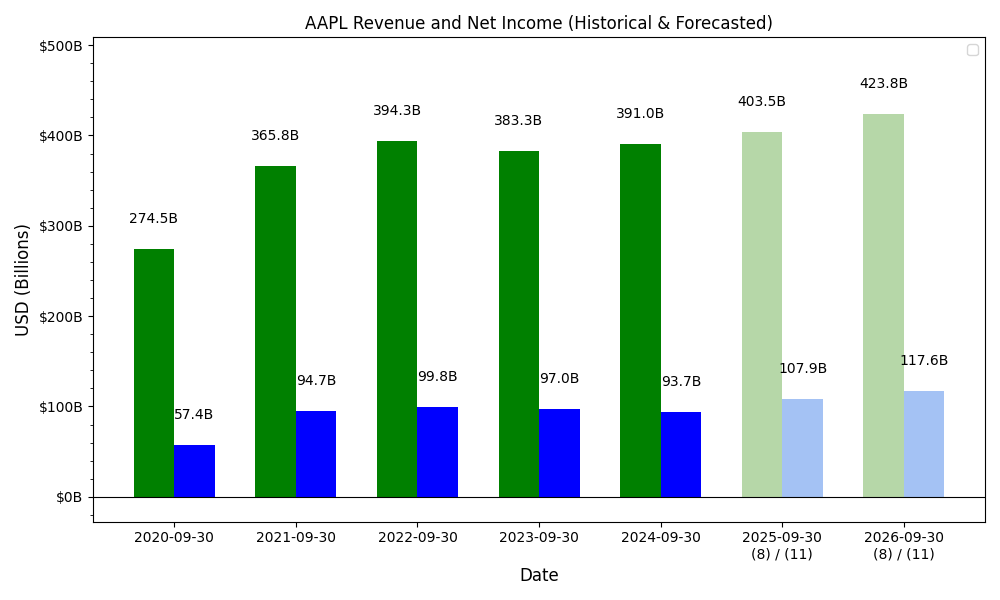
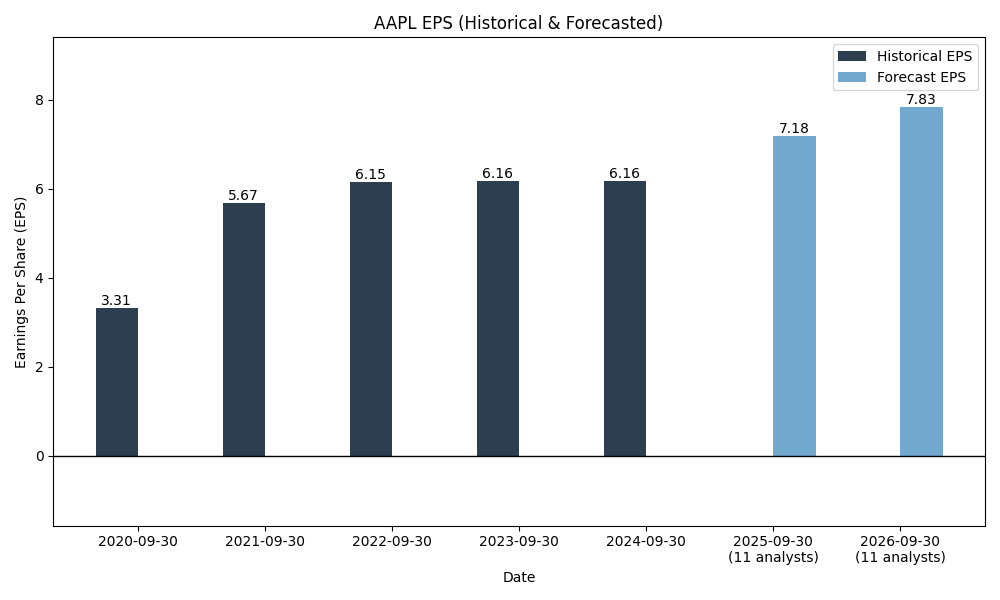
Forecasts
Y/Y % Change
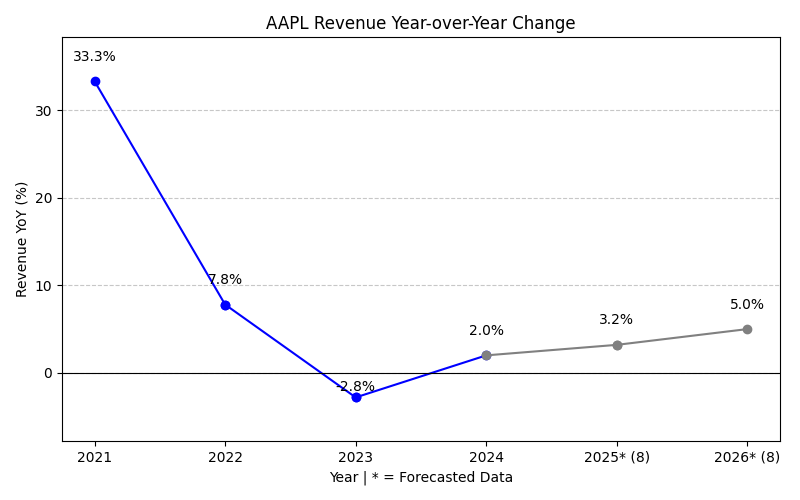
AAPL Year-over-Year Growth
| 2020 | 2021 | 2022 | 2023 | 2024 | 2025 | 2026 | 2027 | Average | |
|---|---|---|---|---|---|---|---|---|---|
| Revenue Growth (%) | 33.3% | 7.8% | -2.8% | 2.0% | 6.4% | 14.9% | 8.3% | 10.0% | |
| Revenue Analysts (#) | 0 | 0 | 0 | 0 | 0 | 0 | 37 | 42 | |
| EPS Growth (%) | 64.9% | 5.4% | -2.8% | -3.4% | 19.5% | 14.8% | 10.3% | 15.5% | |
| EPS Analysts (#) | 0 | 0 | 0 | 0 | 0 | 0 | 42 | 43 |
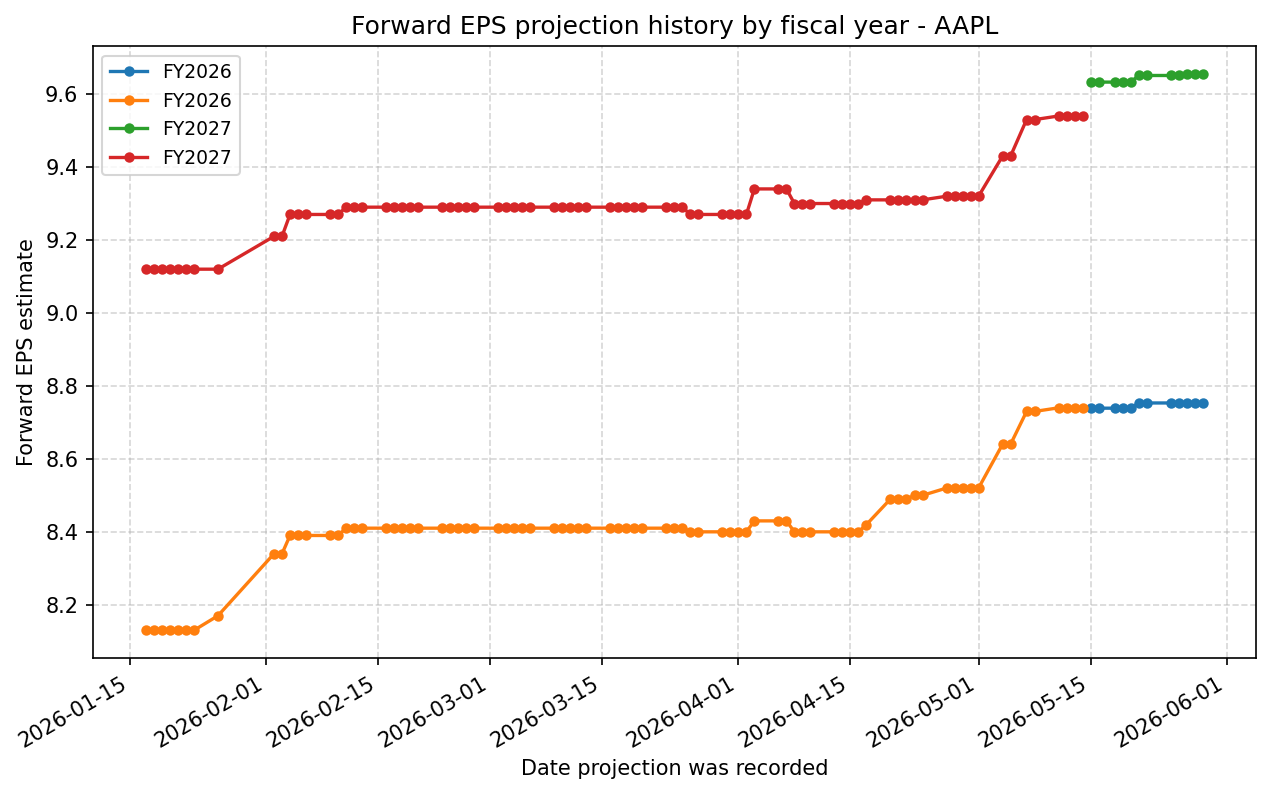
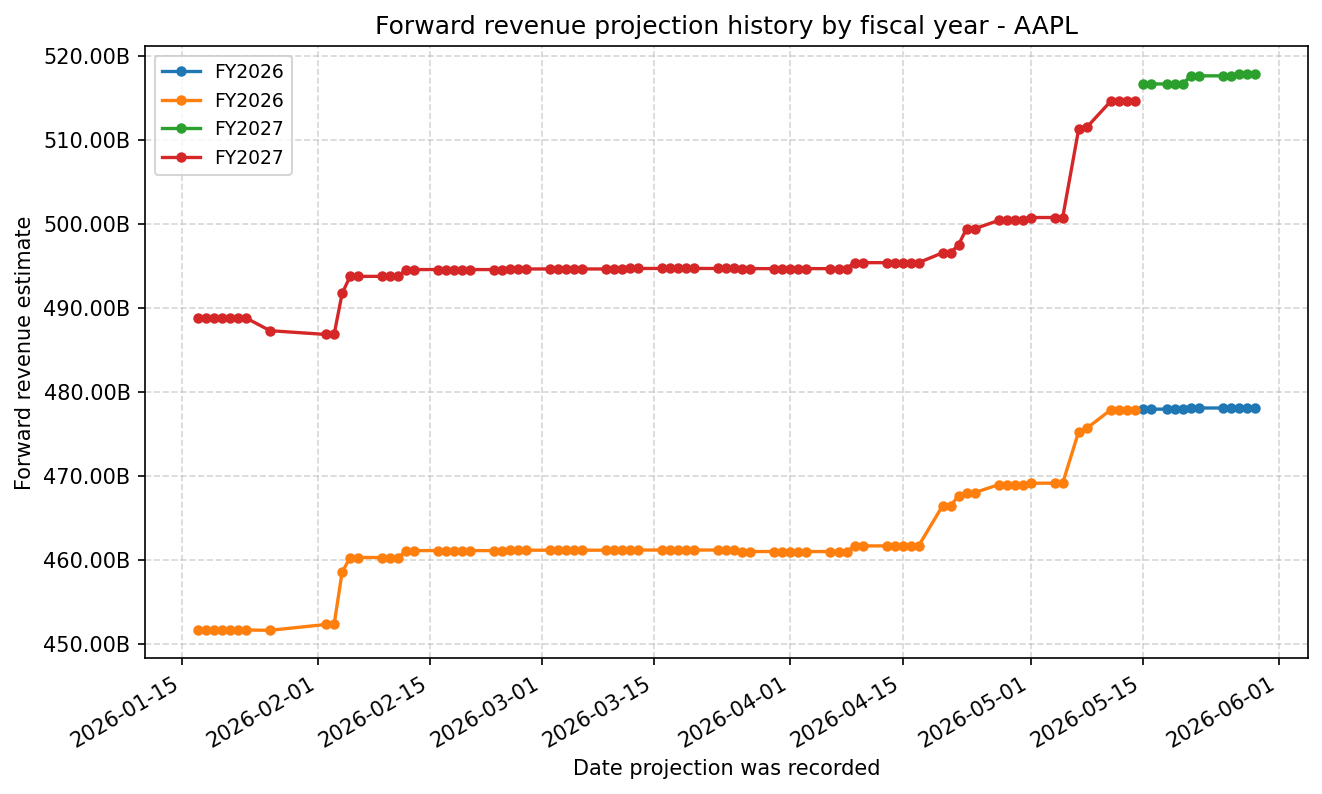
Forward Estimate History
How the next-FY EPS and revenue estimates have drifted over time. One line per fiscal year – past lines end when that FY became current.
Expenses
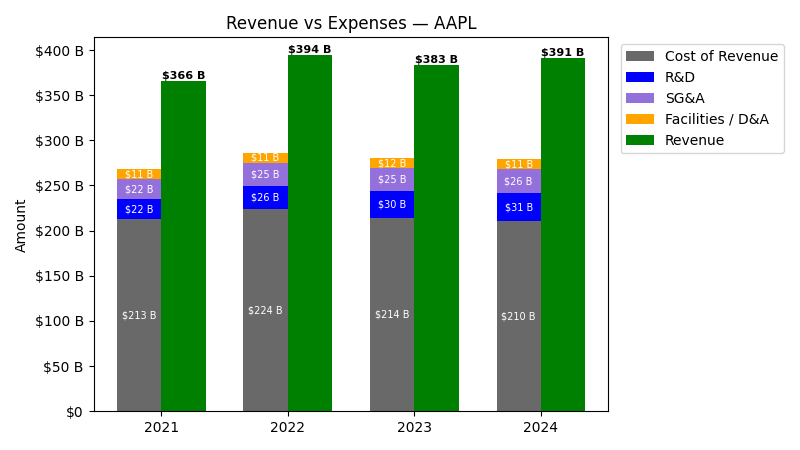
| Year | Revenue ($) | Cost of Revenue ($) | R&D ($) | SG&A ($) | Facilities / D&A ($) |
|---|---|---|---|---|---|
| 2022 | $394.3B | $212.4B | $26.3B | $25.1B | $11.1B |
| 2023 | $383.3B | $202.6B | $29.9B | $24.9B | $11.5B |
| 2024 | $391.0B | $198.9B | $31.4B | $26.1B | $11.4B |
| 2025 | $416.2B | $209.3B | $34.5B | $27.6B | $11.7B |
| TTM | $451.4B | $222.8B | $40.0B | $28.7B | $12.6B |
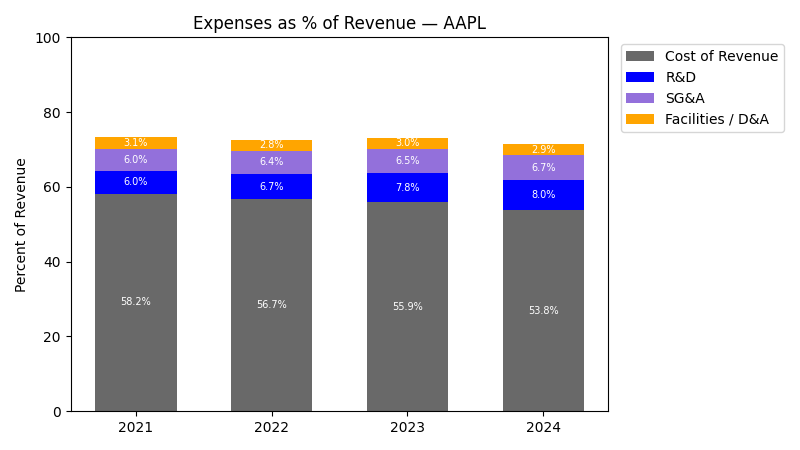
| Year | Revenue Change (%) | Cost of Revenue Change (%) | R&D Change (%) | SG&A Change (%) | Facilities / D&A Change (%) |
|---|---|---|---|---|---|
| 2023 | -2.80 | -4.62 | 13.96 | -0.65 | 3.74 |
| 2024 | 2.02 | -1.83 | 4.86 | 4.67 | -0.64 |
| 2025 | 6.43 | 5.21 | 10.14 | 5.76 | 2.21 |
| TTM | 8.48 | 6.45 | 15.88 | 3.86 | 7.80 |
No unmapped expenses.
Segment Performance
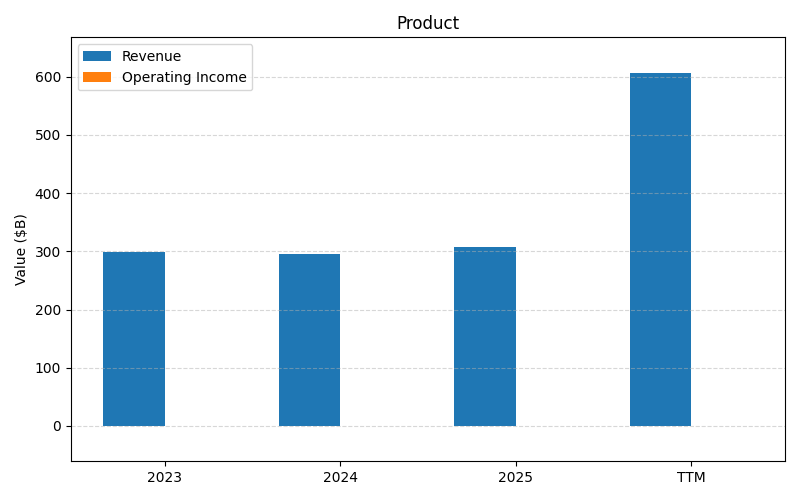
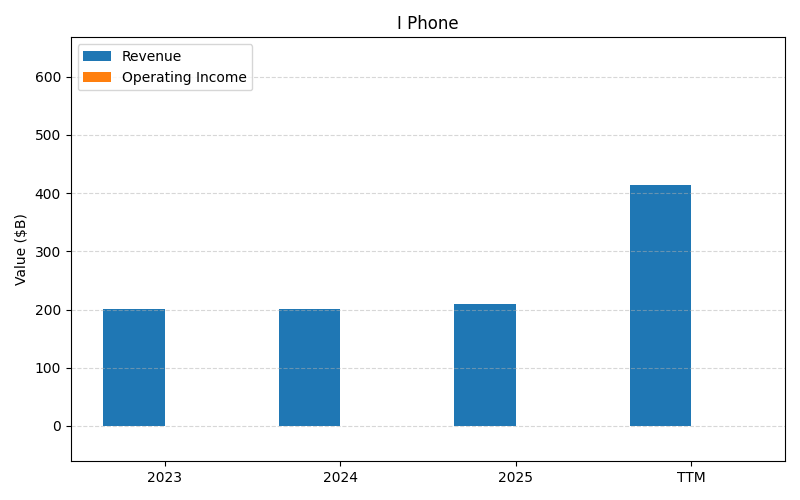
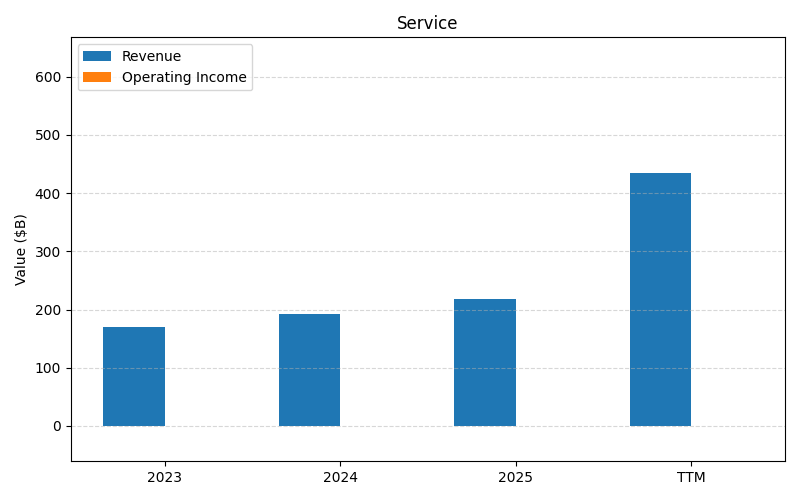
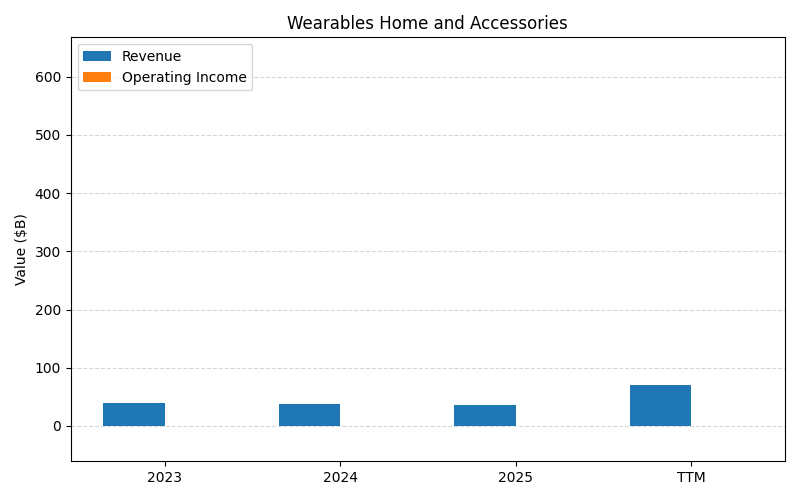
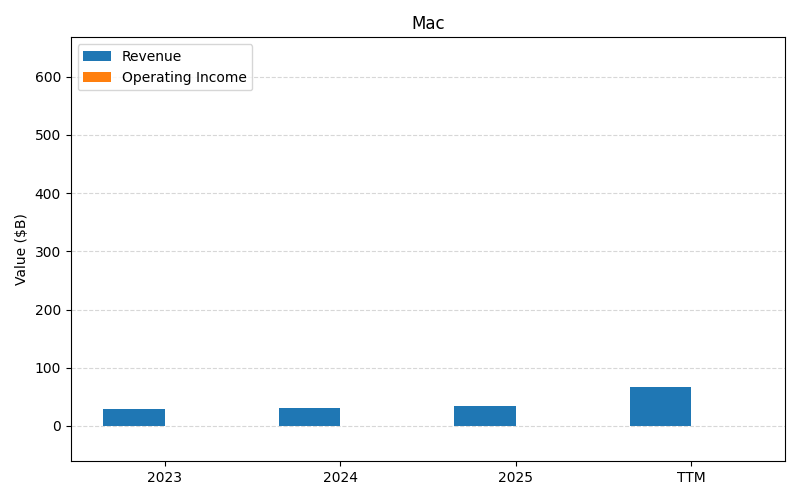
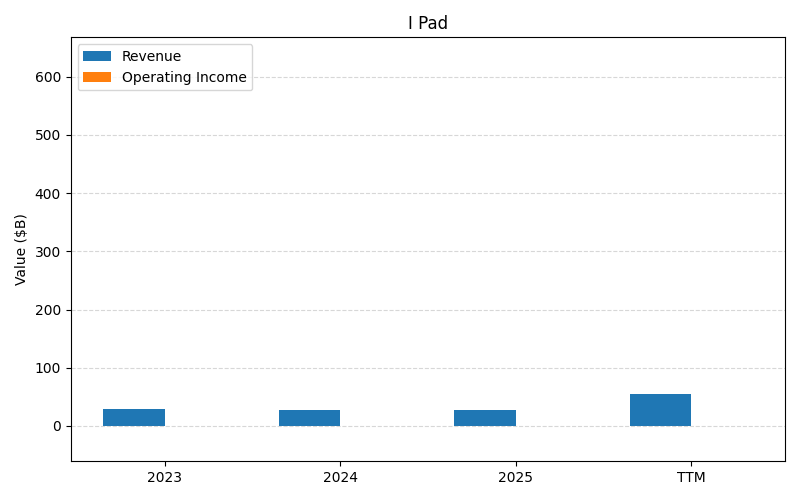
SEGMENTS v2025-09-09 · 2026-05-29 09:04 UTC — Units: $T. Rows list fiscal years (last 3 + TTM) with revenue for each segment; the final row shows the TTM revenue mix (operating income columns display “—” where mix is not applicable).
| Year | Prod Rev | iPhone Rev | Services Rev | Wearables Rev | Mac Rev | iPad Rev | Total Rev |
|---|---|---|---|---|---|---|---|
| 2023 | 0.30T | 0.20T | 0.17T | 0.04T | 0.03T | 0.03T | 0.77T |
| 2024 | 0.29T | 0.20T | 0.19T | 0.04T | 0.03T | 0.03T | 0.78T |
| 2025 | 0.31T | 0.21T | 0.22T | 0.04T | 0.03T | 0.03T | 0.83T |
| TTM | 1.11T | 0.77T | 0.75T | 0.13T | 0.11T | 0.10T | 2.98T |
| % of Total (TTM) | 37.3% | 26.0% | 25.3% | 4.3% | 3.8% | 3.3% | 100% |
Segment Performance (Axis 2)
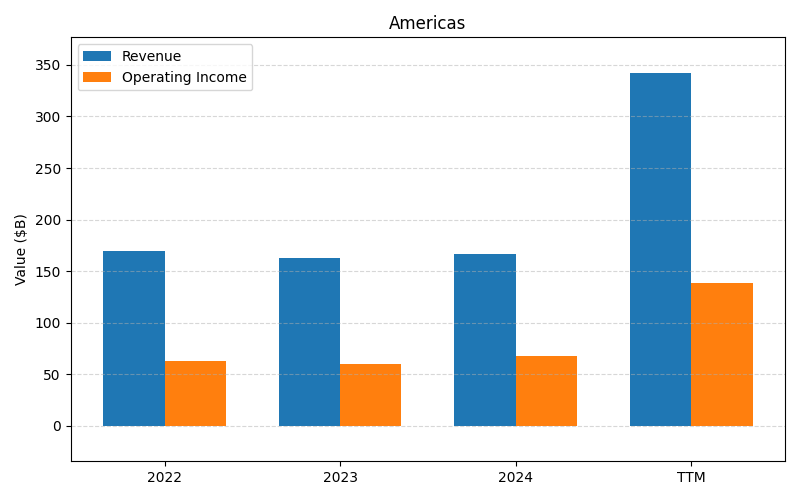
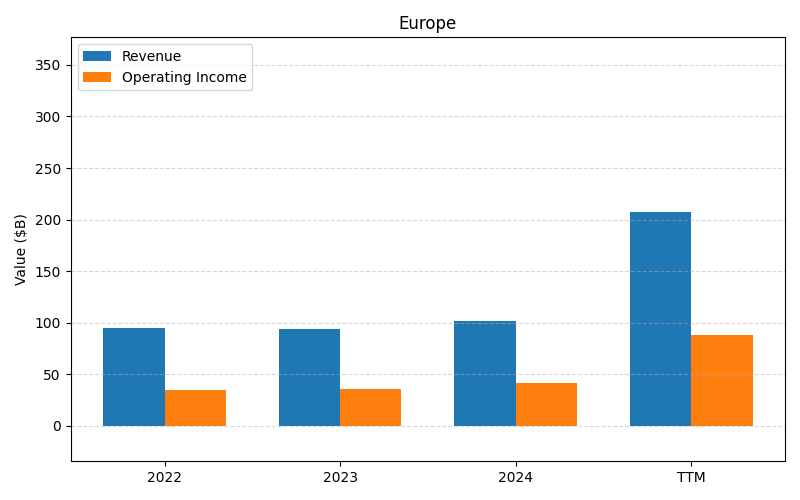
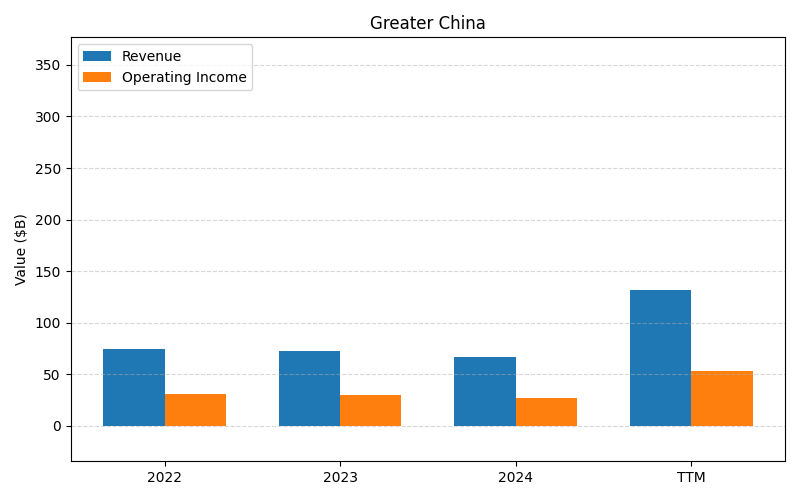
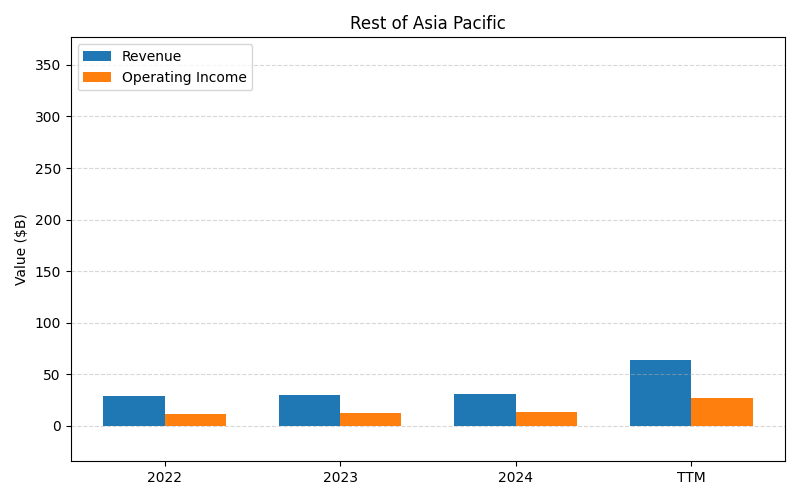
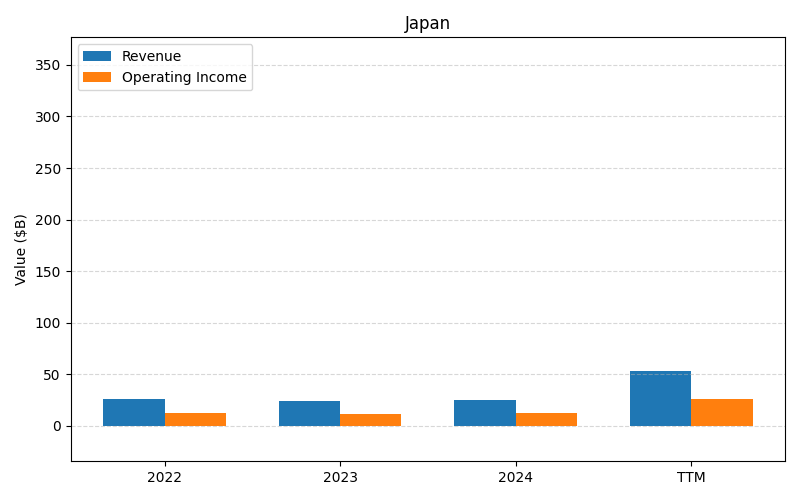
SEGMENTS v2025-09-09 · 2026-05-29 09:04 UTC — Units: $B. Rows list fiscal years (last 3 + TTM) with revenue and operating income for each segment; the final row shows the TTM revenue mix (operating income columns display “—” where mix is not applicable).
| Year | Americas Rev | Americas OI | Europe Rev | Europe OI | Greater China Rev | Greater China OI | Rest Of Asia Pacific Rev | Rest Of Asia Pacific OI | Japan Rev | Japan OI | Total Rev | Total OI |
|---|---|---|---|---|---|---|---|---|---|---|---|---|
| 2023 | 162.6B | 60.5B | 94.3B | 36.1B | 72.6B | 30.3B | 29.6B | 12.1B | 24.3B | 11.9B | 383.3B | 150.9B |
| 2024 | 167B | 67.7B | 101.3B | 41.8B | 67B | 27.1B | 30.7B | 13.1B | 25.1B | 12.5B | 391B | 162B |
| 2025 | 178.4B | 72.5B | 111B | 47.7B | 64.4B | 26.9B | 33.7B | 14.6B | 28.7B | 14B | 416.2B | 175.7B |
| TTM | 627.4B | 257.9B | 389.4B | 168.7B | 248.4B | 105.6B | 119.6B | 52.1B | 103.6B | 49.9B | 1488.3B | 634.2B |
| % of Total (TTM) | 42.2% | — | 26.2% | — | 16.7% | — | 8.0% | — | 7.0% | — | 100% | — |
Balance Sheet
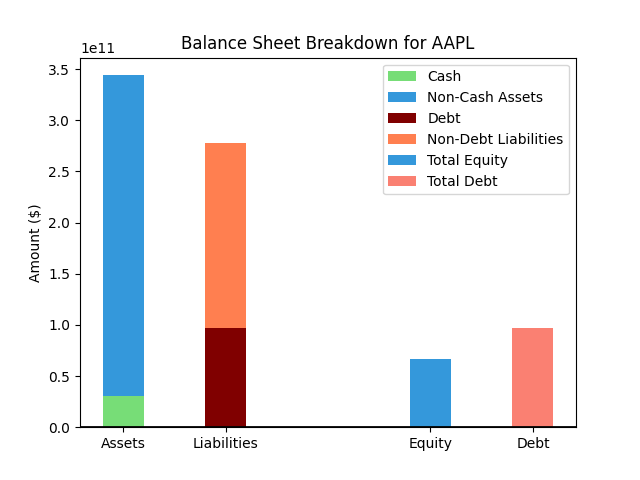
| Metric | Value | |
|---|---|---|
| 0 | Total Assets | $371,082M |
| 1 | Cash | $45,572M |
| 2 | Total Liabilities | $264,591M |
| 3 | Total Debt | $84,711M |
| 4 | Total Equity | $106,491M |
| 5 | Debt to Equity Ratio | 0.80 |
EPS & Dividend
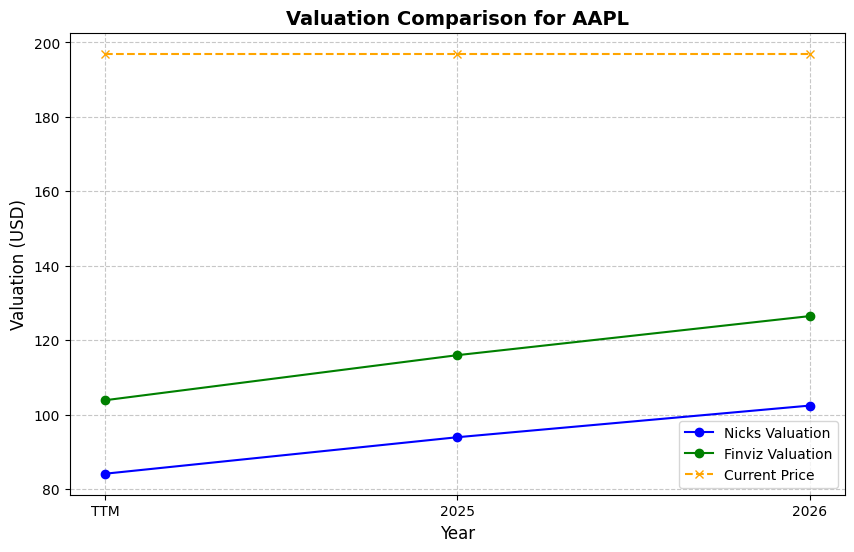
Valuation
| Share Price | Treasury Yield | Estimates | Fair Value (P/E) | Fair Value (P/S) | Current P/S | Current P/E |
|---|---|---|---|---|---|---|
| $312.06 | 4.5% | Nicks Growth: 10% Nick's Expected Margin: 25% FINVIZ Growth: 12% |
Nicks: 17 Finviz: 22 |
Nick's: 4.289 | 10.2 | 37.8 |
| Basis | Year | Nicks Valuation | Nicks vs Share Price | Finviz Valuation | Finviz vs Share Price |
|---|---|---|---|---|---|
| $8.25 EPS | TTM | $141.55 | -54.6% | $178.72 | -42.7% |
| $8.75 EPS | 2026 | $150.19 | -51.9% | $189.62 | -39.2% |
| $9.66 EPS | 2027 | $165.66 | -46.9% | $209.16 | -33.0% |
Implied Growth
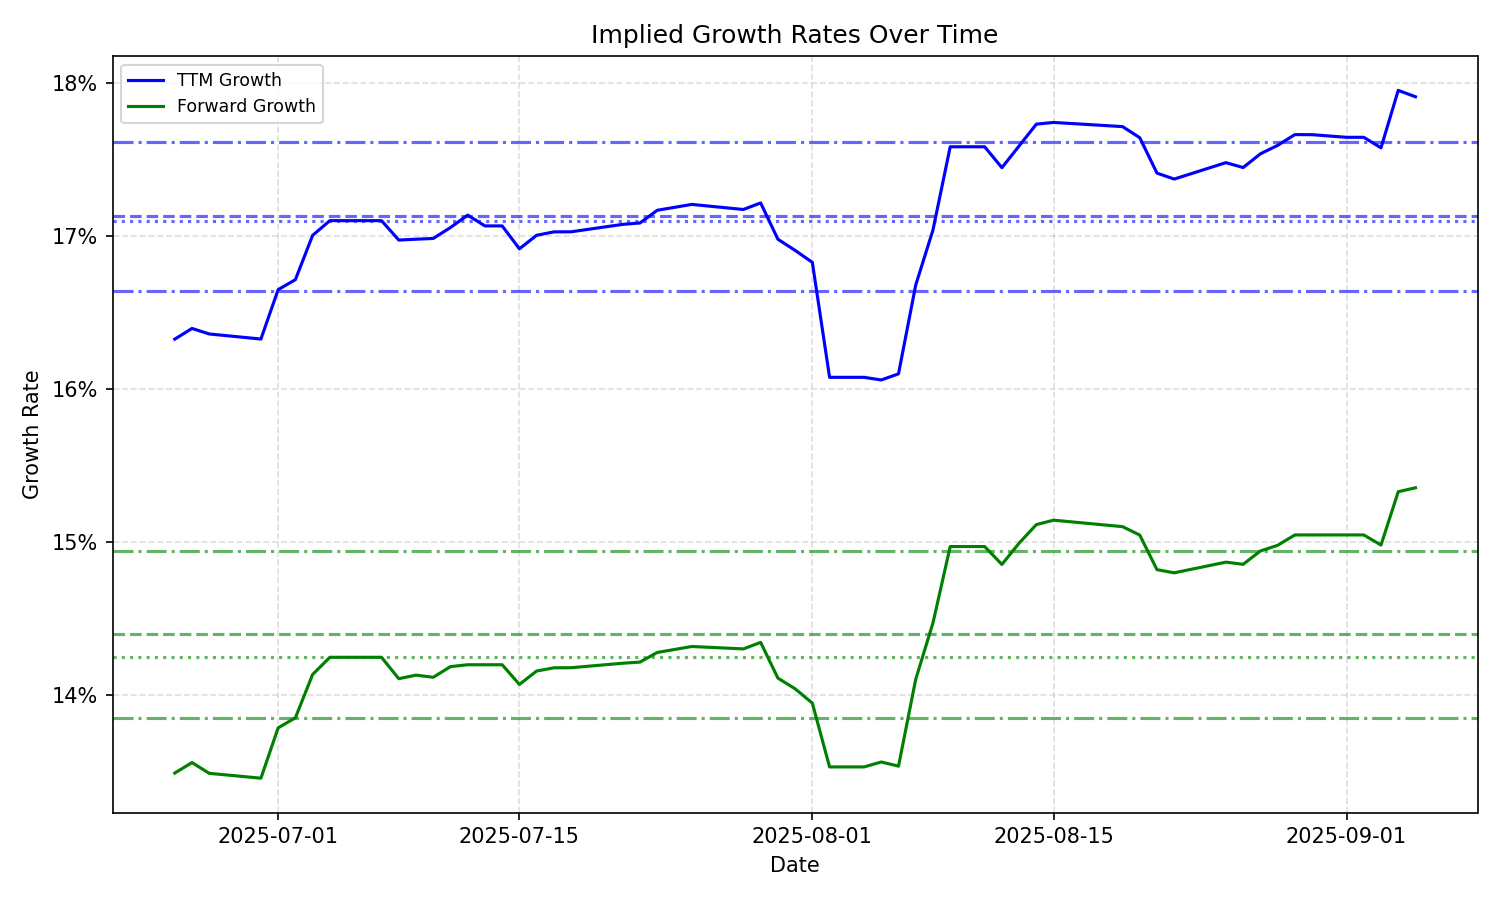
| Average | Median | Std Dev | Current | Percentile | ||||||
|---|---|---|---|---|---|---|---|---|---|---|
| TTM | Forward | TTM | Forward | TTM | Forward | TTM | Forward | TTM | Forward | |
| Timeframe | ||||||||||
| 1 Year | 17.55% | 15.39% | 17.54% | 15.20% | 0.69% | 0.89% | 18.70% | 16.97% | 95.4% | 97.1% |
| 3 Years | 17.55% | 15.39% | 17.54% | 15.20% | 0.69% | 0.89% | 18.70% | 16.97% | 95.4% | 97.1% |
| 5 Years | 17.55% | 15.39% | 17.54% | 15.20% | 0.69% | 0.89% | 18.70% | 16.97% | 95.4% | 97.1% |
| 10 Years | 17.55% | 15.39% | 17.54% | 15.20% | 0.69% | 0.89% | 18.70% | 16.97% | 95.4% | 97.1% |