American Airlines Group, Inc. — AAL
| Close Price | Market Cap | P/E Ratio | Forward P/E Ratio | Implied Growth* | Implied Forward Growth* | Dividend | P/B Ratio |
|---|---|---|---|---|---|---|---|
| $14.64 | $9.68B | 47.2 | 6.6 | 21.2% | 0.3% | - | -2.4 |
Latest Headlines
- · Larry Kudlow: The ‘Trumpian Economy’ Is Booming Despite the Gas Price Noise
- · American Airlines Keeps Climbing. We Still Like the Stock.
- · Airline CEOs Defend Demand As Fuel Costs Hit Consumers
- · Does American Airlines (AAL) Starlink Bet Reframe Its Premium and Loyalty Strategy Edge?
- · FedEx Freight Holding Set to Join Dow Jones Transportation Average
- · SpaceX Starship Grounded After Mishap. Pentagon Awards Contract, Debates Starlink Prices.
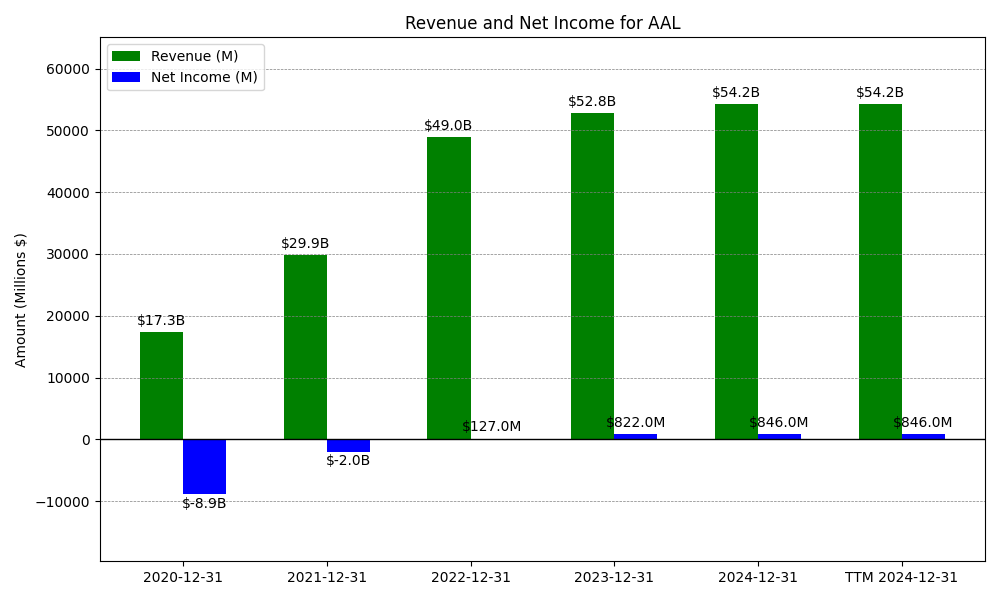
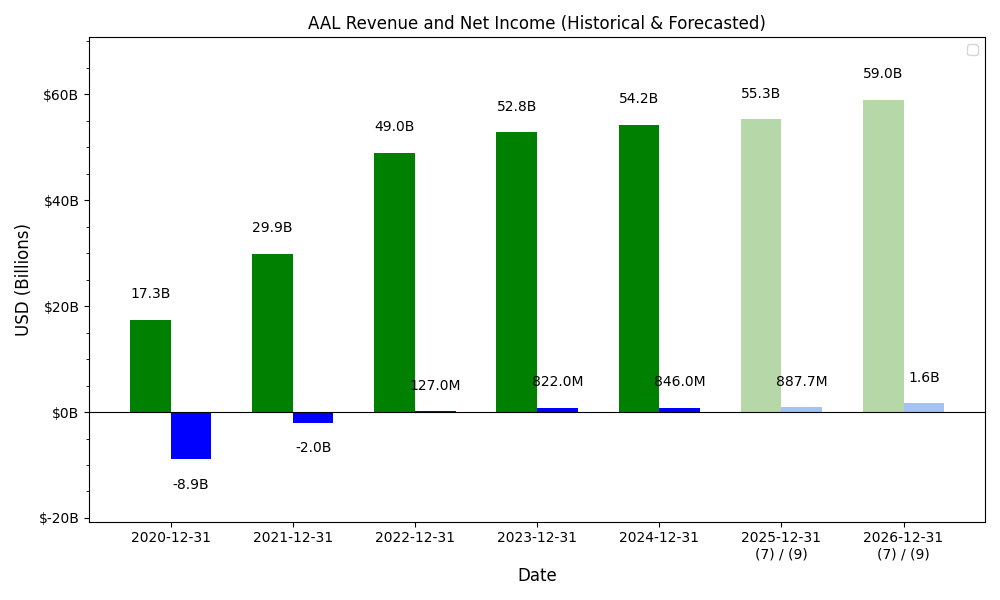
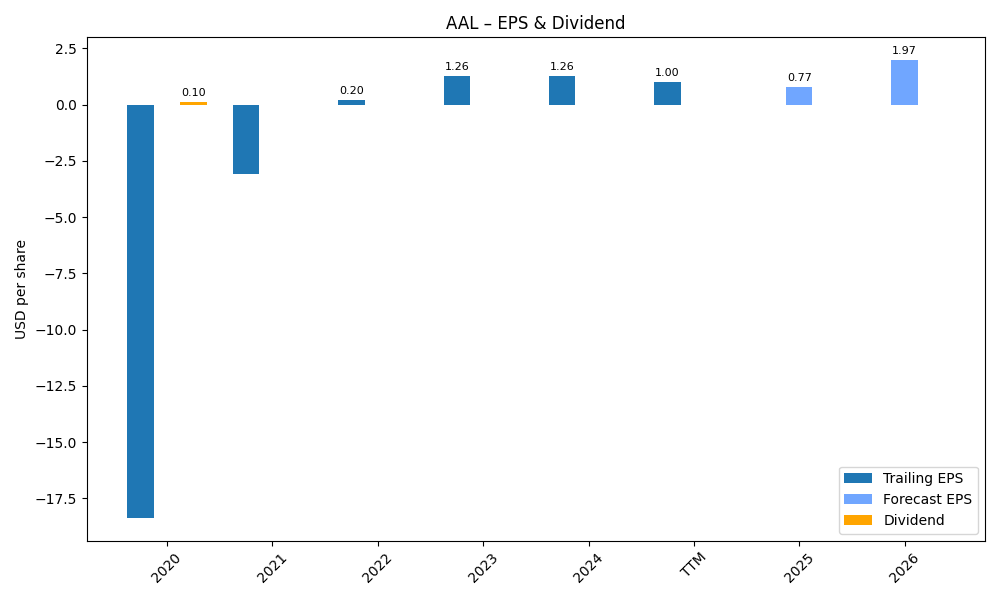
Revenue & Net Income
| Date | Revenue | Net_Income | EPS | Last_Updated | Revenue_Change | Net_Income_Change | EPS_Change | |
|---|---|---|---|---|---|---|---|---|
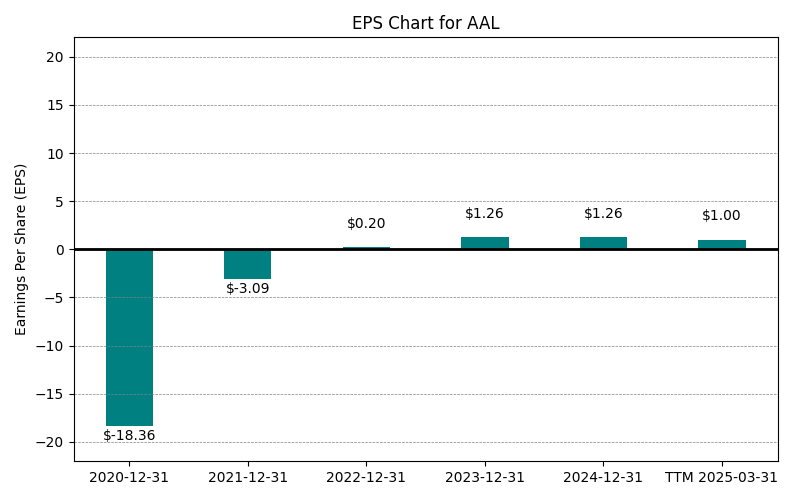
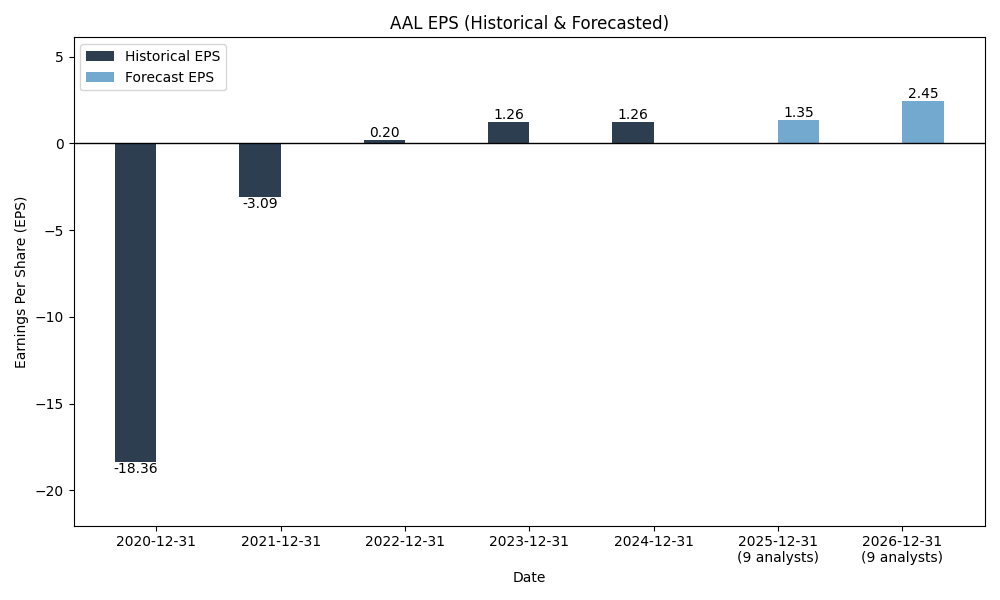
| 0 | 2020-12-31 | $17,337M | $-8,885M | $-18.36 | 2024-02-09 03:58:57 | N/A | N/A | N/A |
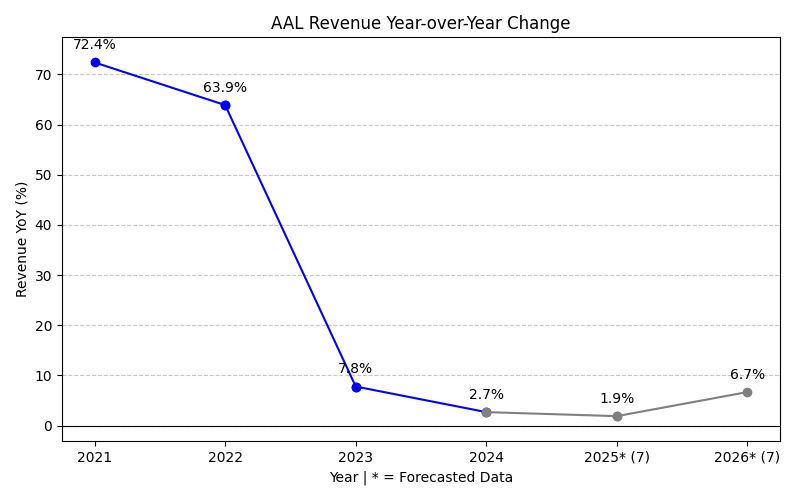
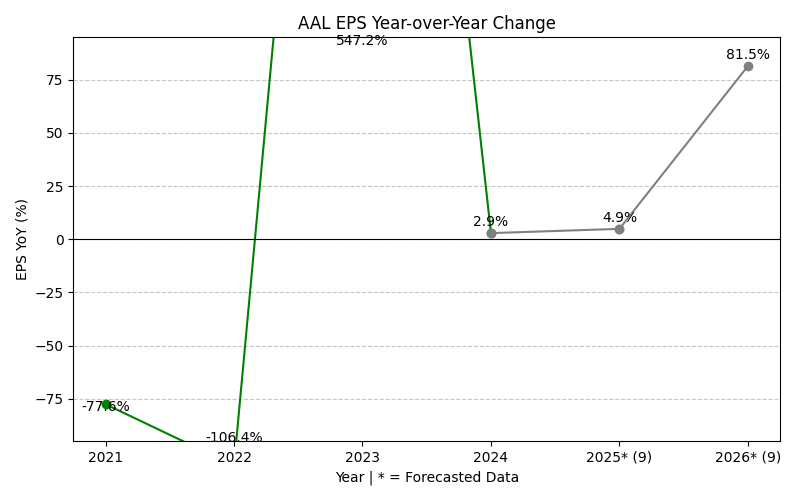
| 1 | 2021-12-31 | $29,882M | $-1,993M | $0.20 | 2026-02-27 08:30:36 | 72.4% | -77.6% | -101.1% |
| 2 | 2022-12-31 | $48,971M | $127M | $0.20 | 2026-05-29 09:04:03 | 63.9% | -106.4% | 0.0% |
| 3 | 2023-12-31 | $52,788M | $822M | $1.26 | 2026-05-29 09:04:03 | 7.8% | 547.2% | 530.0% |
| 4 | 2024-12-31 | $54,211M | $846M | $1.29 | 2026-05-29 09:04:03 | 2.7% | 2.9% | 2.4% |
| 5 | 2025-12-31 | $54,633M | $111M | $0.17 | 2026-05-29 09:04:03 | 0.8% | -86.9% | -86.8% |
| 6 | TTM 2026-03-31 | $55,994M | $202M | $0.31 | 2026-04-27 08:47:53 | 2.5% | 82.0% | 82.4% |
EPS
Forecasts
Y/Y % Change
AAL Year-over-Year Growth
| 2020 | 2021 | 2022 | 2023 | 2024 | 2025 | 2026 | 2027 | Average | |
|---|---|---|---|---|---|---|---|---|---|
| Revenue Growth (%) | 72.4% | 63.9% | 7.8% | 2.7% | 0.8% | 13.8% | 3.8% | 23.6% | |
| Revenue Analysts (#) | 0 | 0 | 0 | 0 | 0 | 0 | 21 | 21 | |
| EPS Growth (%) | -77.6% | -106.4% | 547.2% | 2.9% | -86.9% | -135.8% | -3809.4% | -523.7% | |
| EPS Analysts (#) | 0 | 0 | 0 | 0 | 0 | 0 | 24 | 24 |
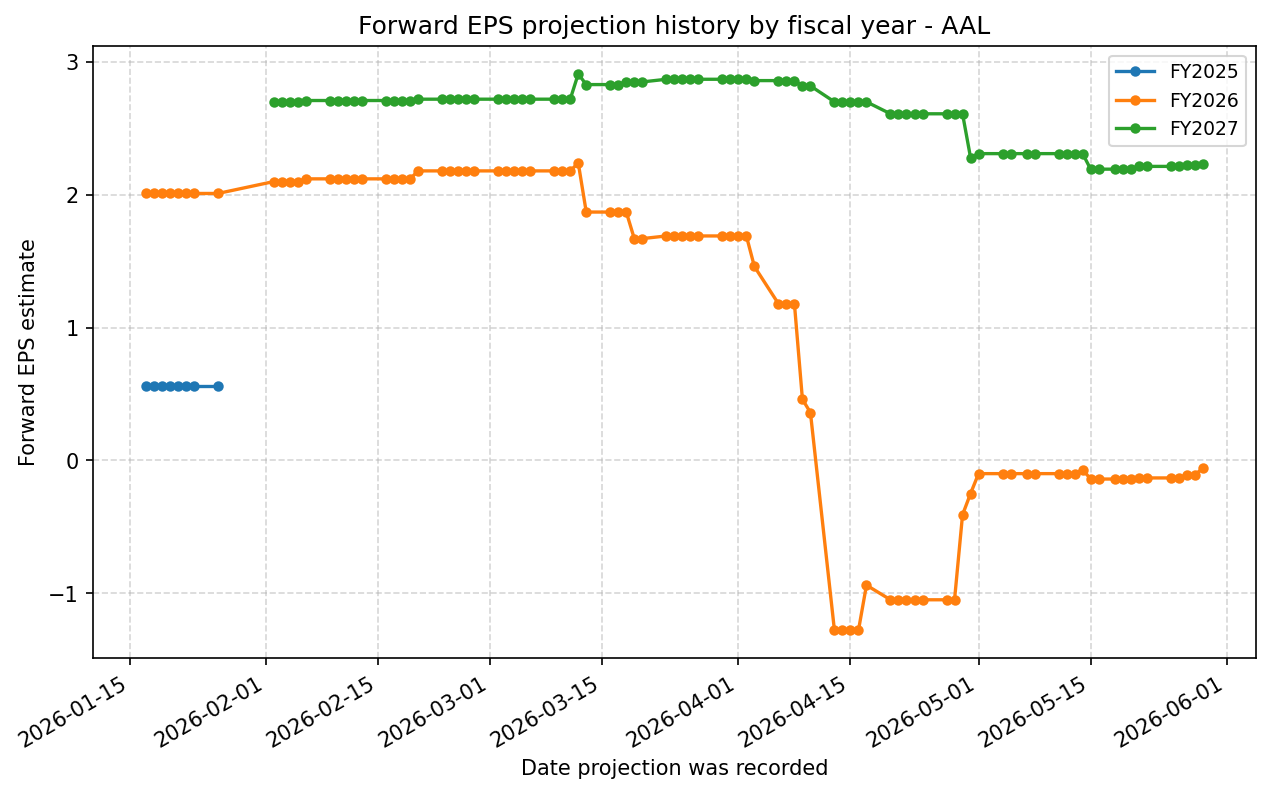
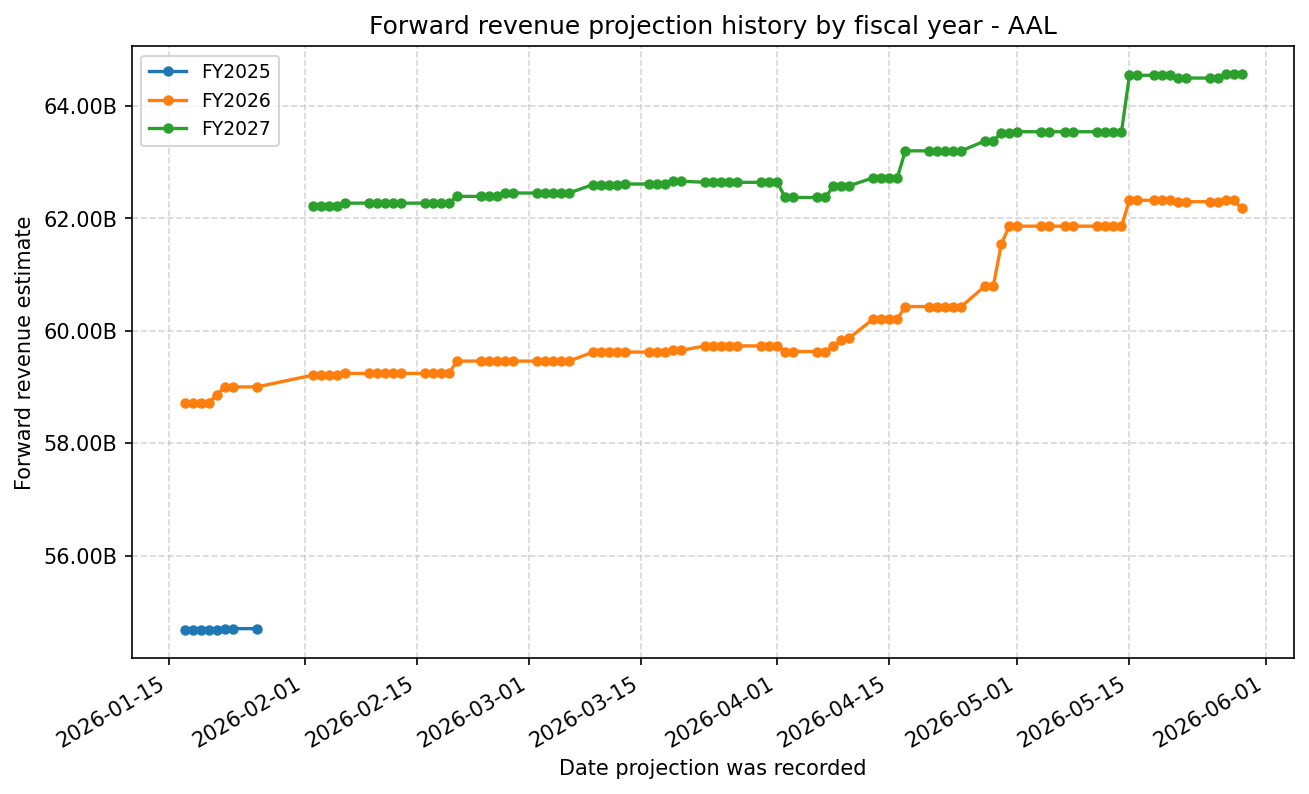
Forward Estimate History
How the next-FY EPS and revenue estimates have drifted over time. One line per fiscal year – past lines end when that FY became current.
Expenses
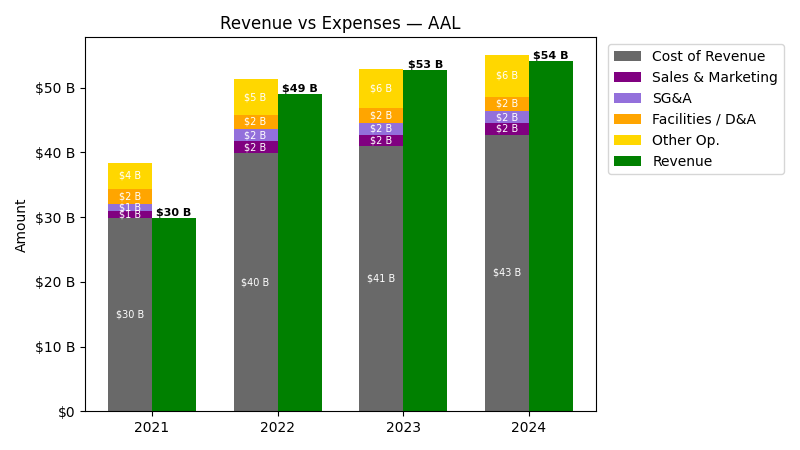
| Year | Revenue ($) | Cost of Revenue ($) | Sales & Marketing ($) | SG&A ($) | Facilities / D&A ($) |
|---|---|---|---|---|---|
| 2022 | $49.0B | $37.6B | $1.8B | $1.8B | $2.3B |
| 2023 | $52.8B | $38.8B | $1.8B | $1.8B | $2.2B |
| 2024 | $54.2B | $40.5B | $1.8B | $1.8B | $2.2B |
| 2025 | $54.6B | $42.0B | $2.0B | $2.0B | $2.2B |
| TTM | $56.0B | $40.4B | $2.1B | $2.1B | $4.8B |
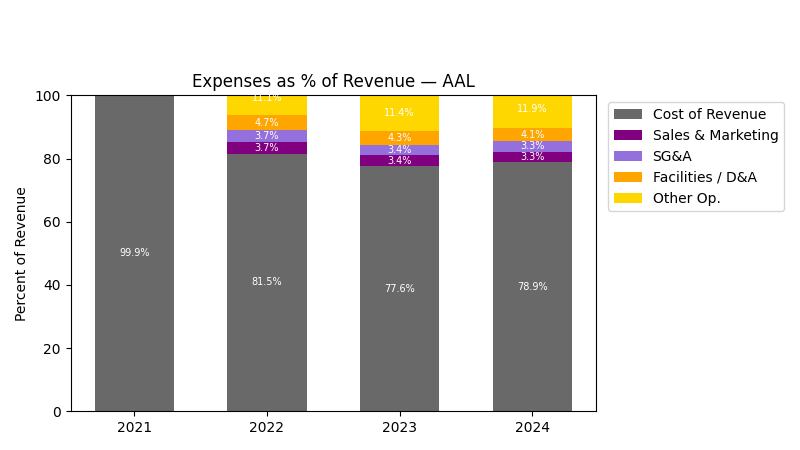
| Year | Revenue Change (%) | Cost of Revenue Change (%) | Sales & Marketing Change (%) | SG&A Change (%) | Facilities / D&A Change (%) |
|---|---|---|---|---|---|
| 2023 | 7.79 | 3.04 | -0.88 | -0.88 | -4.35 |
| 2024 | 2.70 | 4.56 | 0.72 | 0.72 | 0.00 |
| 2025 | 0.78 | 3.54 | 10.21 | 10.21 | -0.96 |
| TTM | 2.49 | -3.83 | 2.90 | 2.90 | 119.15 |
No unmapped expenses.
Segment Performance
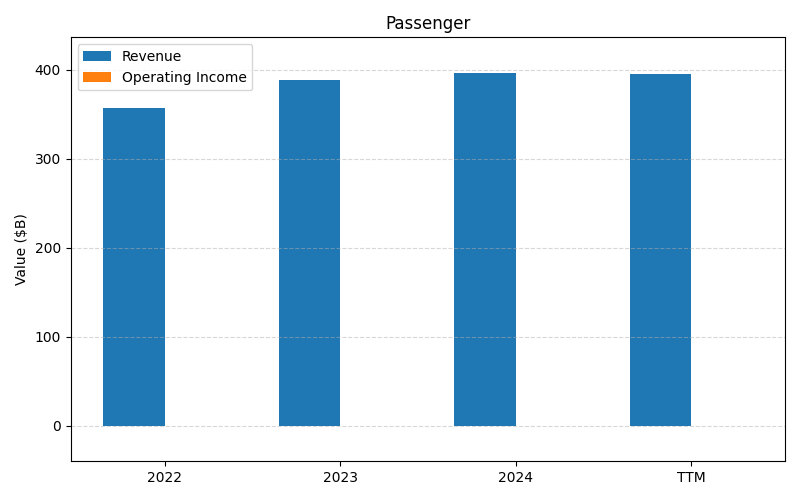
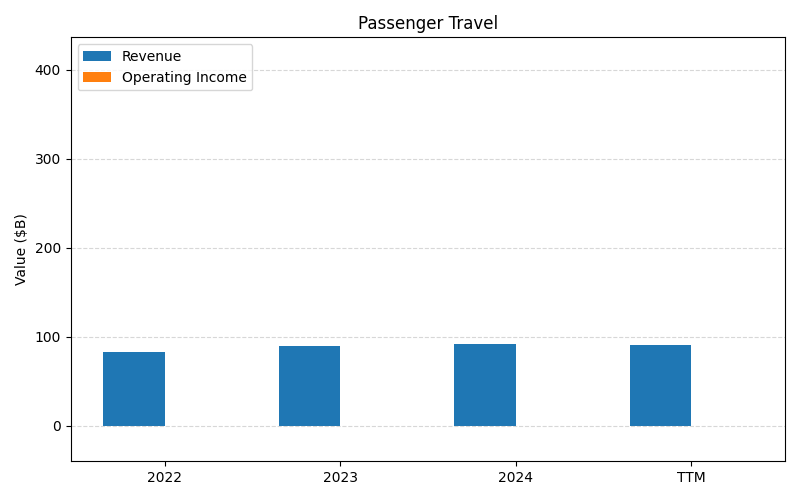
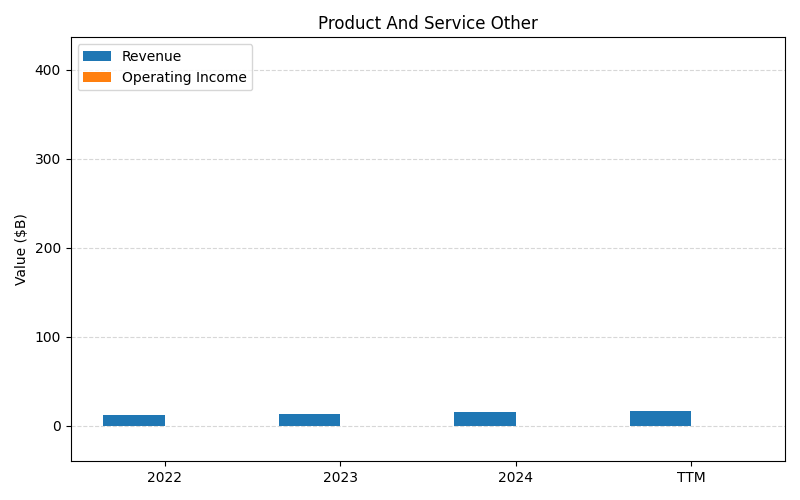

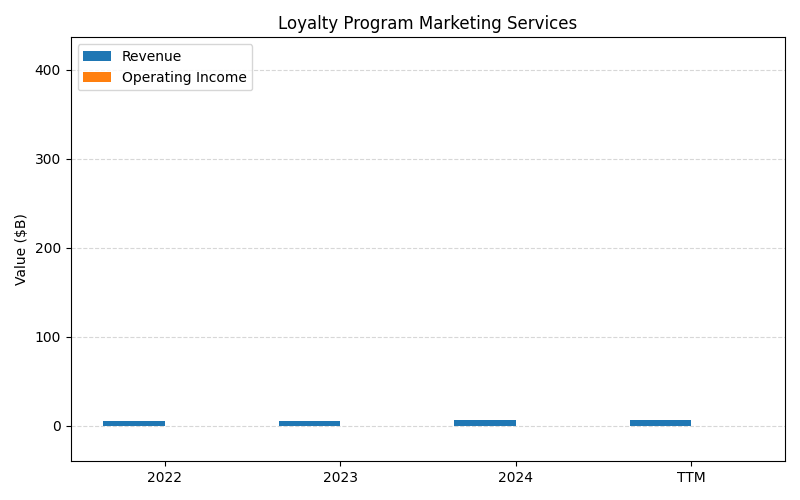
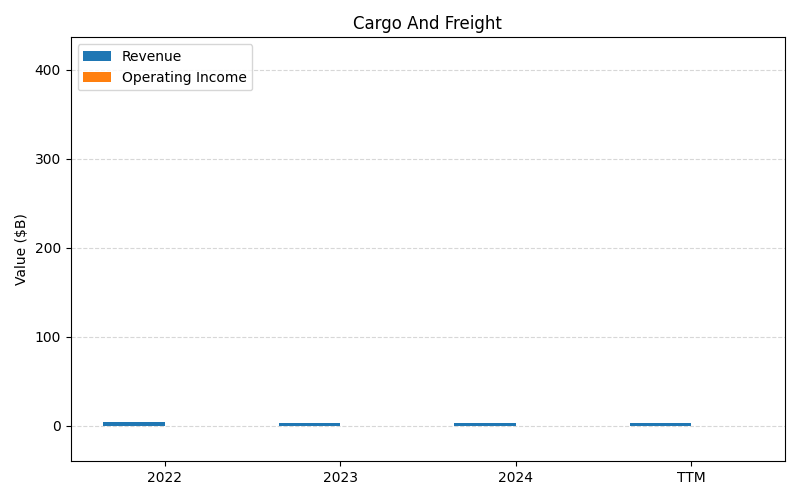
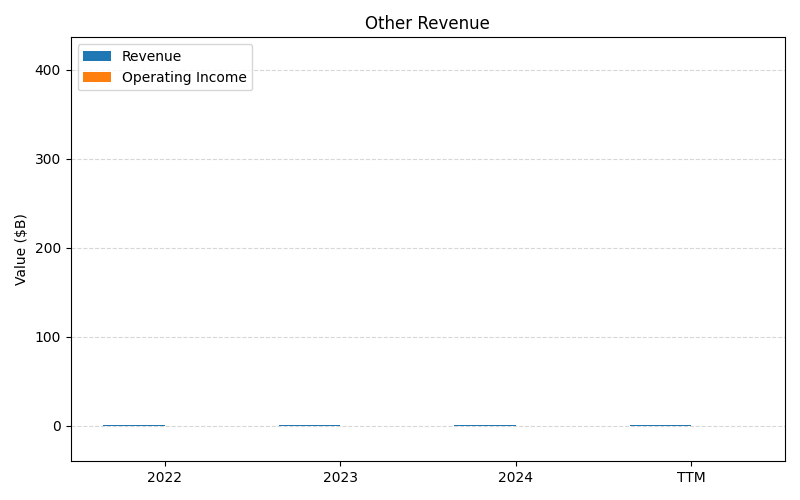
SEGMENTS v2025-09-09 · 2026-05-29 09:04 UTC — Units: $B. Rows list fiscal years (last 3 + TTM) with revenue for each segment; the final row shows the TTM revenue mix (operating income columns display “—” where mix is not applicable).
| Year | Passenger Rev | Passenger Travel Rev | Product And Service Other Rev | Loyalty Program Travel Redemptions Rev | Loyalty Program Marketing Services Rev | Cargo And Freight Rev | Other Revenue Rev | Total Rev |
|---|---|---|---|---|---|---|---|---|
| 2023 | 388.1B | 89.8B | 13.8B | 7.20B | 5.86B | 3.25B | 1.07B | 509.1B |
| 2024 | 396.7B | 91.5B | 15.3B | 7.69B | 6.51B | 3.22B | 1.12B | 522B |
| 2025 | 397.1B | 91.2B | 16.6B | 8.07B | 7.02B | 3.36B | 1.27B | 524.7B |
| TTM | 984.9B | 226.7B | 40.5B | 19.6B | 17.2B | 8.18B | 3.04B | 1300.2B |
| % of Total (TTM) | 75.8% | 17.4% | 3.1% | 1.5% | 1.3% | 0.6% | 0.2% | 100% |
Balance Sheet
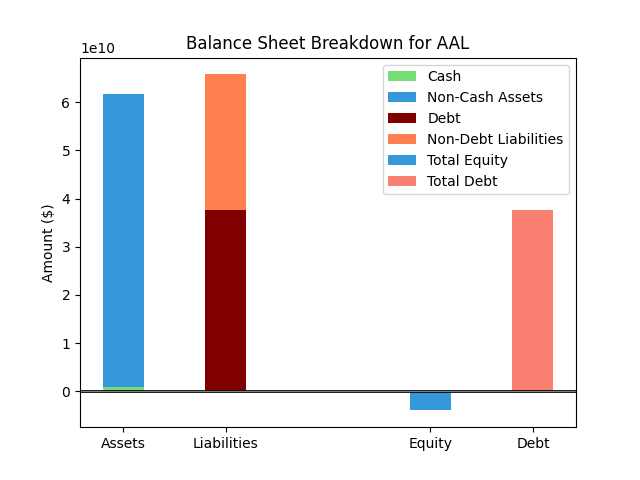
| Metric | Value | |
|---|---|---|
| 0 | Total Assets | $63,738M |
| 1 | Cash | $903M |
| 2 | Total Liabilities | $67,815M |
| 3 | Total Debt | $34,892M |
| 4 | Total Equity | $-4,077M |
| 5 | Debt to Equity Ratio | -8.56 |
EPS & Dividend
Valuation
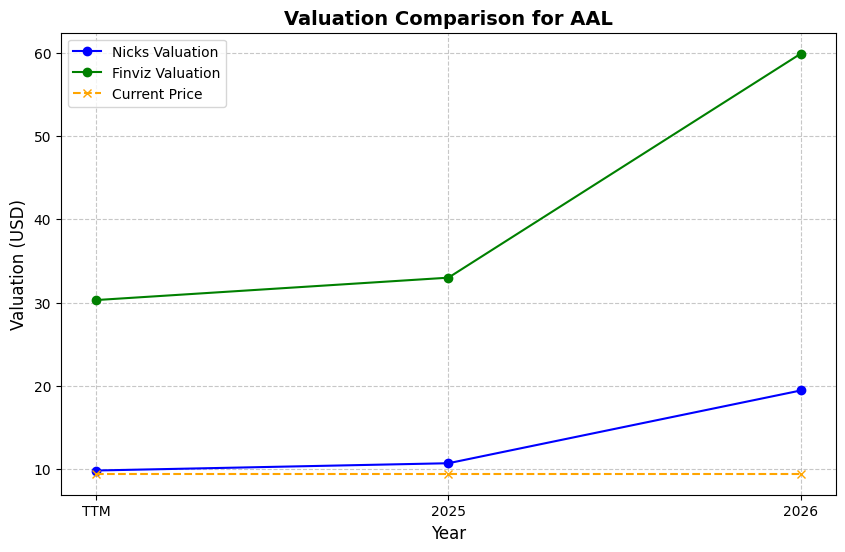
| Share Price | Treasury Yield | Estimates | Fair Value (P/E) | Fair Value (P/S) | Current P/S | Current P/E |
|---|---|---|---|---|---|---|
| $14.64 | 4.5% | Nicks Growth: 2% Nick's Expected Margin: 2% FINVIZ Growth: 106% |
Nicks: 8 Finviz: 11104 |
Nick's: 0.156 | 0.2 | 47.2 |
| Basis | Year | Nicks Valuation | Nicks vs Share Price | Finviz Valuation | Finviz vs Share Price |
|---|---|---|---|---|---|
| $0.31 EPS | TTM | $2.42 | -83.5% | $3442.30 | 23413.0% |
| $94.01 Revenue | 2026 | $14.67 | 0.2% | $20877.32 | 142504.7% |
| $2.23 EPS | 2027 | $17.38 | 18.7% | $24746.69 | 168934.7% |
Implied Growth
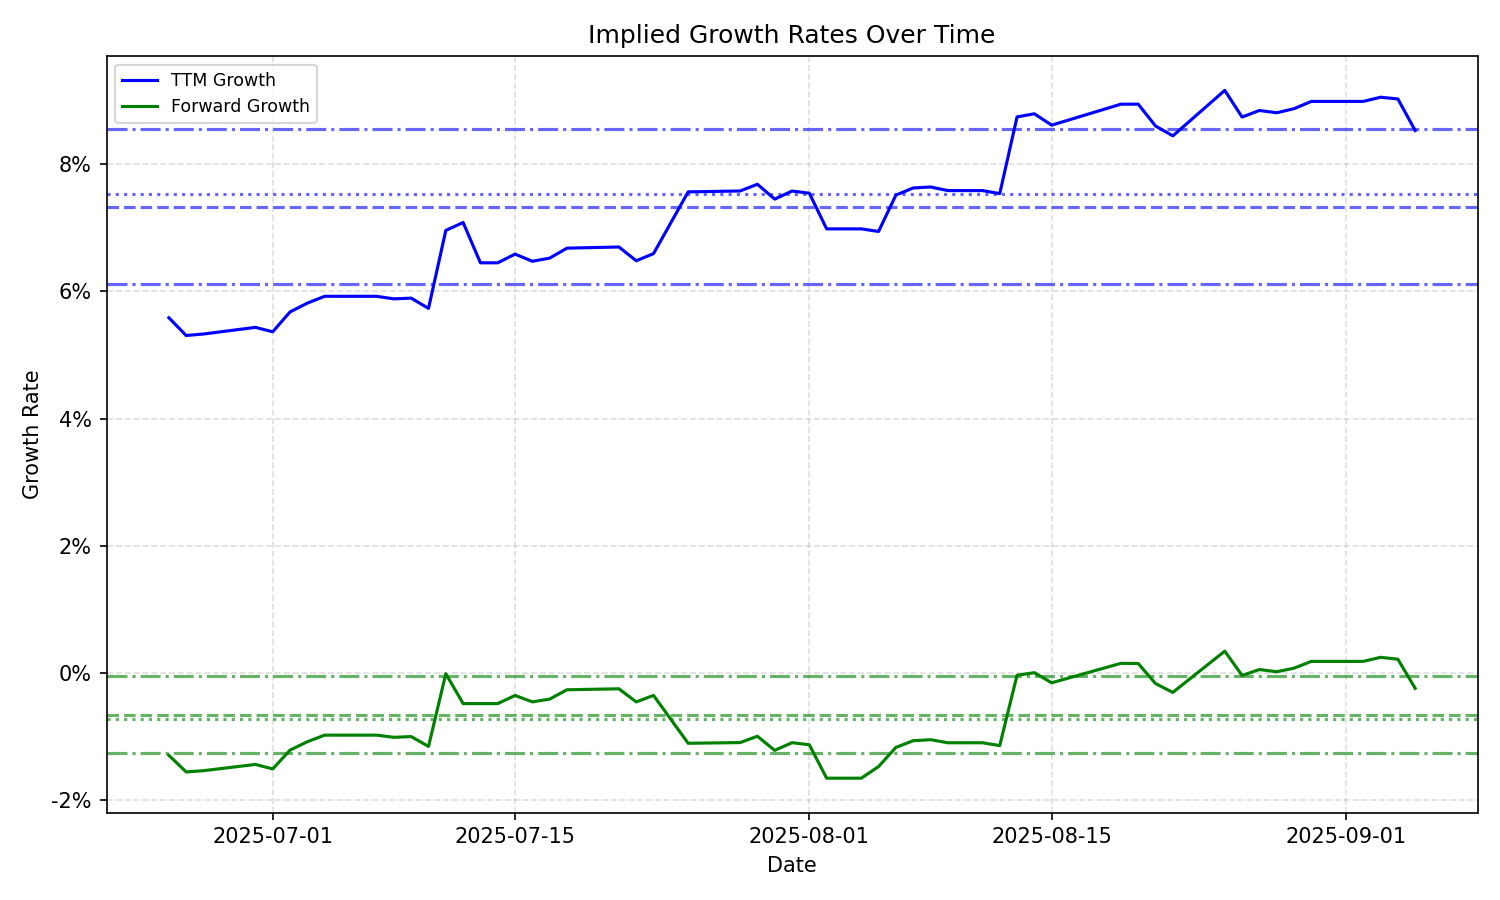
| Average | Median | Std Dev | Current | Percentile | ||||||
|---|---|---|---|---|---|---|---|---|---|---|
| TTM | Forward | TTM | Forward | TTM | Forward | TTM | Forward | TTM | Forward | |
| Timeframe | ||||||||||
| 1 Year | 13.46% | -0.91% | 8.96% | -0.83% | 7.70% | 1.74% | 21.26% | 0.35% | 76.2% | 83.3% |
| 3 Years | 13.46% | -0.91% | 8.96% | -0.83% | 7.70% | 1.74% | 21.26% | 0.35% | 76.2% | 83.3% |
| 5 Years | 13.46% | -0.91% | 8.96% | -0.83% | 7.70% | 1.74% | 21.26% | 0.35% | 76.2% | 83.3% |
| 10 Years | 13.46% | -0.91% | 8.96% | -0.83% | 7.70% | 1.74% | 21.26% | 0.35% | 76.2% | 83.3% |